Tag: apm

  • 5 Key Performance Metrics to Track in 2023

    5 Key Performance Metrics to Track in 2023

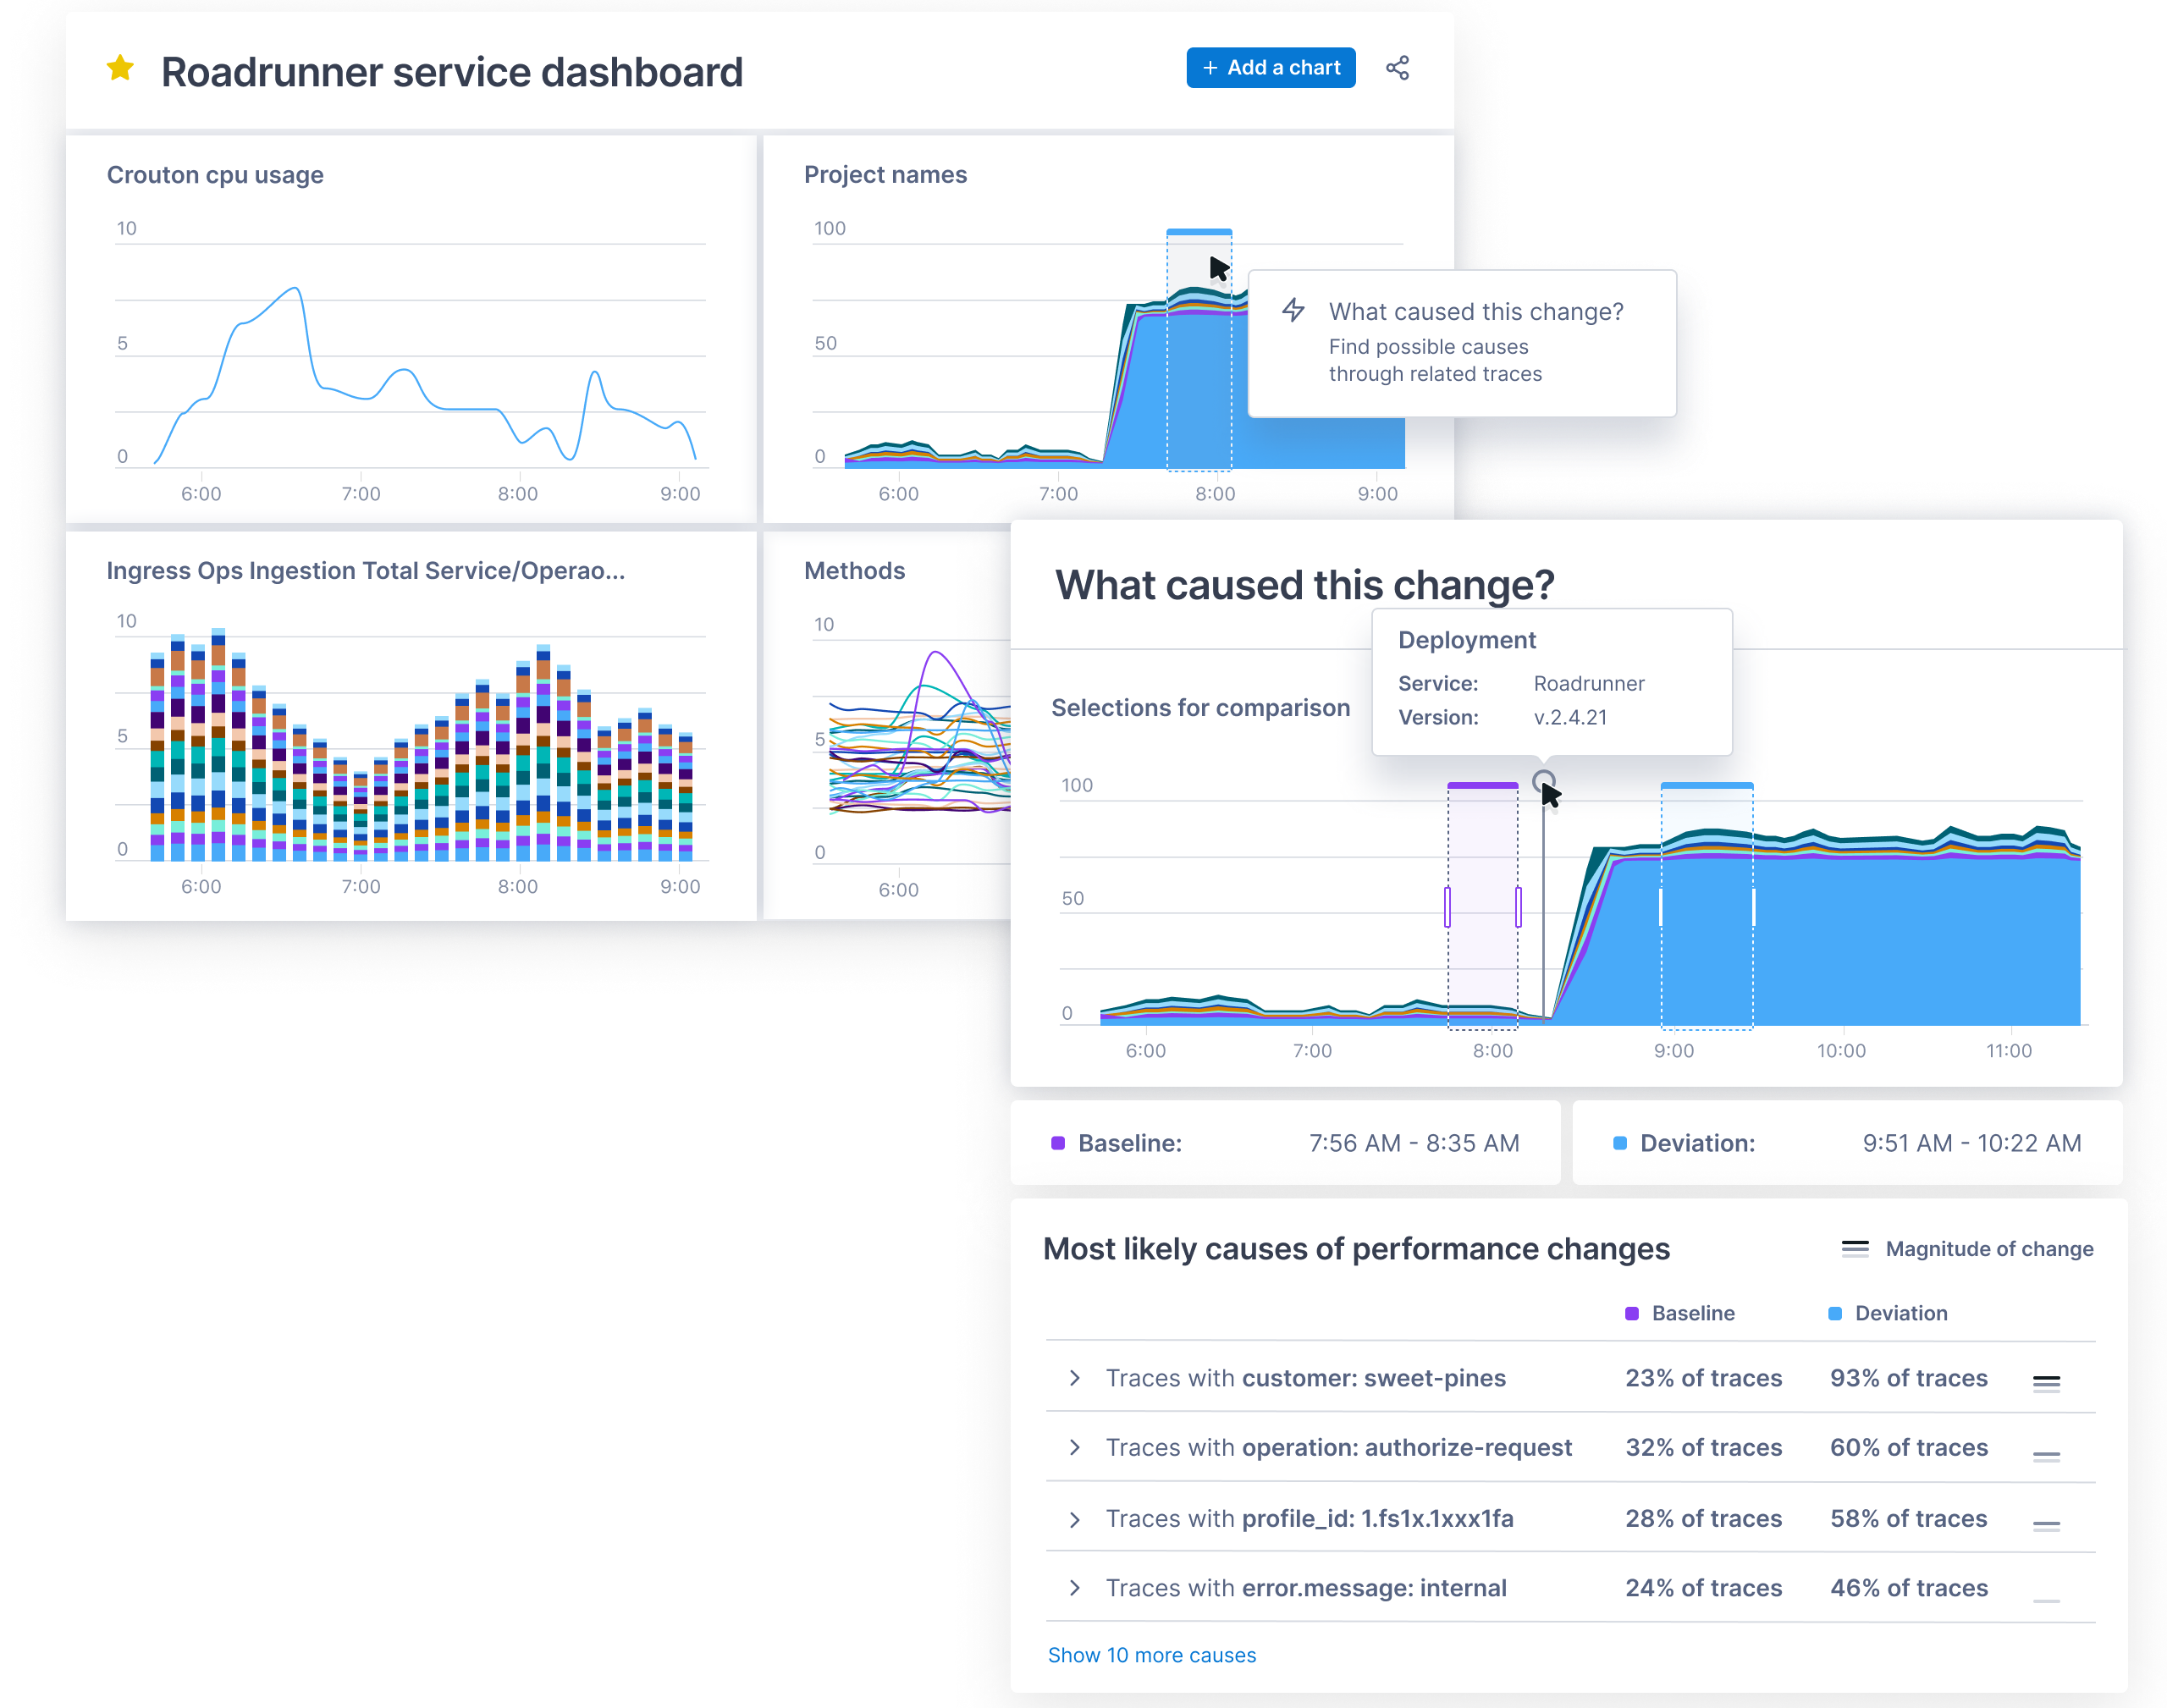
    It’s never a bad time to adopt healthy new habits for the mind and body, and for developers, it’s always a good time to consider new best practices at work. As 2023 rolls on, I’ve been thinking about some key performance metrics that help to ensure critical applications and websites perform optimally throughout the year—especially during unpredictable spikes.

    To see why this is important, just look at the problems Ticketmaster had in November 2022 when Taylor Swift’s concert tickets went on sale. Fans of the pop idol (including me!) swamped the Ticketmaster site and brought the system to its knees, resulting in frustrated customers and a wave of bad publicity for the company.

    These usage spikes and the problems they can produce are not uncommon. The holiday sales period, starting with Black Friday and Cyber Monday, is notorious for technical issues that can cost retailers millions due to lost sales and other problems. And it’s not just retail. A few years ago, the Internal Revenue Service (IRS) had to extend its tax deadline after a rush of last-minute filers knocked its systems offline.

    Fortunately, developers can mitigate these problems with the right planning and practices in place. There are key performance metrics that developer teams should monitor, especially in times of peak traffic, to avoid application crashes, long wait times—and burnout for the teams who have to fix these problems when they arise.

    Here are the five performance metrics developers should be tracking in 2023—especially on their busiest days of the year.

    Web Vitals

    The largest contentful paint, or LCP, measures the load speed of a webpage. Having a fast LCP is a clear sign that a customer’s experience is optimal as they toggle between pages. In tandem, the cumulative layout shift, or CLS, scores how a user is experiencing unexpected layout shifts. This plays out on busy shopping days: Typically, these pages have ad and sales notifications that affect a brand’s main page layout, potentially causing shoppers to experience unexpected shifts. This can reduce their ability to shop and becomes a hindrance if a developer cannot quickly access and address the issue.

    Error Count Vs. Error Rate

    Error counts typically increase alongside site traffic as more people flock to a website—that’s a natural occurrence. The error rate is more telling because it reveals if a greater proportion of users are experiencing issues with your application or website. Developers who see an increase in this metric should investigate and take action.

    Mobile Monitoring

    More and more consumers are using their mobile devices to shop and manage all aspects of their lives. For example, mobile accounted for 45% of sales during the holiday shopping period in 2022 from October to December. Mobile performance metrics are critical to understanding what is happening on your users’ devices during these busy times. Vitals like frozen and slow frames or cold and warm starts when an app opens provide visibility into how fast views are loading for your users. As became obvious with the Taylor Swift incident, a slow shopping experience can lead to an outcry and a lot of upset customers.

    Outside of vitals related to mobile performance, it’s important to monitor mobile changes through application release health. Developers can see this in the rate of crash-free sessions and crash-free users as traffic to an application increases—which helps to identify abnormalities in the overall health of the app.

    Slow Database and HTTP Ops

    During sustained traffic spikes, database queries and HTTP requests that take too long to execute harm the user experience. Hitting a slow checkout process, or seeing the dreaded spinning beach ball after adding a product to the cart, confuses shoppers. They don’t know if they should refresh the page, and often they will abandon a purchase completely.

    What’s more, if a developer is working on a backend framework, slow database and HTTP ops could also be a sign of an N+1 query problem. At that point, an application is making database queries in a loop and causing performance issues for the purchaser.

    User Misery

    This is a homegrown metric we use at Sentry; tracking user misery helps developers understand a customer’s experience with an application. It is a ratio of unique users who have experienced load times at 4x a configured threshold in a Sentry project and thus serves as a proxy for customer frustration. With this user misery score, our developers can see which transactions have the highest negative impact on users and prioritize fixing them.

    Providing a smooth end-user experience is table stakes for businesses throughout the year, but especially during high-pressure, culturally-driven spending moments. In any of these scenarios, developers behind the scenes often work long and odd hours to address performance issues and ensure the most seamless experience. You can’t prepare for everything that can possibly go wrong, but you can be equipped with the right tools and metrics to quickly identify and remediate any problems that occur.

  • Get Comfortable with Shifting Right to Improve Resiliency

    Get Comfortable with Shifting Right to Improve Resiliency

    The operations team receives a page at 2:00 a.m. Something isn’t working correctly. Do they know how to fix it? Perhaps more importantly, do they know whether it matters to customers or how it impacts the business? There are different techniques that companies implement to maximize the quality of their software. We talk about shifting left or right, chaos engineering and others. While they each have their own goals to improve quality, there’s an underlying common goal as well: All three techniques increase your team’s knowledge of the system and their ability to resolve problems quickly.

    Here, we’ll walk through the software life cycle and discuss the common challenges to software quality, running complex systems and managing dependencies between teams. The common thread is a proper observability strategy which can help software quality, hand-offs between different teams and resolve problems quickly by ensuring whole-system resiliency from design to maintenance.

    Techniques for Improving Quality

    Shift left is a concept that has attracted much attention recently. The practice revolves around the idea that detecting and correcting problems sooner minimizes their impact. As the thinking goes, they’re easier to fix, they wind up costing less and there are fewer ongoing issues with bad code.

    The rise of DevOps and DevSecOps has propelled the popularity of shift left. Yet, there’s a fact that development teams often miss: no matter how early an organization spots errors, problems will inevitably remain. Early testing can’t catch everything. As a result, some organizations have begun to rebel and move to a shift-right framework. It normalizes errors and aims to better resolve issues across the development process, including post-production.

    Shift right is the perhaps less-extreme cousin to its rebellious relative, chaos engineering. With chaos engineering, team members cause problems on purpose to keep everyone on their toes and test the limits of the system. They shut down servers, disconnect wires, delete files, etc. The goal is to confirm system resilience–from a user perspective, there should be no impact even with all of this chaos. A resilient system means that teams can fix failed components at their leisure during the day. With a resilient system, critical failures are less likely to happen and it becomes second nature to fix them when the dreaded 2:00 a.m. page does occur. Unlike chaos engineering, shift right doesn’t explicitly break things–it just makes the assumption that broken things will exist so teams need to be ready to handle them.

    Both concepts (and yes, even chaos engineering) are valid—but each company needs to carefully analyze which is right for them. One variable to consider is the complexity of the system you’re building. Working on a rocket launch or a surgery robot? Probably should shift left as much as possible. Changing the color of a button? Maybe it’s not the end of the world to verify the fix in production. For most of us, projects fall somewhere between these two extremes–so sometimes shifting left is necessary, and other times shifting right is pragmatic. A careful analysis of the risks should be performed to determine what kind of testing is needed.

    Although teams tend to be pretty good at analyzing the complexity of their software and making development process decisions, they often forget the complexity of other companies’ code which they depend on. Even a simple web application deployed today has tons of dependencies: The server it’s running on, the local ISPs, transit ISPs, load balancer, DNS provider, TLS certificate, CDN and browser, just to name a few! After analyzing the complexities of all of the dependencies across the internet, it becomes clear that finding every possible issue that might impact their application is a daunting task.

    The goal, again, is to find any issues before they reach production. Or if they reach production, fix them before they impact customers. Or if they impact customers, fix them as soon as possible after that. To do any of these things quickly, the level of observability of the overall system is paramount. With simple systems—or even complex systems that are entirely under one company’s control—tools such as application performance monitoring (APM) are common. But when the scope of the system is as big as the internet, internet performance monitoring (IPM) tools are necessary instead.

    With both APM and IPM tools, the goal is to know as much about the system as possible – enabling teams to identify problems quickly, pinpoint the root cause, and fix it. When an organization is equipped to monitor development and operational processes effectively from application to delivery, there’s a shift toward higher quality code, fewer errors, improved security and lower costs for the enterprise. There are also fewer disruptions and distractions for engineers, DevOps teams and others.

    Dealing With Disconnects

    Whether shift left or shift right is used, there will be problems that enter production. There is an invisible wall in many organizations–where engineering teams “throw code over the wall” to the team which is now responsible for running it. In some companies, this is the operations team; in others, it’s site reliability engineering or production engineering–the common trend is that in most companies, it’s not the same team who created the software.

    These operations teams often lack the nuanced information they need to resolve production issues. They might spend hours or even days attempting to track down the source of the problem. There’s often finger-pointing between different teams who created or own different portions of the system. Things can quickly devolve into chaos—and tempers can fray. After all, these kinds of problems always happen at 2:00 a.m., right?

    That’s where end-to-end observability enters the picture. Imagine a framework with proof that the development team has performed sufficient knowledge transfer to the operations team. That the operations team has asked all of the relevant questions about running and maintaining the application. Using the right tools, engineering and operations teams need to monitor every aspect and every component of the system. Creating this monitoring strategy means that everyone involved also builds an understanding of the system–everyone is on the same page. All of a sudden, there is a common language to discuss problems, and teams operating the software in production can take debugging a lot further before they need to ask for help.

    Ultimately, shifting left or shifting right is a personal choice for every organization. Even if every possible test case is executed before deployment to production though, issues will happen–so take the opportunity to implement a robust system-level monitoring strategy that can be used to solve technical questions during that 2:00 a.m. call.

  • IBM Automation Insights: Improving Observability and App Performance

    IBM Automation Insights: Improving Observability and App Performance

    Observability offers deep visibility into the internal state of complex systems in order to quickly identify and troubleshoot performance issues to keep up with customer expectations and business requirements. Observability enables better application performance monitoring (APM). So, how can DevOps teams gain full observability into modern applications? 

    On Feb. 23, experts from IBM and GitLab will come together at the IBM Automation Insights virtual event to discuss how to effectively observe, manage and maintain applications across platforms and how to improve application performance.

    The virtual event has been curated to create interactive sessions, led by DevOps experts who will deep dive on the latest innovations, conduct demos and share approaches that tackle challenges.

    IBM Automation Insights features a speaker lineup of distinguished engineers, IT leaders and executives, including:

    • Cosmo Schillaci, DevOps business leader at IBM
    • Jennifer Velasquez, Americas DevOps leader at IBM
    • Laurel Dickson-Bull, product manager at IBM
    • Kurt Dusek, senior solutions architect at GitLab
    • Jamie Coleman, software engineer at IBM

    Attendees will learn how Instana and GitLab can enable DevOps teams to accelerate CI/CD pipelines and how to build applications easily using cloud-native Java applications and microservices locally, with containers, and for OpenShift/Kubernetes.

    There will be a cross-platform panel discussion in which attendees will get a chance to interact with the speakers, ask questions on any of the strategies presented and discuss several topics, including cybersecurity, optimization for observability, vulnerability tool proliferation and more.

    For more information and to register, please visit the IBM Automation Insights website.

  • 4 Ways to Simplify Cloud Performance Monitoring

    4 Ways to Simplify Cloud Performance Monitoring

    Over the past 18 months, technologists across the globe have played a crucial role in the survival of brands and organizations via digital strategies. Across all industries, their skill and dedication have enabled businesses to rapidly launch innovative new digital services to meet huge fluctuations in customer needs and allow entire workforces to operate from home during the pandemic.

    This hasn’t been easy, even as end users’ expectations for seamless digital experiences are on the rise. In fact, the recent 2021 App Attention Index reaffirmed found 76% of consumers’ expectations of digital services have increased in the last year. And an overwhelming 85% noted that applications and digital services have become a critical part of their daily lives. This has placed even greater pressure on the technologists who are responsible for keeping applications and cloud experiences running smoothly.

    Often IT teams are challenged with monitoring companies’ digital services, but they lack the visibility they need to monitor health and performance across an increasingly sprawling IT estate, exacerbated by a seismic shift toward cloud architectures over the last 18 months. IT departments don’t yet have the right tools and data to optimize health and performance in their cloud environments.

    As a result, technologists are constantly addressing the same issues because they can’t easily isolate and identify them, and don’t know where to prioritize their actions. Hiccups can lead to brands losing customers—the same report revealed that over half of consumers indicated that brands have one shot to impress them, and that if their digital service does not perform, they won’t use them again.

    After a year and a half since the start of the pandemic and with adoption of cloud technologies set to accelerate even further over the next few years, it’s time for technologists to get ahead. Here are four things technologists can do to take the stress out of managing performance across the cloud.

    Implement Visibility from the Ground Up

    Having visibility into applications and the underlying cloud infrastructures that support them can be challenging without the right tools, which has contributed to some of the pressure technologists are experiencing. Traditional monitoring has allowed technologists to identify and catch issues in certain areas of an IT stack, but this approach is of little use in dynamic, distributed and software-defined environments where organizations are continually scaling their use of IT and the cloud up and down.

    As a result, the performance of the digital services can be impacted, potentially hurting end-user experience and eroding trust in the brand.

    To keep up with the rising demands from consumers in the digital world, technologists need the ability to monitor the full IT estate, from cloud infrastructures to customer-facing applications through to core infrastructure such as compute, storage and network; including the open web and security. With access to tools like observability platforms, technologists can lessen the burden of individually monitoring the performance of each item supporting the digital service. Instead, they can achieve one holistic view into alerting, root cause and analysis of correlated metrics, events, logging and tracing (MELT) data from the cloud to enable early and easy troubleshooting.

    Consider tools that link infrastructure (compute, storage and network) with the services and applications they execute. When there is an application-level issue, it is easy to take a closer look and identify problematic areas in what makes the application run or the application itself.

    Align IT Performance to Business Results

    After aggregating a full-stack view of applications and the cloud infrastructure behind them, technologists can then link performance data identified by the observability platform with real-time business metrics.

    Linking the two provides technologists with the ability to identify where and how the digital services are impacting the business and end-users. Full-stack observability automatically provides technologists with these linked insights, enabling them to address the areas that matter most.

    Educate Teams

    In addition to having the right tools to help take advantage of the cloud, it is important that an IT team is well-versed in the technology itself. Managing the performance of the cloud is complicated and there is a finite pool of talent available to businesses. Therefore, business leaders should provide appropriate resources to ensure teams are educated and equipped to succeed.

    To support a seamless implementation of cloud infrastructure to support a business’ digital services, business leaders must invest in upskilling their teams or recruit others who are knowledgeable about cloud monitoring.

    This will ease the pressure on existing teams and give technologists the skills and confidence to progress in their careers.

    Leverage Automation

    Even with the best observability solutions in place and teams equipped with the necessary skills, there is still concern that there will be an overwhelming amount of data generated by accelerated digital transformation over the coming years, especially those involved in large-scale public cloud environments. It can become a challenge for technologists to dedicate the level of resources and skills required to manage and optimize performance across the IT estate.

    To avoid these potential circumstances in the future, it’s worth considering how to minimize the impact of a data deluge by reducing an IT department’s reliance on manual interventions to monitor health and performance and resolve issues.

    Two things that will play an increasingly vital role in tracking health and performance across the entire IT estate are automation and AI. This is particularly the case in large-scale public cloud environments, which are fast becoming the biggest headache for some IT teams.

    With AI deployment to identify and fix issues in real-time, technologists can spend less time firefighting thanks to the AI/ML guiding hand. This will lead to increased job satisfaction and fulfillment and a better work-life balance.

  • ServiceNow Acquires Lightstep to Gain Observability Platform

    ServiceNow Acquires Lightstep to Gain Observability Platform

    ServiceNow today announced it has acquired Lightstep as part of an effort to add an observability platform to its IT operations portfolio. Terms of the deal, expected to close this quarter, were not disclosed.

    The Change Intelligence observability platform from Lightstep is based on a time-series database that is capable of processing a trillion events each day. It was built by the same team that created Monarch, the globally distributed in-memory time series database system that Google employs to monitor its applications and systems. Lightstep team members also co-created both the OpenTracing and OpenTelemetry open source projects for collecting traces, metrics and logs.

    Pablo Stern, senior vice president and general manager for IT workflow products at ServiceNow, said ServiceNow will employ Lightstep to enable IT organizations to observe both monolithic and microservices-based applications as IT operations and DevOps teams continue to collaborate more closely with one another. The goal is to provide a single pane of glass through which IT teams can observe their entire IT environment via the Now platform that ServiceNow makes available via a software-as-service (SaaS) delivery model.

    That approach will enable DevOps teams to programmatically manage IT environments alongside IT administrators employing graphical tools, noted Stern.

    Lightstep CEO Ben Sigelman added that, in time, the number of users of that observability will only increase as more application stakeholders start to track software development projects that are at the heart of various digital business transformation initiatives.

    ServiceNow

    Thanks mainly to the rise of microservices that are now being deployed across highly distributed computing environments, it’s become more difficult to discover the root cause of an IT issue. Microservices-based applications have lots of dependencies that, while serving to make the overall application more resilient, conspire to make it difficult to determine which specific microservices might be adversely impacting the performance of an application.

    The time-series database that lies underneath the Change Intelligence observability platform makes it feasible to go beyond logs and metrics to process distributed traces that provide more insight into application behavior. Ultimately, the goal is to enable organizations to innovate faster with a higher degree of confidence in the IT environment, said Sigelman.

    As far as the march to observability in the enterprise is concerned, it’s still early days. While observability may be a core tenet of any DevOps practice, most IT organizations rely on myriad tools that surface data the teams then attempt to correlate. Whenever there is a major issue, those IT teams typically convene in a “war room” to compare reports generated by the various IT monitoring tools employed. Observability platforms that collect and process distributed traces used to instrument an application using a consistent set of specifications, frameworks and libraries. The OpenTracing and OpenTelemetry tools are significant because they provide an open source approach to instrumenting applications that reduces the total cost of observability. In comparison, many legacy application performance management (APM) platforms employ proprietary agents to instrument applications.

    Naturally, each IT organizations will be moving down the path toward an observability platform that provides greater application context. At this point, however, it’s not clear to what degree observability platforms will need to be installed before making the transition to microservices versus being a capability that only gets appreciated once the trouble with microservices finally becomes apparent.

  • Instana Makes Maintaining App Service Levels Easier

    Instana Makes Maintaining App Service Levels Easier

    Instana announced today it has made it easier for DevOps teams to achieve and maintain service level objectives (SLOs) for applications when employing its application performance management (APM) platform.

    Announced at the DevOps World 2020 conference hosted by CloudBees, the Instana tools provided to configure, monitor and manage SLOs are based on a series of wizards that DevOps teams can employ to create a dashboard through which they can monitor all the components that make up a specific application service. An Application Perspectives creation wizard guides IT teams through a process to select filters that eliminate uncorrelated, unconnected systems from the application service they need to monitor.

    Chris Farrell, technical director and APM strategist for Instana, said as IT environments have become more complex thanks to the rise of microservices, IT organizations need access to APM platforms designed from the ground up to monitor, tune and optimize applications that are dependent on services strewn across an extended enterprise. Instana automatically deploys sensors to each part of the application stack, traces all application requests and profiles every process without requiring IT staff to configure those agents or restart applications. Any changes to the application environment are also automatically reflected in the model of the IT environment Instana creates.

    Instana is now extending its APM platform to make it easier for IT teams to meet service level guarantees regardless of application complexity, said Farrell.

    Given all the dependencies that exist between microservices, some type of observability platform is now a fundamental requirement. Previously, IT teams tended to only employ APM platforms to monitor their most critical monolithic applications because of the costs involved. In contrast, just about every application based on microservices needs to be instrumented to enable DevOps teams to optimize performance. Microservices-based applications are designed to degrade application performance gracefully by rerouting application traffic anytime there is an availability issue. While that approach prevents applications from crashing, it also makes discovering the root cause of an application issue that much more challenging for DevOps teams.

    It’s not clear to what degree organizations that have standardized on an existing APM platform might be willing to replace those platforms as the number of microservices-based applications deployed in enterprise IT environments increases steadily. However, there are many more IT organizations that are just now starting to employ an APM platform to enable them to better cope with these applications. Most are also embracing best DevOps practices that make observability a core tenet for continuously deploying and updating applications.

    As those DevOps practices continue to evolve, most IT organizations will transition toward monitoring application services that drive a business process rather than isolated instances of monolithic applications.

    Regardless of the APM platform selected, it’s clear the way applications are deployed and managed is fundamentally being transformed. The issue now is determining how best to visualize those application environments because, after all, no one can manage what they can’t actually see.

  • SolarWinds Extends APM Reach to Infrastructure

    SolarWinds Extends APM Reach to Infrastructure

    SolarWinds has updated its application performance management (APM) platform to provide more visibility into the IT infrastructure on which applications depend.

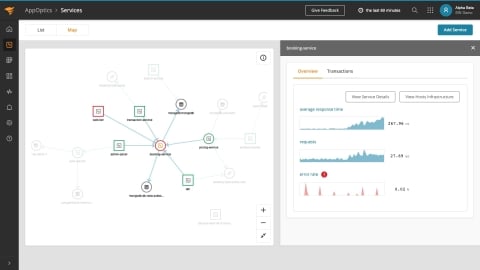
    Jim Hansen, vice president of products for application management at SolarWinds, said the AppOptics service map within SolarWinds APM Suite now enables DevOps teams to visualize dynamic relationships between services and their dependencies. IT teams can view metrics such as average latency, requests per minute, error rate and CPU usage as time series data within a service trace topology.

    DevOps teams can view which services and dependencies are causing resource constraints, surface unknown dependencies and misconfigurations in services and determine how business transactions are flowing across application services, said Hansen. The goal is to make it easier to conduct root cause analysis at a time when the dependencies between software and infrastructure have never been greater or complex.

    Hansen noted that in the wake of the economic downturn brought on by the COVID-19 pandemic there is a lot more interest in reducing the total cost of IT. In many cases, IT teams today are relying on separate tools to monitor applications and IT infrastructure, which often not only results in higher costs but also fails to provide enough context, he said.

    At the same time, responsibilities within IT teams are converging. According to a recent survey of 227 IT professionals in North America conducted by SolarWinds, 54% of respondents said they are spending more time managing applications and services than infrastructure and hardware. The survey also notes there are more IT teams than ever using log analytics (58%) and tracing (24%).

    SolarWinds has also added a web transaction recorder to its Pingdom monitoring tool to capture how an end user interacts with a web application without requiring developers to write and deploy scripts. The recorder captures each step made during a transaction and automatically translates the information into a script that can automatically play back, said Hansen.

    Finally. SolarWinds has enhanced its Loggly tool, adding the ability to automate indexing and parsing to deliver time to value faster, he said.

    Hansen said SolarWinds via its software-as-a-service (SaaS) platform, is trying to make APM simultaneously more affordable and accessible. The challenge is making it possible for IT teams to apply APM services more broadly even when consumption of those services scales up and down in ways that are not always predictable, noted Hansen.

    There are no shortages of options when it comes to APM platforms these days, and most are accessed via SaaS platforms. SolarWinds has been making the case for an APM service that costs substantially less than rivals while providing most of the functionality required by the average IT team. Many teams have limited their adoption of APM platforms to only their most mission-critical because of the cost involved. As APM services become more affordable, there should be a corresponding increase in reliance on APM services at a time when IT is becoming more complex to manage daily.

  • 5 Business Insights to Gain From APM

    5 Business Insights to Gain From APM

    My son is a commercial on-demand cargo pilot, and it’s his job to move around auto parts when they’re needed in the supply chain. During a recent auto strike, he ended up flying a few fenders to a factory for something around $20,000. The profit margin on those fenders was blown to bits, but it would have been far more expensive to interrupt the supply chain — auto assembly lines burn millions per hour.

    That kind of individual, transactional economics is insane, of course — no actual fender really costs so much. My point is inefficiencies occur when there’s a hiccup somewhere. They can happen at any point — including when the custom applications that work with suppliers aren’t functioning correctly. The result? The item isn’t ordered, or delivered, on time. And there’s a substantial financial impact downstream.

    That’s why slow is the new down. The stakes are high. Here’s five reasons why you need a comprehensive performance management strategy to track and measure all digital touchpoints in your business and mitigate the impact to both your business and the user.

    Timing Is Everything

    Not too long ago, business ran on an analog model. Customers went to the retailer or contacted them in some way and placed an order. It was the same in B2B interactions; parts were ordered and, once in stock, they were delivered.

    The old system worked fine, but compared with the way things are today, that analog model was inefficient. It required more warehousing. Delivery took more time. Overhead was higher. Nothing was “Just in time.” You could call it, “Just you wait.”

    Now we’re interconnected, often by custom apps and websites (custom, because each company is different, with different needs that can’t be fulfilled by some “one-size-fits-all” app or site). It works well when it’s working well. But when there’s even a blip, there’s disaster. 

    Our modern, digitally interconnected system is kept running smoothly by monitoring. Everything about the app and the site is monitored and measured, to a microscopic degree. How is the mobile app performing? How long did the customer stay on a page? How quickly did the B2B app answer a parts order? You can find that out — and fix the problem before it grows.

    This is called application performance monitoring (APM). The digital world is full of acronyms, but “APM” is a vital one to know because measurement is now table stakes for any digital business, whether it’s retail, financial or B2B.

    Customers Are Fast to Leave When You Are Slow

    For execs, it’s job number one to protect and increase market share. Salesforce said 52% of holiday shopping occurs on a mobile device. Last year, Google changed its algorithm to make site speed a ranking factor in mobile search. In short: Go slow, and you won’t get found. You won’t make the sale. You lose market share.

    If your customers do manage to find you: A recent study found 95% of consumers in the U.S. and U.K. will jump off an e-commerce or brand site if they’re having a frustrating time. Therefore, you need to know where and when they jump. You can find out with APM.

    If your customers are loyal, 60% will still leave you to find that product somewhere else. Customers will simply leave any digital touchpoint that doesn’t keep up. How fast is slow? Google said a mobile site should load within three seconds. Take longer than five seconds, and the probability of bounce increases by 90%.

    Customers are fast to leave when you are slow. APM gives you continuous visibility into how your application is performing and helps answer the lingering question, “Is my app good?”

    Faster Isn’t Necessarily Better

    When cloud first debuted, business leaders loved it. They were able to disconnect from messy interactions with on-premises equipment and the tech pros who maintained it. It was elastic, scalable and agile; they could expediently deploy more resources if something slowed down in the cloud.

    At least that was the plan, but the trouble is it didn’t automatically guarantee a better customer experience. It also didn’t make those auto parts arrive on time. Don’t get me wrong, Cargo Dogs love it when you urgently need them to deliver parts. But flying fenders around at the last minute is not a sign things are going well at the part vendor or at the plant.

    You still need proactive visibility. With continuous monitoring, you can understand the performance of the application and the infrastructure it runs on.

    You can stop reacting and start delivering. APM tells you where you’re getting value and where you aren’t. It knows when you’re spending too much on a feature and not getting much ROI. The secret isn’t spending more money than the other guys. It’s spending it more wisely than they do.

    I’m not going to claim APM is a digital shaman. But it does give you a perspective of the cost of running your applications and the performance of running those applications — and it does this proactively.

    An example: Earlier in my career, I worked with a business leader who had the application business for a large financial services company. This leader was tasked with ensuring digital interactions were operating in a high-performance fashion. Before he implemented APM tools, he ran with the most expensive systems and infrastructure — both on-premises and in the cloud — on the presumption that massively over-provisioning infrastructure was the safe thing to do.

    But users complained his pricey infrastructure was slow or unavailable. His IT staff would look at all their technology metrics — not in the context of application performance, just pure technology metrics — and say nothing was wrong; the infrastructure itself was performing flawlessly. Finally, he brought in APM and instrumented it on a key application and immediately got proactive visibility. He was able to fix the problems with his applications — without buying still more infrastructure.

    The Importance of Visibility

    Visibility means fewer problems that lead to slowness or outages. But if you do have interruptions, end-to-end visibility shows you the linkage between the application and the infrastructure. Your technology teams can rapidly do root-cause analysis and fix the problem much faster because they’re no longer guessing at where the issues might be.

    It means IT isn’t wasting time pointing fingers. It is working off a consistent and standard set of information. Additionally, for traditional IT organizations, APM gives next-level visibility into infrastructure, whether it’s on-premises, cloud, hybrid, etc. It gives stakeholders a view into the metrics that matter.

    The Right Metrics — Even During App Development 

    There are many reasons why applications can’t perform well. They could have other applications contending for resources. And here’s something else: that custom application could be poorly written.

    APM is a great help in the development stage of applications because it allows people writing the applications to understand how their application code is performing immediately. That way, they can optimize their code before it goes live.

    That app can be written in any number of languages, and it might be public cloud, hybrid cloud, or private, on-premises. APM instruments these apps and allows you to see right down to the line of code how those apps are performing. The likelihood of deploying poorly performing code into production thus minimized greatly.

    Conclusion

    APM allows companies to roll out better performing applications more quickly with a high degree of assurance that they’re not going to be slow in production. Without APM, you have an unknown level of risk associated with availability and performance of your applications, their transactions and your infrastructure. If you’re not monitoring it and measuring it, you can’t manage it in a low-risk fashion — which is ultimately why APM matters and should be adopted as broadly as possible across your application and infrastructure environment.

  • Continuous Security Through Developer Empowerment

    Continuous Security Through Developer Empowerment

    Every organization is embracing DevOps to one degree or another. The business impact of shipping software quickly and adapting to market needs is so immense that it has become a requirement—you’re either heading toward DevOps or heading toward bankruptcy. Yet, while our need for speed has increased, so has our need for security—and combining both is far from an easy task.

    The key to achieve the DevOps velocity is developer autonomy. Developers and their surrounding application teams need to make daily decisions about what to build and how to build it, and they need to do them on their own. Bottlenecks appear when teams are required to get external approval, slowing down the process and eliminating the dev team’s sense of ownership. The resulting effects are subpar outcomes in applications and attrition of top performing developers. 

    Yet, security practices, unfortunately, often depend on such reviews. Security audits and reviews are the bread and butter of most security organizations, requiring experts to determine if a decision is secure or not. For security to work at the speed of development, this practice has to change and give developers the power to make security decisions. The only alternative is insecure software and deceleration of software version development.

    How can we achieve such developer empowerment for continuous secure software development? Let’s review some key practices, and look at ops practices for inspiration. 

    Mindset Shift: From Super-Hero Operators to Multiplier Engineers

    Site reliability engineering (SRE) teams hold the same responsibility for a service’s uptime as the sysadmins that preceded them. The change in the role came from how they achieved this resilience. SREs don’t handle most incidents, nor do they review all code that affects reliability. Instead, they engineer the tools to empower developers to handle oncall and build operable software the right way. An SRE should only be pulled in for the extreme cases, be it an incident or architecture review. 

    Security teams must operate in the same manner. Their job must be tactical, working to reduce their involvement in the process and giving more responsibility to the developers. Cases will arise where their expertise is needed, but general inquiries should be kept to a minimum. 

    Tooling Change: From Security Tools to Developer Tools

    Before DevOps kicked in, app performance monitoring (APM) was owned by IT, who used synthetic measurements from many points around the world to assess and monitor how performant an application was. These solutions were powerful, but their developer experience was horrible. They were expensive, which limited tests developers could run. They excelled in explaining the state through aggregating tests, but offered little value to a developer trying to troubleshoot a performance problem. As a result, developers rarely used them. 

    Then, New Relic came on the scene, introducing a different approach to APM. Their tools were free or cheap to start with, making it accessible to all dev teams. They used instrumentation to offer rich results in developer terms (call stacks, lines of code), making them better for fixing problems. This new approach revolutionized the APM industry, embedded performance monitoring into dev practices and made the web faster.

    The same needs to happen for application security. If developers are the ones making impactful security decisions, then the most important users of security tools are no longer security folks—but rather developers themselves. Security tools should therefore focus on achieving developer adoption first and foremost, even when it comes at the expense of more effort by the security person involved. 

    Governance Change: From Blocking to Monitoring

    One of my favourite DevOps adages is, “If it moves, measure it. If it doesn’t move, measure it in case it moves”. It embodies just how critical it is to successfully monitor your running application. While CI/CD pipelines help you get software to production, monitoring gives you the confidence to do it at speed. You don’t need to worry so much about shipping a bug when you’re confident you’ll find out about it quickly and revert or roll out a solution.

    Security needs to embrace this approach. Finding out a security vulnerability has just been deployed and acting on it is almost as good as blocking it just before it was deployed—and far less disruptive. But to embrace this, you’ll need to invest in monitoring. 

    Developers are the first step in the application process. It makes sense that they are also the engineers of security solutions. Empowering developers to make security-first decisions allows IT teams and security professionals to address different parts of the business, saves time in the development process and ultimately creates stronger applications and outcomes. 

  • Overcoming Hybrid and Multi-Cloud Management Challenges with APM

    Overcoming Hybrid and Multi-Cloud Management Challenges with APM

    When companies move toward hybrid and multi-cloud, both leadership and IT can struggle to adapt their organizational structures and processes to a new, more complex way of doing things.

    With the classic form of DevOps, for example, operational monitoring and management procedures are radically new and different: from a management perspective, it almost appears as a free-for-all, making assessment and accountability to the business difficult to achieve on a regular, ongoing basis.

    The older system was straightforward: on-premises monitoring and management teams were organized around a technology stack, with associated monitoring and management tooling. The network, server and storage teams each had distinct processes. Different problems were escalated and triaged (Level One, Level Two, Level Three). It was formulaic—perhaps even annoying to some tech pros—but it worked.

    DevOps is different. Applications are changed, tested and deployed in production continuously, often on an hourly basis (or more frequently). It’s revolutionary because it delivers maximum business market agility, embraces technical and business evolution, and is never-ending. It radically redefines the concepts and approaches we associate with application and infrastructure support and triage processes.

    But there’s good news: Application performance solutions and workarounds are coalescing. Here’s a few ways we’re seeing teams evolve to overcome the challenge of hybrid and multi-cloud application and infrastructure management.

    Try a Monitoring Engineer

    Right now, we’re all experimenting—we’re in a digital Wild West. In that spirit, forward-looking outfits are working with the concept of a monitoring engineer (sometimes monitoring support), someone who owns the monitoring of everything important in the context of an application or a line of business.

    “Monitoring engineer” as a job title can mean many things. If you Google it you’ll find open positions for many kinds of these engineers. But for our purposes, it’s a stand-in for a new concept, a new way of thinking. To be clear, this isn’t a network monitoring engineer, or any other kind of job with the title of engineer. It’s a new way to better and more proactively align IT with the business goals of the company paying the bills.

    Traditionally, metrics have been aligned to the application or applications being built out—not the business itself. More importantly, these metrics aligned around answering questions like, “Is this specific element of infrastructure or application available and performing?” Especially at the infrastructure level, performance was defined typically as a technology resource utilization metric (i.e., how efficiently are technology resources being consumed). This new concept of monitoring engineer is designed to allow management to quickly get the answers it needs in a consolidated and focused fashion—to move, in effect, from resource-centric monitoring to service and application-centric monitoring.

    Application performance monitoring (APM) has evolved thanks to measurement focused on application availability and performance rather than infrastructure. APM requires a certain amount of applications knowledge. The monitoring engineer needs to know enough about the application environment, how the application is configured and how it’s deployed operationally but doesn’t have to be the expert in the application code itself.

    Importantly, a successful monitoring engineer requires time and focus—and management needs to set up a structure to support it. Any competent system administrator or network engineer who’s worked in a complex private cloud or on-prem hybrid environment would have the skills to do this. But these engineers need time and the ability to focus on their job, while adding APM skills to their repertoire.

    Creating Metrics That Matter

    Along with the dedicated monitoring engineer who’s minding the technology store for management, processes and languages must be standardized.

    Think back to when virtualization swept the tech pro world, some 10 or 15 years ago. We had to change and adjust. We have to do it again.

    We should start by standardizing the application languages tech pros use. How we choose languages should always be business-driven: Different languages are good at different things, which should be the deciding factor. The number of languages should also be limited, so management can be more straightforward. Similarly, standardization should be the default wherever possible to approaches considered for automated deployment and dynamic configuration management of both applications and infrastructure resources.

    Keeping things as simple as possible doesn’t mean not learning new things, however. Management will need to cultivate a culture of curiosity. Tech pros must learn new ways of working—if they don’t, the transfer to hybrid and multi-cloud will be a guaranteed slog, or worse.

    If the tech pros stay curious, they’ll stay ahead. The APM market is growing at a considerable rate, and the people with the curiosity to get involved in it are the ones who will succeed.

    APM gives tech pros a powerful tool they can easily add to their skillset by which they can then generate the data and the metrics in the language of the business. When metrics are business focused, they matter.

    The measurements the business (and customers) care about are fundamentally limited to four key metrics, in two classes:

    • Application performance—how much business work is being accomplished over time, along with the response-time experience of users.
    • Availability management—whether all resources associated with the entire technology stack are continuously up and available to service the applications, along with any and all associated errors.

    Taking this approach to measurement is about meeting the company needs in business terms, not IT. This approach is critical for ensuring excellent customer experience or an ability to immediately and cost-effectively respond to peaks in business demand. This approach answers the questions: What are users experiencing? How are specific pages and transactions performing? APM can also discover what infrastructure components are needed to support those applications delivering successful service.

    Answers like these can’t be discovered with infrastructure monitoring alone, nor with infrastructure-centric monitoring of application performance that infers performance from technology resource utilization rates. Nor can they be answered with network monitoring or storage monitoring. Only APM provides the answers the business needs. It’s the glue to bind together the different silos.

    Measurement Matters Most on a Thin Margin

    We’re in a new environment. In many ways, it’s the Wild West and there are many ways to win and lose. Few things seem absolutely right, except this: Tech pros need to be completely aligned with the businesses they work for.

    In the past, a strategy such as APM was perhaps better aligned with industry verticals. Companies operating with thin business margins were reluctant to measure. Now, it’s the opposite. Companies such as those in the e-commerce, B2B, B to high volume and B2C spaces continue to operate on thin margins and are now in a virtuous spiral. Their success depends on efficiency—and efficiency is key to making them win in the increasingly competitive marketplace.

    To achieve this level of success, companies must measure and assess where they’ve been and where they’re going. They need to do more than just keep up with the competition, they need to accept innovative processes such as DevOps, while continuously measuring their progress.

    Ultimately, speaking in the language of business can take many IT professionals outside their comfort zones. But APM gives the wary tech pros a powerful tool for generating the kinds of data and metrics management needs. APM grounds the business, but also makes sense of the new hybrid and multi-cloud environment. It’s a chance for management and IT to bridge the gap between us and them. It’s the best way to manage the changes to come.