Tag: apm

  • Stackify APM+ brings real-time application performance management to .NET

    Stackify APM+ brings real-time application performance management to .NET

    It’s a fast-paced world. Recent research from Microsoft suggests that the attention span of the average human is about 8 seconds now. That means if your application doesn’t work as expected your users will quickly move on to find a suitable replacement. An application performance management tool can be crucial to identifying and resolving application issues as quickly as possible…while you still have the user’s attention.

    Stackify introduced APM+ to give .NET developers real-time application performance analysis. Stackify has already established itself as one of the leading vendors of application performance management. Its platform monitors important metrics like CPU, memory, and disk utilization on servers and alerts developers or admins when issues arise. Now it is extending that monitoring to Microsoft ASP.NET environments with APM+.

    “The level of real-time app performance and depth of APM+ analytics is unmatched in the market. Not only does Stackify give a complete 360-degree view of how a system is spending its time and where, but it also allows developers to quickly drill down to the heart of the code and see how it can be fixed or improved,” says Stackify CTO, Jason Taylor.

    Application performance management in general, and a tool like APM+ specifically, fit neatly with the principles of DevOps. As I noted in a previous article DevOps is “continuous” at virtually every level. There is no beginning or end—no point when an application is completed and deployed and you can kick back and relax. While finishing touches are being put on an app to prepare for a new release a laundry list of changes and updates is already being worked on to develop the next release. There’s no rest for the weary (developers).

    There will always be fixes and new features to work on for an app, but application performance management gives you insight into the changes that matter most. Knowing things like which app takes the longest time to load, or which app gets called the most often, or which app is failing the most gives developers a huge advantage that allows them to devote resources where they will have the most impact.

    According to a Stackify press release, “APM+ gives developers an increased understanding at every level of an application’s performance and offers code-level profile traces to provide unparalleled system visibility — including method calls, log statements, cache lookups, DB queries, and web service requests.”

    Why is that important? A couple reasons stand out. First, you want to be proactive about identifying and resolving issues with your apps. The old-fashioned method of waiting for users to report problems is too slow and reactionary. By that point you already have disgruntled users frustrated with your app.

    The second major reason is that a tool like APM+ gives you a streamlined ability to resolve the issue(s) plaguing the app. Rather than a user reporting a problem and developers poking and prodding to investigate what the underlying issue is, APM+ gives developers visibility into metrics and data that enable them to quickly find and fix the problem.

    APM+ is focused on the .NET framework initially but Stackify notes that it plans to offer support for a broader range of development languages later this year.

  • Performance Monitoring, another view

    Performance Monitoring, another view

    This is my first post to devopsy.kinsta.cloud, for those who haven’t read my other writings, I currently work as the VP of Market Development and Insights at AppDynamics. I joined in February 2015 after being at Gartner for 4 years as a Research VP covering all things monitoring. During my time as a Gartner analyst I would help buyers make decisions about purchasing monitoring software. When I read articles on the internet which blatantly disregard best practices I either smell that something is fishy (sponsorship) or they just didn’t follow a process. Conversely some people do follow a proper process. I specifically wrote this up due to reading a really fishy article.

    Step 1 – Admit it

    The first step to determining you have a problem is admitting it. Most monitoring tool buyers realize they have too many tools, and none of them help isolate root cause. This is a result of most buying happening at the infrastructure layer, when the application layer is either lightly exercised synthetically or disregarded. People soon realize you must find an application layer monitoring tool, or write your own instrumentation. The vendors who sell logging software would love for you to generate a lot of rich logs, so they can help you solve problems, but realistically this doesn’t work in most enterprises as they are using a combination of custom and packaged software, and forcing developers to write consistent logging is a frustrating and futile task.

    Step 2 – Document it

    The next phase is to document what you are using today, most organizations have over 10 monitoring tools, and they typically want to buy another one. As they consider APM tools they should document what they have today, and determine a plan to consolidate and eliminate redundant tools. Having tools within silos will happen until you can fix the organizational structure.

    Step 3 – Requirements

    I can’t tell you how many times vendors set requirements for buyers. You can tell when vendors do this versus actually understanding the requirements the user has, and if the solution will scale and be operable by the team. Purchasing a tool which requires full time consultants on staff to keep it running is no longer feasible today, sorry to the old big ITOM vendors (formerly the big-4) but people don’t want that anymore.

    Step 4 – Test it!

    If you are evaluating software you MUST test it, and make sure it works in your environment. Better yet load test the software to determine if the vendors claims of overhead and visibility are in fact true. I see far too many people buy software they do not test.

    Getting back to the article which prompted this post:

    https://devopsy.kinsta.cloud/features/devops-style-performance-monitoring-for-net/

    The author is located in Austria and I believe there is a connection to Dynatrace. Dynatraces’ R&D and technical leadership are in Austria, but this is just conjecture. The article is written with a bias, which is obvious to any reader who has used these tools. The evaluator did not test these products, or if he did he didn’t have a testing methodology.

    Finally the author’s employer is new and all employees have come from Automic Software in the past year. I don’t need to explain to those who work with Automic the state of things there. http://www.glassdoor.com/Reviews/Automic-Software-Reviews-E269431.htm#

    I think I’ve spent enough time on the background, here are my specific issues with the content.

    The screenshots are taken from various websites, and are not current or accurate. If someone writes an evaluation of technology, at least test it, and use your screenshots from the testing!

    This post was specifically to discuss DevOps, but yet the author doesn’t discuss the need to monitor microservices or asynchronous application patterns, which are clearly the current architecture of choice. This is especially the case in DevOps or continuous release environments. In fact Microsoft themselves announced new products last week at Ignite including nano server, and Azure Fabric Service for building these patterns. The difficulty with microservices is that each request externally spawns a large number of internal requests, these often start and stop out of order creating issues when monitoring these. This causes major issues for APM products, and very few handle this effectively today.

    The article calls out user interface and deployment models inconsistently, and fails to mention Dynatrace is an on-premises software product. Dynatrace is also a thick Java client, built on Eclipse. This is the definition of a heavy client, which the author calls out for other products in this article.

    Continuing the incorrect facts in this article the author calls out Dell (formerly Quest) Foglight. This is not Dell’s current product for modern architectures. Dell has moved to a SaaS product called Foglight APM SaaS, which is not what was evaluated. The evaluator should look at the current product (noticing a trend here).

    Finally the AppDynamics review is inaccurate:

    Editors note: the following is this authors opinions, not the opinions of devopsy.kinsta.cloud.  As the author states, he is employed by AppDynamics.

    “code level visibility may be limited here to reduce overhead.”

    The default in order to scale AppDynamics to monitor thousands of systems with one single on premises controller (something no other APM vendor delivers) is done based on advanced smart instrumentation, but every transaction is monitored and measured. All products do  limit the amount of data they request in some way. AppDynamics has several modes including one which captures full call traces for every execution.

    “ lack of IIS request visibility”

    AppDynamics provides excellent visibility to IIS requests, I’m not sure what the author means here. AppDynamics also supports implementation on Azure using nuget.

    “features walk clock time with no CPU breakdown”

    Once again, I’m not sure what the author is referring to here. The product provides several ways of viewing CPU usage.

    “Its flash-based web UI and rather cumbersome agent configuration”

    The agent installation is no different than other products, showing the author has not installed the product. Finally the product is HTML5, and has been for a while, there are still some flash views in configuration screens, but those are being removed with each release. I’d much rather have a web based UI with a little remaining flash than a fat client UI requiring a large download.

    AppDynamics has a single UI which goes far deeper into database performance than the other products in this review. AppDynamics also provides far more capabilities than what was highlighted in this article including synthetic. AppDynamics provides deployment of the same software via SaaS or on premises installation.

    Finally this review did not look at analytics, which is clearly an area of increasing demand within APM. That being said this review is far from factual or useful.

    Hopefully this sets some of this straight, please leave comments here, or @jkowall on twitter!

    Thanks.

  • Can your DevOps and APM Initiatives Increase Customer Loyalty?

    Can your DevOps and APM Initiatives Increase Customer Loyalty?

    I’ve reached a point where I can rate most services based on the quality of my digital interactions. So much so in fact, that any human interjection into my daily digital consciousness has become, well, almost quirky.

    It was with some surprise that after a prolonged period of digital engagement with my bank, I received a call from a customer service representative. After the initial shock, I was brought back to earth by a pretty standard question:

    Based on the service you’ve received recently, how likely is it that you would recommend our company to a friend or colleague? Please rate on a scale of 0 to 10.

    Now with a background in marketing, I understand what’s in play here. It’s an attempt to build what’s called a Net Promoter Score (NPS); a simple management tool to gauge the loyalty of consumers. If I respond with a 9 or 10 I’m considered enthusiastic – a promoter. On the other hand if I think the service sucks and score 0 to 6, then I’m a detractor. The metric is calculated by subtracting the percentage of detractors from the percentage of promoters. Yep, management theory doesn’t have to be complex.

    NPS as an indicator of business performance is important because most leaders understand they’re competing primarily on the basis of the customer experience. And, since this experience is predominantly based on a journey of linked digital engagement, maintaining the quality of these interactions is vital.

    So what has all this to do with Application Performance Management (APM) and DevOps? Well, lots – let me explain.

    If we think about digital engagement, there’ll be many points across a customer journey (from app on-boarding to service renewal) that’ll help determine the overall experience and whether or not customers become promoters. I call these “magic moments”; points of interaction where businesses have an opportunity to deliver an experience that transcends beyond the purely transactional into a more powerful emotional connection. It’s vital therefore that these moments become the focal points for our APM strategies – only this requires some new thinking. Here’s my take:

    Monitor the Magic – IT teams must identify all the key magic moments (especially those that have the highest correlation to customer loyalty) and implement automated performance collection and measurement. Some of these may form part of a linked value chain (e.g. an airline flight experience = seat selection + mobile boarding pass + baggage collection + loyalty rewards), or be services designed to drive a recurring revenue model (e.g. free shipping / discount options), or even be delivered by partners through API’s. Whatever the model, APM must be capable of providing a unified end-user view into every contextual, situational or transactional interaction – mobile app and web-based – because it’s here that loyalty is determined and promoters are formed.

    Make Metrics Matter – when a prospect navigates to your application (perhaps via some promotional web-advertising) that’s great, but it’s not yet magic – that is until the visit converts into a sale. It’s at these points that we should be connecting our “listening” strategy (via APM) to the customer and determining effectiveness in a business context. This can be tricky because traditional (but still important) metrics like MTTR are introspective, whereas what’s really required are external customer-centric indicators. To address this, DevOps practitioners should consider applying newer APM analytical methods and instrumentation in order to learn the relationships between service elements (e.g. web site sign-on / authentication time, response times) and customer experience – using the intelligence gained to drive improvements where they’re most effective – yep, you guessed it – at those “magic moments”.

    Share the “Profits” – an advanced experience-based APM strategy must also include working with groups who can profit from rich information insights. From a DevOps perspective, this will involve development leveraging the data as the operational feedback needed to steer both functional and non-functional improvements – for example, mobile app usage and behavior analytics are critical early indicators of functional usability. But given the businesses reliance on digital services, many groups beyond IT will also profit. For example, if it’s reliably determined (and presented) that application performance is a key driver of Net Promoter (or any other business metric), which in turn is linked to improved financial outcomes, then this could serve as the basis upon which to prioritize future investment.

    Instrument Culture – aligning with metrics like NPS is valuable because it helps shape collaborative, customer-centric behaviors. However, this requires tools that can embed these behaviors into everyday operational practices. Improving customer experience is a shared goal, so APM processes must facilitate the feedback of intelligence between Dev and Ops, while also meeting the needs of every function (Developers, Application admins, Level 1 and 2 support etc.) within each group – especially in context of the role each plays in improving customer experience.

    As companies increasingly engage customers via digital channels it’s a given that IT will be measured on how it increases customer loyalty. While business metrics sounding like NPS may at first seem foreign, they present us with a unique opportunity to demonstrate what DevOps and APM is really all about – winning more customers and getting them to stick with you.


  • The DevOps Scorecard

    The DevOps Scorecard

    Mid-last year our team switched from doing Agile to doing DevOps. As we forayed into the journey trying to learn about DevOps and practice it at the same time,  a lot of questions arose in the team.  How was this different from agile and most importantly How were we going to be successful?

    That’s when we wrote down what would be the success criteria for our team: “Ship code frequently without causing a customer outage“.

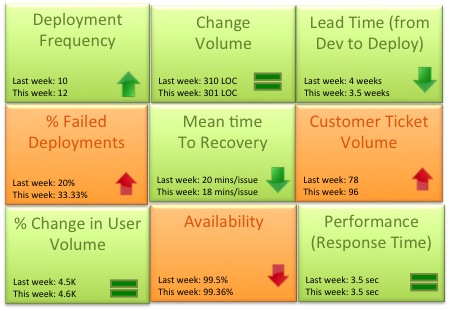
    As the team matured we started evaluating a more granular way to track success.  Could the team mantra be broken down into quantifiable success metrics that could be represented in a scorecard? Based on our experience the DevOps scorecard should contain these 9 metrics to track DevOps team success:

    DevOps Scorecrd

    1. Deployment frequency: How often were we deploying code and getting new code in the hands of our customers? This metric should trend up or remain stable from week to week. Example: Twice a week, 50 times a day
    2. Change volume: For each deployment how many user stories and new lines of code were we shipping?  Example: 3 new features per day, Average 500 lines of new code per week. Another parameter to consider in addition to volume is complexity of change.
    3. Lead Time (from Dev to Deploy): How long does it take on an average to get the code from development complete through a cycle of A/B testing to 100% deploy and upgrade on production? Lead time should reduce as the team gets a better hold of the lifecycle.
    4. Percentage of failed deployments: What percentage of deployments failed causing an outage or a negative user reaction? This metric should decrease over time. Example: 9% deployments failed this month as opposed to 15% last month. This metric should be reviewed in combination with the change volume. If the change volume is low or remained the same but the percent of failed deployments increased, then there maybe a disfunction somewhere.
    5. Mean time to recovery: When we did fail, how long did it take us to recover? This is a true indicator of how good we are getting with handling change and this should ideally reduce over time.  You can expect some spikes in this number due to complex issues not encountered before. Example: On an average it took the team 15 minutes to resolve each last week, 14 minutes this week.
    6. Customer Ticket Volume: Number of alerts generated by customers to indicate issues in the service. This is a basic indicator of customer satisfaction. Example: 54 tickets were generated this week as opposed to 38 while the user volume remained steady is not a good thing
    7. % Change in User Volume: Number of new users signing up, interacting with my service and generating traffic. As new users sign up is my infrastructure able to handle the demand? Example: This week the number of customers spiked by 30% due to an external event causing volume of requests to go up
    8. Availability: What is the overall uptime for my service and did I violate any SLAs? Example: 99.9% uptime consistently for the last 3 months even with change in user volume
    9. Performance (Response Time): Is my service performing within my predetermined thresholds? This metric should remain stable irrespective of % change in user volume or any new deployment. Example: Sub 5 second response time from all geographies and devices

    Would love to hear thoughts on what other critical metrics DevOps teams are using

  • 5 ways APM can solve your DevOps worries

    5 ways APM can solve your DevOps worries

    This week at the InterOp conference in New York I had the chance to talk to a lot of IT managers transforming their organizations to adopt a DevOps culture. One of the key questions I heard repeatedly was – are there some best practices to break down the wall between Dev and Ops?  How do you get to a point where we can deploy code multiple times a day like Facebook , Amazon and Netflix without impacting our users’ experience ? How do we minimize the risk of deployment failures and the blame game that ensues? With the need to innovate and close the customer feedback loop quickly Ops is being asked to deploy code more rapidly than ever before.  The complexity of hundreds of developers updating code makes it a very sensitive environment. The last thing Operations wants is an outage leading to financial loss and the last thing development wants is to get a call in the middle of the night to figure out what code change caused it.

    To have tight control over this fast paced environment we need Application Performance Management at every step. APM can help break down the Chinese wall between Dev and Ops and eliminate the finger pointing that happens during outages. Here are 5 APM best practices to enable a smooth DevOps working environment

    1. Use the same APM tool in Dev and Ops: APM should not be an afterthought , should not be a tool that only Operations looks at to monitor apps. APM is essential in every step along the way , from dev/test to staging to production. As a part of test deployment, developers should use the same APM tool as Ops to see the impact of the code deployment on the application’s performance and catch issues before hand. With the same tool everyone is on the same page and there is less confusion on the metrics being tracked. Developers can’t say “Sorry Ops, we are not seeing the problem”
    2. Isolate and fix performance problems sooner with Code Level Diagnostics:  Today’s APM tools come equipped with deep diagnostics that lets you drill down to the line of code that may be causing a performance slowdown. When code deployed in the Test or Staging environment results in a response time spike, developers can use deep dive code diagnostics to detect the line of code, the SQL query, the method call that may have caused the spike and fix the problem before it is deployed on production. For example, you can detect that a SQL query is taking way longer than it did last week for a specific mobile device platform.
    3. Detect changes with Deployment Detection: When new version of code is deployed in production, the change should be detected automatically without having to reconfigure the APM tool.
    4. Analyze Pre and Post Deployment Performance Trends: Get before and after snapshots of the end to end transactions from your APM tool and compare performance trends over time. With topological visualizations you can, at a glance, see if any particular business transaction slowed down post deployment. With historical data you can see how the application’s performance and resource consumption is evolving over time. This will help fine tune your apps’ resources as well. For example you can determine whether an AJAX call has been slowing down over the last 2 weeks due to the slow down of a third party API call or because a disk consumption is increasing over time.
    5. Automate actions on failures: Configure your APM tool to take actions on failures. For example configure an action to automatically increase memory if a memory spike alert is generated post-deployment while you take the time to diagnose the root cause.

    Using APM let your developers focus on writing code rather than spend time fighting deployment catastrophes and enable a healthy collaborative working environment between Dev and Ops.

  • Mobile Apps and Big Data Megatrends Drive Application Performance Management

    Mobile Apps and Big Data Megatrends Drive Application Performance Management

    As the megatrends of Big Data, mobility and cloud continue to reshape the IT landscape many companies are responding by refocusing their solutions to provide better visibility and support for these technologies.  Case in point is AppDynamics new Spring 2014 release announced yesterday (full disclosure, AppDynamics is a sponsor on devopsy.kinsta.cloud but that sponsorship has nothing to do with editorial content, just banners).

    Jyoti Final_1I had a chance to catch up with Jyoti Bansal, founder and CEO of AppDynamics yesterday. Jyoti made it very plain that mobile applications are quickly tipping the bar in terms of what types of applications his customers are asking for support on. That along with enhanced NoSQL support and support of some for some of the hottest languages being used in development today (Node.js and Scala) lead the way in his company’s latest release.

    Gartner has weighed in on the increasing importance of monitoring mobile app performance.  Jonah Kowall, research vice president at Gartner, in a recent report states, “driven by the increasing significance of mobile application endpoints and increasingly dynamic Web technologies, end-user-experience monitoring will become even more important to enterprises. In fact, it is likely to shift its center of gravity from monitoring the end-user experience of individual applications to monitoring and analyzing end-user behaviors across the entire portfolio of applications available to an end-user at any given endpoint.”

    Personally I don’t think any of us need Gartner to tell us that there is an app for just about anything and many of them are mobile. Mobility is changing the way so many of us work. Mobile apps are poised to overtake web browsing sometime this year says Jyoti.

    If anything is bigger than mobile though it may be Big Data. It seems that Big Data is everywhere. I saw an interesting stat the other day, something along the lines of 90% of all the data stored in the world is less than two years old. I guess that explains why we didn’t hear as much about Big Data before that.  In any event there is big money being poured into Big Data solutions. Evidence of this is Intel’s Cloudera investment, $740m for 18% of the company. Cloudera is a Hadoop distributor of course and part of the AppDynamics new Big Data support is for enhanced Hadoop features.

    NoSQL companies have also been a big beneficiary of the Big Data megatrend  and VC investment of course. One of the biggest beneficiaries is MongoDB (again in full disclosure, devopsy.kinsta.cloud is a media sponsor of MongoDB World).  Matt Asay who has written here on devopsy.kinsta.cloud and is also the VP of Marketing and Business Development had this to say about AppDynamics new NoSQL support. “Together with AppDynamics and MongoDB, organizations can now leverage application performance management solutions to gain further insight into their MongoDB-based applications. This partnership allows users end-to-end visibility for optimal performance in production, an important feature for companies as they scale their MongoDB deployments.”

    To be accurate all of these new features in the Spring 2014 release of AppDynamics have actually been available already for at least a few weeks or months. In my conversation with Bansal I asked him that if he didn’t see a little irony in the fact that a DevOps enabler like AppDynamics still did somewhat traditional software releases instead of some sort of continuous delivery.  Bansal said that these once a quarter releases are really just packaging up features that are released in a continuous fashion over the preceding quarter.  These quarterly releases serve as a checkpoint, version control if you will.  In actuality though AppDynamic customers have been getting this functionality as it comes out.

    Application Performance Management seems to be a very hot area. In large part because of the mega trends of Big Data, mobility and cloud. It remains to be seen if these solutions will become part of (by acquisition or partnership) the bigger Application Development Lifecycle Management (ALM) market.