Category: Features

  • GitLab Gets an Overhaul

    GitLab Gets an Overhaul

    GitLab launched its next major iteration, GitLab 15, starting with its first release version, 15.0, which the company said pulls together new DevOps and data science capabilities into the platform. With GitLab 15, GitLab says it provides (or soon will provide) continuous security and compliance, enterprise Agile planning, visibility and observability, workflow automation and increased support for data science workloads.

    In an interview with DevOps.com, Hillary Benson, director of product management, detailed how GitLab 15 provides several security benefits, including the ability to automatically create an exportable software bill of materials (SBOM) and signed attestation for build artifacts, centralized security policy management including a two-step exception approval process, as well as providing compliance managers the ability to see project history changes and better enforce policy. “Supply chain security, especially, has become a major area of focus for us, both because it’s become a high priority in the industry and because GitLab is uniquely positioned to support customers well in this area,” Benson said.

    GitLab 15 also provides improved static application security testing (SAST) with stronger and more flexible rules and finding management, Benson said. Finally, users can pool together GitLab project data to create custom automations.

    According to Benson, GitLab 15 will also introduce more capabilities that interlink data across every stage of the DevOps life cycle from initial planning, implementation, deployment and monitoring. “Some of the things that will happen in this area are additional options for the types of work items that can be managed,” said Benson. That includes supporting a more diverse range of workflows and frameworks—including enterprise Agile frameworks. The platform will continue to support issues, epics and requirements and soon enable tasks, features and objectives.

    GitLab 15 provides new capabilities the company hopes will increase visibility and enable an end-to-end view of value delivery and application health, the company said. The unified collaborative context will help remove DevOps silos within organizations and decrease incident rates as well as provide comprehensive insights into issues that hinder performance in addition to real-time triaging of incidents. These new capabilities can help shorten lead times from code to production, reduce error frequency and severity, help development teams deploy more frequently and reduce mean-time-to-recover (MTTR) after an incident.

    Upcoming features include improved product analytics and experimentation, such as increasing the practicality of surfaced data by enabling testing and validating new ideas and measuring the adoption of DevOps best practices across teams and projects, Benson said. Expanded support for all DevOps research and assessment (DORA) metrics including improvements to value stream analytics for projects and groups is also addressed. “This is about making it easier to understand what value your product is bringing,” said Benson. “We’re introducing product analytics and experimentation to increase the practicality of the data that you’re using and the data you’re collecting to actually move your product forward,” says Benson.

    Finally, GitLab 15 will increase support for data science teams and their workloads. “This is about streamlining the development and deployment of machine learning models to train and test those and then get them into production. We’ll also be working on providing monitoring for those workloads so that it can be understood if those models are being used, how they’re being used and where there may be performance issues,” said Benson.

  • Survey Surfaces Multi-Cloud Computing and Cost Challenges

    Survey Surfaces Multi-Cloud Computing and Cost Challenges

    A survey of 360 CIOs and IT leaders in the U.S. and the United Kingdom found that, as the number of cloud platforms an organization employs expands, the number of tools they are required to deploy and master does, too.

    The survey, published this week by Virtana, a provider of a platform for managing cloud migrations, found nearly two-thirds of respondents (63%) reported their organization relied on at least five separate tools for migration, cloud cost optimization, integrated performance monitoring, application performance management and cloud infrastructure monitoring. A full 83% are expending some level of manual effort to consolidate data from all of these tools, or are simply using them in isolation from one another. Only 17% said data integration is fully automated.

    Nearly three-quarters (73%) also noted that siloed efforts limit their ability to realize the full potential of the cloud.

    It appears that multi-cloud computing only makes managing IT more challenging. Not to mention the increased pressure a multi-cloud approach puts on DevOps and developers that already juggle an overwhelming number of tools for development, DevSecOps and more. And, of course, the risk of cloud misconfiguration grows alongside the number of cloud platforms an organization uses.

    According to the Virtana survey, a total of 82% of respondents have a multi-cloud strategy, with more than three-quarters (78%) deploying workloads in more than three public clouds. A full 59% now run more than half of their workloads on public clouds. More than half (51%) also plan to increase the number of public cloud instances they support this year, with more than a third (34%) planning on using five or more cloud platforms.

    More challenging still, more than three quarters (76%) are in the early stages of implementing serverless computing frameworks. Overall, more than half (52%) will continue to maintain a hybrid environment as part of their core IT strategy. A full 96% of respondents see value in workload portability, but only 71% are in the early stages of achieving that goal. Top benefits anticipated include maximized cost savings (58%), reduced cloud service provider risk (46%) and increased business agility (43%). However, nearly three-quarters (75%) have either no or few cloud governance capabilities (34%) or have stitched together disparate tools to achieve that goal (41%).

    Jonathan Cyr, vice president of product management for Virtana, said that as the global economy becomes more challenging, it’s only a matter of time before sensitivity to cloud costs start to rise. Each time the overall IT environment expands, increases in complexity drive the total cost of IT higher.

    It’s not clear to what degree that sensitivity to cloud cost might drive more IT organizations to centralize the management of IT environments. In theory, a single control plane could be employed to manage multiple cloud computing environments, but today most clouds are still managed in isolation from one another.

    IT teams also find themselves inadvertently locked into a cloud platform. The more developers invoke proprietary application programming interfaces (API), the more difficult it becomes to migrate a workload from one cloud platform to another.

    It’s all but certain there will be a cloud management reckoning in the months ahead. Development teams may prefer one cloud platform over another for many reasons but, as the cost of IT continues to increase, there will soon be tougher cloud cost questions emanating from the finance office.

  • Datadog Adds Support for OpenTelemetry Protocol

    Datadog Adds Support for OpenTelemetry Protocol

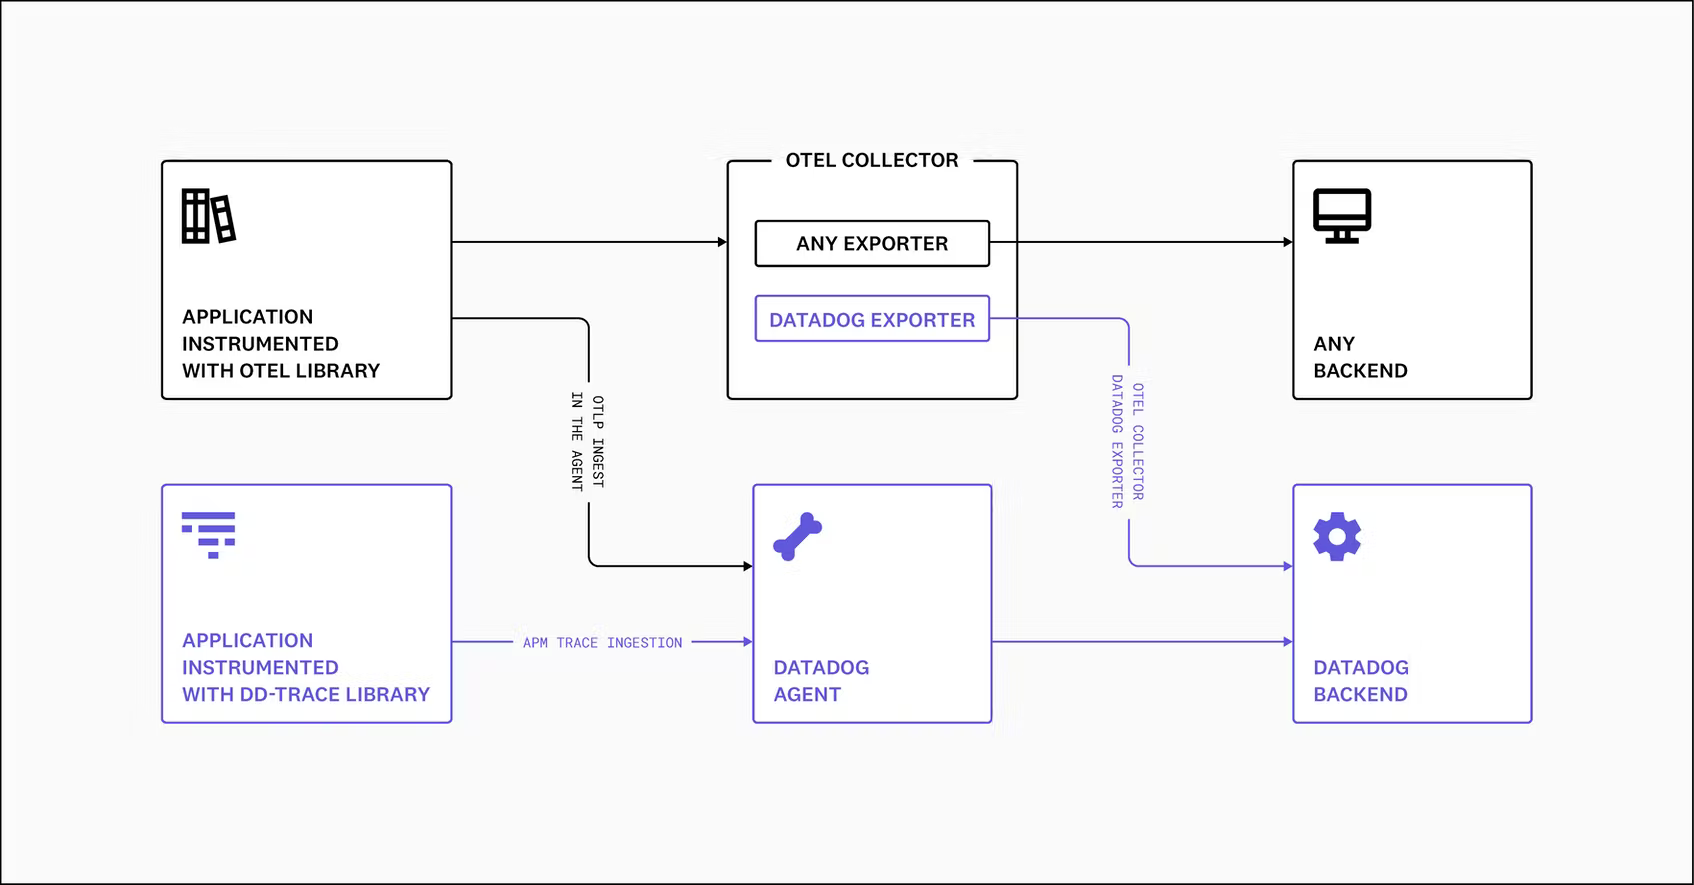
    At the KubeCon + CloudNativeCon Europe 2022 event, Datadog announced it made support for the OpenTelemetry Protocol (OTLP) generally available in the agent software it provides to instrument applications.

    Ilan Rabinovitch, senior vice president of product and community at Datadog, said that capability eliminates the need to install a separate OpenTelemetry collector to aggregate metrics, logs and traces from applications instrumented using the open source OpenTelemetry libraries being advanced under the auspices of the Cloud Native Computing Foundation (CNCF).

    The Datadog Agent can already collect application profiles, network data and infrastructure metrics via more than 500 integrations provided by Datadog. OpenTelemetry extends that capability with a set of application programming interfaces (APIs) and a wire protocol for instrumenting applications.

    Datadog is the latest in a series of providers of observability platforms that added support for the OpenTelemetry project that continues to gain momentum. The goal is to make it less costly to instrument applications using open source agent software that surfaces a consistent set of interfaces. Previously, each observability platform provider developed their own agent software that DevOps teams would need to install. Datadog is making a case for agent software that, in addition to collecting data from existing applications, is now compatible with the OLTP protocol created by contributors to the OpenTelemetry project.

    The issue that DevOps teams will need to come to terms with is that while OpenTelemetry agent software is free, many of them have already installed proprietary agent software to instrument applications. That agent software can often provide additional context that is not yet available in OpenTelemetry. History, however, shows that, in time, open source projects with larger numbers of contributors will outpace the ability of any single vendor to innovate.

    One way or another, DevOps teams will be instrumenting more applications as more microservices-based applications are deployed. The dependencies that exist between microservices make it too difficult to manage an application environment without additional instrumentation. The goal within many DevOps teams is to eventually replace the hodgepodge of monitoring tools that track a limited set of pre-defined metrics with an observability platform that not only aggregates metrics but enables DevOps teams to launch queries and surface IT issues before they become a major issue. In some instances, the rationalization of monitoring tools will help justify the acquisition of an observability platform.

    Observability, of course, is one of the core tenets of any set of DevOps best practices. Achieving it, however, has always been a challenge. Rabinovitch said an observability platform that regularly surfaces critical IT issues without requiring DevOps teams to launch queries to search for anomalies will eventually win the battle for observability supremacy.

    In the meantime, there is already no shortage of observability platforms. The challenge will be determining which one enables the highest level of instrumentation at the most reasonable cost.

  • Continuous Delivery Foundation Adds Interoperability Project

    Continuous Delivery Foundation Adds Interoperability Project

    At a CDEventscon event this week, the Continuous Delivery Foundation (CDF) announced it is hosting a CDEvents project through which it hopes to create a vendor-neutral specification for defining the format of event data across multiple services, platforms and systems.

    Andrea Frittoli, open source developer advocate at IBM, co-creator of the CDEvents project and member of the CDF technical oversight committee, said the open source consortium is launching this initiative to foster interoperability across continuous delivery (CD) platforms. In the context of the CDF, that mission spans both continuous integration and continuous deployment platforms that are subsets of CD.

    CDEvents itself is based on an existing CloudEvent specification created by the Serverless Working Group within the Cloud Native Computing Foundation (CNCF). As part of the effort, the CDF has already built a proof-of-concept implementation that enables Tekton pipelines and Keptn orchestration tools for managing application life cycles to communicate over a common event protocol.

    Collecting metrics from multiple DevOps platforms is a challenge because there is no standard for sharing event data. Analytics providers and value stream management platforms that collect metrics need to create connectors for each platform they support. CDEvents would provide a standard interface for collecting metrics from any developer tool or platform. That data would also make it easier to visualize workflows that describe artifacts and their metadata, he added.

    That lack of a common way to describe events means developers not only must constantly re-learn how to consume events, it also limits the potential for libraries, tooling and infrastructure to facilitate the delivery of event data across environments ranging from routers and tracing systems to software development kits (SDKs).

    Naturally, it may be a while before this continuous delivery specification results in increased interoperability across DevOps environments, but the need for one across what has become a patchwork of fragmented tools and platforms is self-evident. Many organizations are already investing in an assortment of analytics tools in the hopes of improving the rate at which applications can be developed and deployed. In too many instances, DevOps teams have inadvertently created bottlenecks that slow down the rate of development. The challenge is that, as new tools and platforms are added to a DevOps workflow, they are not likely to be able to share data with those applications until a connector is created.

    Not everyone, of course, is a fan of having more metrics. The goal should be to coach teams on how to become more efficient rather than implementing a set of draconian mandates. Arguably, such mandates are only going to drive away developers that are trying to strike a balance between coding as an art form and application development as a craft.

    Nevertheless, as organizations better appreciate the critical role software plays in driving business processes, the greater the desire to measure the pace and efficacy of their application development efforts—to justify the levels of investment in software development they are making.

  • New Relic Expands Scope of Observability Reach

    New Relic Expands Scope of Observability Reach

    At its Futurestack conference, New Relic announced it expanded the integrations and tools it provides for its observability platform and added its first cybersecurity tool.

    The company now provides more than 470 integrations with cloud services, open source tools and other enterprise technologies, with support for offerings from Akamai, Atlassian, CircleCI, Cloudflare, Netlify, PagerDuty and Postman now being added to its Instant Observability platform. The company has also added the ability to now collect logs alongside metrics and traces within its Application Performance Monitoring (APM) offering.

    Finally, New Relic has deepened its cloud ties with Microsoft, added a guided user onboarding interface, support for a wider range of instrumentation methods, tighter integration with Kubernetes and, for the first time, is branching out into the realm of cybersecurity via a New Relic Vulnerability Management service that is being added to its software-as-a-service (SaaS) portfolio.

    Ishan Mukherjee, group vice president for product go-to-market at New Relic, said New Relic Vulnerability Management is the start of a larger effort to enable IT teams to leverage the observability data they already collect via the New Relic platform to drive the adoption of DevSecOps best practices. Legacy approaches to vulnerability management create yet another silo of data that only further aggravates cybersecurity blind spots, he noted. New Relic Vulnerability Management aggregates data collected via its agent software and integrations with a wide range of platforms to provide a unified view of the overall security posture of an IT environment, Mukherjee added.

    It’s still early days as far as adoption of observability platforms is concerned, but it’s apparent that platforms that unify the collection of metrics, logs and traces across both applications and the IT infrastructure they run on are transforming how IT is managed. Most DevOps teams today are able to continuously monitor IT environments using tools that track a set of pre-defined metrics; observability platforms make it possible to aggregate data so that DevOps teams can launch queries that help them uncover the root cause of an IT issue. That capability is increasingly becoming critical as IT environments—thanks, in part, to the rise of microservices and cloud computing environments—become too complex for IT teams to manage using legacy tools.

    The challenge is that most IT teams are not quite sure what questions they should ask to get the most value from investment in an observability platform. Observability platforms that accurately surface issues without requiring much intervention from IT teams are likely to gain the most traction, as the competition among providers of these platforms intensifies.

    In the meantime, organizations might want to start reevaluating roles within their IT teams as it becomes simpler to collaborate around a single source of data. The days when IT teams had to triage issues using disparate tools that surfaced conflicting data may finally be coming to an end. As such, it should become possible for a team of IT professionals to manage a wider range of processes across an extended enterprise IT environment.

    Naturally, it may be a while before observability platforms drive wholesale reorganizations of IT teams, but it’s now more a question of when rather than if that day will come.

  • DevOps Institute Releases Upskilling IT 2022 Report 

    DevOps Institute Releases Upskilling IT 2022 Report 

    DevOps Institute, a professional member association working to advance the humans of DevOps, announced the release of its Upskilling IT 2022 report. In its fourth year, the Upskilling IT report highlights the need to close the DevOps skills gap and identifies emerging job roles within the industry. 

    Through data collected in the Upskilling IT 2022 survey, DevOps Institute introduced a new four-report system which includes: the Global Report, Americas Regional Report, EMEA Regional Report and APAC Regional Report. With the help of 2,476 survey respondents across 120 countries, the report helps IT professionals accelerate transformations.

    Managing Technical and Talent Debt

    “Strong human skills like collaboration, communication and social adeptness remain essential to the DevOps journey,” said Jayne Groll, CEO of DevOps Institute. “In 2022, upskilling is as much an individual endeavor as it is an organizational responsibility.”

    One key finding is that insufficient IT resource skills are a major challenge globally. In fact, 40% of survey respondents said that the resource and skills shortage is one of their top three challenges. 

    The report also found that addressing technical debt must be paired with addressing talent debt. The importance of technical skills is apparent throughout the findings, but without the necessary human skills, innovation and transformation are disrupted.  

    “The 2022 data shows that managing talent debt alongside technical debt maintains competitiveness and drives organizational growth,” said Eveline Oehrlich, DevOps Institute’s chief research officer. 

    Another major takeaway is that upskilling is a professional and organizational imperative. Continuous learning must be prioritized by individuals and organizations to tackle the issues faced throughout the industry.

    “As leaders manage the shortage of skilled individuals, they must embrace a continuous learning environment to expedite organizational transformation and remain competitive in the market,” said Oehrlich. 

    The 2022 report is available to download for free. 

  • Splunk Survey Surfaces Gains in Observability

    Splunk Survey Surfaces Gains in Observability

    A global survey of 1,250 observability practitioners, managers and other experts published today by Splunk found that sophisticated observability practitioners are able to cut downtime costs by 90%. That figure is based on an estimated cost of $23.8 million annually for comparative newcomers to $2.5 million. However, only 9% of respondents are advanced enough to be considered observability leaders compared to 59% that are still beginners.

    Those leaders reported they are seeing a 69% better mean-time-to-resolution (MTTR) for unplanned downtime or performance degradation thanks to investment in observability. The survey also noted those same organizations launched 60% more products or revenue streams from application development initiatives in the last year.

    Observability has always been a core DevOps tenet, but achieving and maintaining is a challenge. Most DevOps teams today aspire to be able to maintain some level of continuous monitoring. However, as it becomes easier and less costly to instrument applications, interest is rising in observability platforms that make it simpler to launch queries and investigate anomalies.

    Spiros Xanthos, senior vice president and general manager for observability at Splunk, said observability platforms are clearly driving down the cost of downtime. There is also a clear correlation between organizations that have embraced observability and the number of microservices-based cloud-native applications that have been deployed, he noted. In effect, increased complexity is driving organizations to turn to observability platforms to manage IT environments in the age of the cloud, said Xanthos.

    The survey found 75% of respondents have multiple cloud-native applications that run in multiple environments. Just over one-third (34%) of internally developed applications are based on microservices constructed using containers, with 28% of respondents reporting they exclusively run cloud-native applications on public cloud infrastructure.

    Overall, the survey also found that two-thirds of leaders reported their visibility into application performance is excellent compared to 44% of beginners, while 64% of leaders reported that visibility into their security posture is excellent compared to 42% for beginners.

    The survey also found 59% of leaders can push code to production on demand for most internally developed applications compared to 28% of beginners. A total of 41% of leaders said they can detect problems associated with internally developed applications within minutes compared to 20% for beginners.

    It’s still early days as far as adoption of observability platforms is concerned but, theoretically, IT should become easier to manage even as the number of platforms employed continues to expand. Advances in analytics and artificial intelligence (AI) are improving the signal-to-noise ratio so that not only are more issues being surfaced sooner but that more trusted recommendations are being made, said Xanthos.

    Observability is, of course, a journey. Most organizations are not even quite sure what type of questions they should formulate to get the most value from investment in an observability platform. Organizations should start small, with a finite project to gain an understanding of how to leverage observability more broadly as they gain more maturity, said Xanthos.

    Regardless of the approach to observability, the one thing that is certain is that traditional IT monitoring is no longer sufficient in an era where IT environments get more complex by the day.

  • Apple Allows 50% Fee Rise | @ElonMusk Fans: 70% Fake | Microsoft Salaries up by 100%?

    Apple Allows 50% Fee Rise | @ElonMusk Fans: 70% Fake | Microsoft Salaries up by 100%?

    Welcome to The Long View—where we peruse the news of the week and strip it to the essentials. Let’s work out what really matters.

    This week: Apple lets devs increase subscriptions “without consent,” Twitter has more than 19% spam accounts, and we dig into the claim that Microsoft is about to double salaries. (more…)

  • Increasing Use of SLOs to Enable Observability

    Increasing Use of SLOs to Enable Observability

    Observability is a growing discipline among most IT and operations departments. To release stable software faster, operators need continuous visibility into metrics like performance, uptime and availability. As a result, engineers are increasing their use of service-level objectives (SLOs) across the board—a recent study found that 82% of companies are increasing their use of SLOs.

    SLOs enable deep visibility into specific applications’ performance and are often used by site reliability engineers (SREs) to ensure quality and avoid service interruptions. Not only that, but various teams are correlating SLOs to aspects of the business to reduce cost and help direct decision-making. But while many environments have visibility, there are still gaps present.

    Nobl9 recently released a global survey of IT professionals and executives that tracked the state of service-level objectives in 2022. Below, we’ll look at the key findings from the report and consider what they mean for the state of SLOs and observability in general.

    State of Observability and SRE

    In general, site reliability engineering is still maturing across organizations. Though only 31% of companies have adopted SRE, it’s slated for much future growth, as 46% said they plan to embrace SRE in the future.

    These operators are now faced with many cloud-native observability tools, which are producing a sea of data in the form of metrics, logs and traces. A full 39% of companies use anywhere from six to 10 observability and monitoring tools and 35% use more than 11.

    With so many tools now deployed, who is using this observability and monitoring data? Namely, at 74% of companies, observability data support operational requirements. Operations teams are the ones most likely to use SLOs to monitor uptime, performance and overall efficiency. After operations teams, security teams also use this observability data (71%), which makes sense as SLOs can inform incident response. Other areas that follow are customer support, compliance and capacity planning.

    One interesting finding is that only 42% of companies use SLOs for service-level agreement (SLA) adherence. This indicates that SLOs are most often applied to internal optimizations and decision-making.

    Hybrid Environments Complicate Visibility

    Companies are mostly tracking SLOs to increase their visibility into networks (83%), databases (76%) and applications (75%). Other top areas include private cloud environments and legacy computing arrangements. But although observability is trending, organizations still lack complete visibility across the entire stack.

    Of note is that nearly half (46%) of respondents said their monitoring and observability tools don’t provide full visibility into all of their company’s IT assets. For example, only 45% of companies have visibility into their containers and just 35% have visibility into their microservices architecture.

    A lack of full-stack visibility may be complicated due to rising hybrid and multi-cloud conditions, as 78% say a hybrid cloud environment makes monitoring infrastructure more difficult.

    Benefits of Tracking SLOs

    The report defined SLO as “a performance and availability target set for a given system, application [or] service over time.” And the benefits are readily apparent for organizations following such targets—they can help increase performances, direct decision-making and help avoid outages.

    As a result, 70% of companies are currently using SLOs in some fashion. Here are some benefits of tracking SLOs:

    • Increase microservice performance: 87% said using SLOs for microservices architecture would improve service performance.
    • Enable full-stack observability: 58% said some of their company SLOs are mapped to business operations.
    • Improve business decision-making: 91% agreed using SLOs can help drive better business decisions.
    • Prevent service interruption: 67% said their company prevented business interruptions thanks to SLO thresholds alerts.
    • Reduce expenses: 90% indicated SLOs saved their company money.

    Final Thoughts

    More teams are tracking service-level objectives than ever before. And most companies (71%) that aren’t using SLOs now plan on adopting them soon. The data demonstrated that the observability market is an evolving area with room to grow. And, the same can be said about the SRE role.

    Yet, it’s good to point out that not all companies will adopt precisely the same roles or monitoring procedures. Therefore, there will likely continue to be variance in who is using SLOs and how they are applied. Regardless, the study suggested that investigating SLOs has the potential to benefit the software life cycle in many ways.

    The study, “Adoption of SLOs Grow to Increase Visibility and Drive Business Improvements” surveyed 309 participants around the globe in various sectors. The study was sponsored by Nobl9 and conducted by Dimensional Research. For more information, you can download the report here.

  • Observe, Inc. Dives Deeper Into Observability

    Observe, Inc. Dives Deeper Into Observability

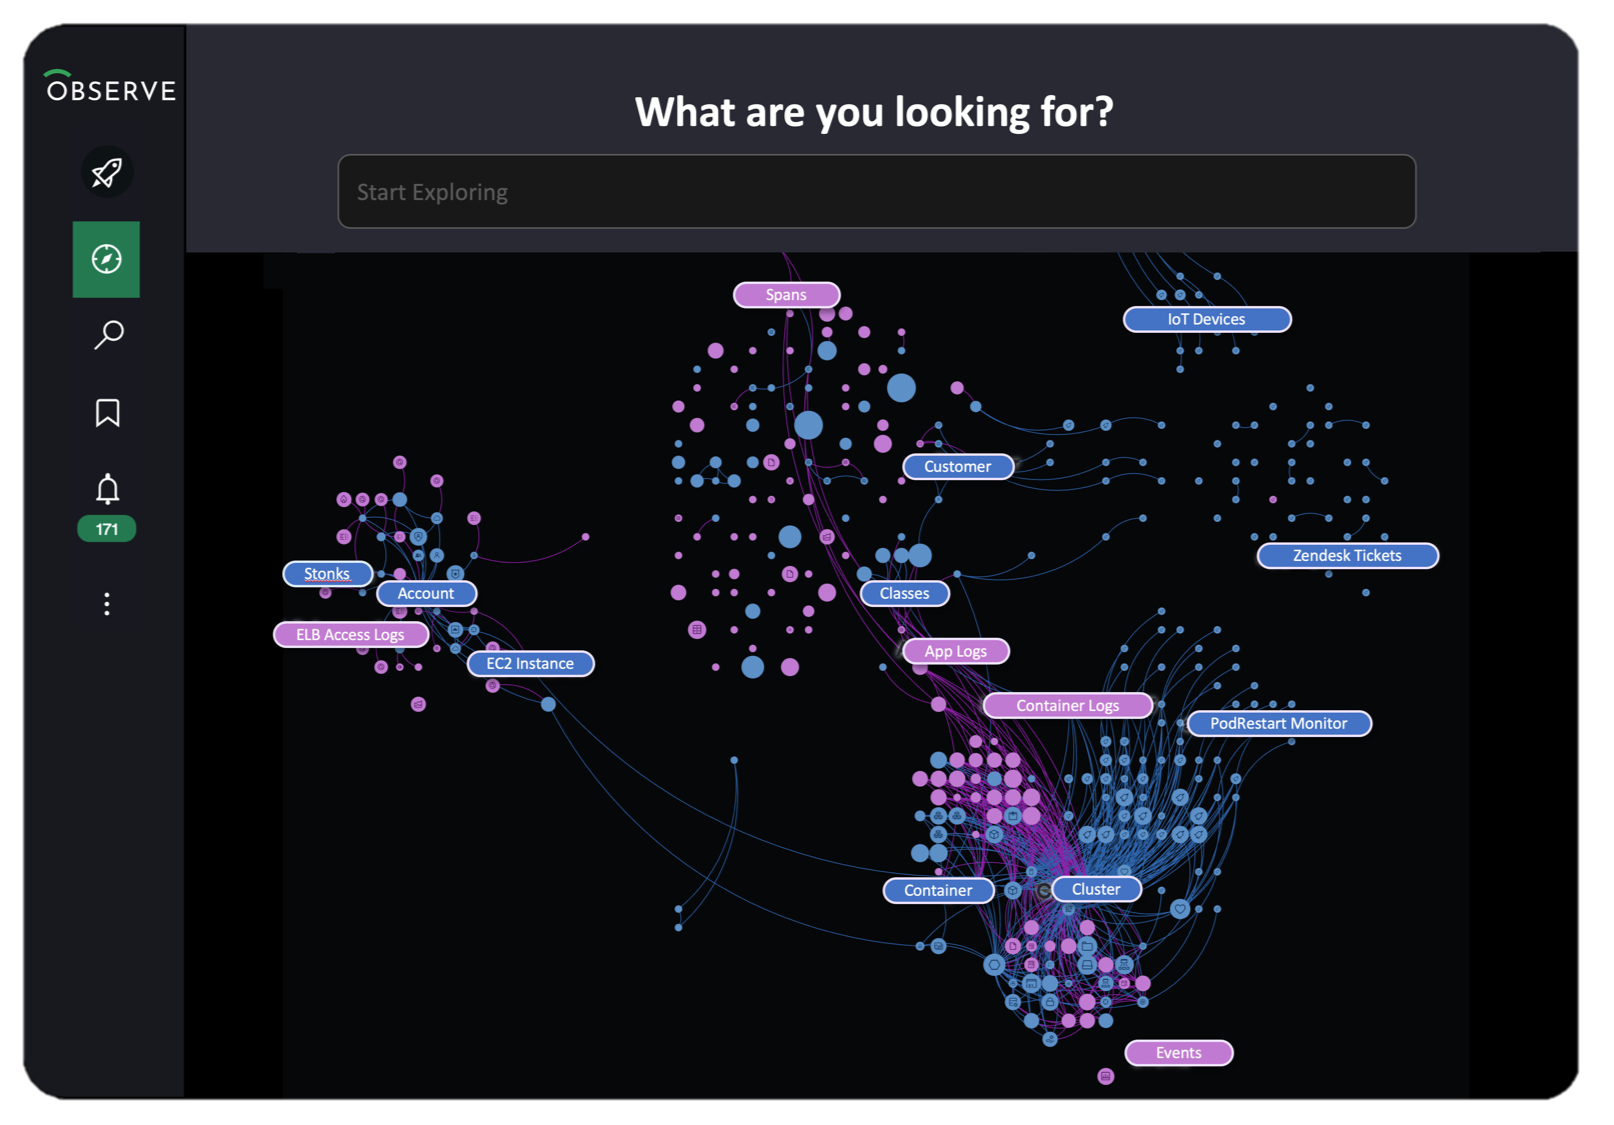
    Fresh from picking up an additional $70 million in funding, Observe, Inc. announced this week it has added multiple tools, dubbed Data Universe Maps, to its observability platform to visualize all datasets and surface underlying event data.

    The company also added pre-built applications for Kubernetes, Amazon Web Services (AWS) and Jenkins environments with editions for Google Cloud Platform (GCP) and Microsoft Azure planned for later this year. Observe Apps are intended to make it easy for IT teams to ingest data that is surfaced via pre-built dashboards that will generate alerts when issues arise.

    Finally, Observe, Inc. has added dashboards that provide transparency into its usage-based pricing model. IT teams can now more easily determine how many credits are consumed by both users and specific datasets to help contain costs.

    Observe, Inc. CEO Jeremy Burton said those tools are crucial because in the absence of tools to control data costs, most organizations will soon discover that observability is unsustainable.

    Of course, it’s not clear yet how many organizations are moving beyond monitoring metrics to embrace observability and launch queries to discover the root cause of performance issues. Many organizations don’t have the level of expertise required to structure such queries. However, as more organizations struggle to investigate and remediate issues impacting customer experience, interest in observability platforms is rising, noted Burton.

    Burton said thus far, as a startup, Observe, Inc. has expanded its customer base by a factor of three to now include 50 organizations, which has resulted in a five-fold increase in the number of monthly active users of the platform. The platform is now ingesting more than 40TB of data each day, with more than 25 million queries each day launched across nearly one trillion rows of more than 10 petabytes of data. Capital One is included among the investors in Observe, Inc.

    At the core of the Observe platform is a graph engine that makes it simpler to uncover the relationships between machine data that is ingested into the platform.

    Going forward, Burton said Observe intends to add support for distributed tracing using the open source agent software created by the OpenTelemetry project that operates under the auspices of the Cloud Native Computing Foundation (CNCF).

    Change within enterprise IT organizations happens slowly. Many will be using legacy monitoring tools alongside observability platforms for years to come. However, there is an opportunity to rationalize monitoring tools as the capabilities of observability platforms continue to expand.

    In the meantime, IT environments will continue to become more complex as more modern applications based on microservices and constructed using containers are deployed. These applications, over time, are generally more resilient than monolithic applications; given all the dependencies between microservices, determining the root cause of a performance issue can be a major challenge. As a result, it may be just a matter of time before this new class of applications ultimately forces the observability issue in the enterprise.