Category: Features

  • When DevOps-as-a-Service (DaaS) Meets Security

    When DevOps-as-a-Service (DaaS) Meets Security

    One of the most recent IT methodologies to be offered as a service is DevOps, a cultural and practical approach that brings development and operations teams together under one umbrella of work. DevOps-as-a-Service (DaaS) ensures that everything related to the selection, management and maintenance of DevOps tools and infrastructure, including all policies and procedures, are addressed through a centralized team who are able to provide this service to development teams across the organization. 

    From a 30,000-foot view, DaaS represents DevOps capabilities made accessible to practitioners through portals and APIs. Because DevOps capabilities vary among organizations, there is no standardization of these services. For the business, DaaS enhances competition. Application users and developers find DaaS improves overall software development, while specialized DaaS teams say it improves the management of DevOps capabilities.

    What Are the Other Benefits of DaaS?

    DaaS offers many benefits, especially to development teams who no longer want to spend all their time configuring and deploying the necessary security tools to run DevOps pipelines. This means it’s no longer necessary to understand all the differences between DevOps tools and the underlying infrastructure, as the appropriate tools and technologies are automatically deployed for development teams. As a result, developers are able to focus their efforts on creating innovative software at the speed of business. 

    Further, Daas delivers clear business and operational benefits in the form of a more streamlined process for facilitating DevOps across the enterprise. Daas supports governance while also enabling centralized oversight and visibility into development workloads and productivity. As we know, this shift leads to increased accountability among teams and an overall optimization of business processes. Add on resource efficiency and cost savings through tool selection, and it’s easy to see why DaaS has found a home in the world of software development. 

    But despite the benefits, Daas also presents new security challenges that can’t be fully addressed by traditional management solutions. These approaches are often sluggish, expensive, and/or incredibly complex to manage.

    What About Security and DevSecOps?

    Because the principles of DevSecOps proactively address the risks and threats associated with DevOps processes, it has seen rapid adoption in recent years. By integrating AppSec tools and strategies within a DevOps pipeline, developers are able to find and fix security vulnerabilities earlier within the software life cycle—not after the fact. This ability is what allows developers to generate secure and high quality software from the beginning, while also preventing any deployment delays stemming from last-minute security checks in production. With DevSecOps processes in place, AppSec testing becomes seamless and transparent for developers, who need a frictionless experience to facilitate steady and reliable software development and deployment. 

    DevSecOps is a  natural fit for the as-a-service delivery model. Similar to DevOps, AppSec involves various tools, policies and processes that demand a certain degree of professional expertise—not to mention the time and resources it takes to to select, maintain, and deploy them to drive DevSecOps practices. Security and development teams looking to  implement and manage DevSecOps can reap major benefits from a centrally defined and managed process, to be administered by a specialist team and delivered “as a service” to those in charge of DaaS.

    Standardizing AppSec through a DevSecOps-as-a-Service offering would guarantee security is applied evenly across all DevOps activity, thereby allowing businesses to produce secure and high-quality software consistently while also supporting AppSec compliance demands. This shift also establishes a foundation where a holistic and homogenous view of AppSec can be found, one that is critical to the assessment and management of application and business risk. 

    Developing DaaS Metrics

    First, don’t try to boil the ocean by measuring all applications at the same time. Instead, choose an application that’s supported by DaaS processes and appoint a specialized team to develop metrics for the application. This team can look many ways—but would likely include stakeholders, developers and other DaaS-supporting roles. Service-level indicators (SLIs) and service-level objectives (SLOs) are also baked into this model, which are chosen to best suit the requirements of an individual application. 

    Once the most valued SLOs of DaaS are determined, the service can be tailored to identify the most critical SLIs. With this knowledge, things like instrumentation, telemetry and analysis requirements can be identified and used to design alerts, dashboards, analyzers and more. Next, setting up policies and procedures around accountability establishes a complete solution. And once the solution for the chosen application is tested, confidence kicks in and creates an easier process for adapting and expanding the process around other applications. 

    This means DaaS can provide many key capabilities to both the organization and the teams who rely on them. A specialized DaaS team can then figure out the best metrics for larger implementation on any application. As a result, SLOs can be evolved for other future applications, to be used as a baseline for future improvements. 


  • Contrast Security Adds Free Code-Scanning Tool

    Contrast Security Adds Free Code-Scanning Tool

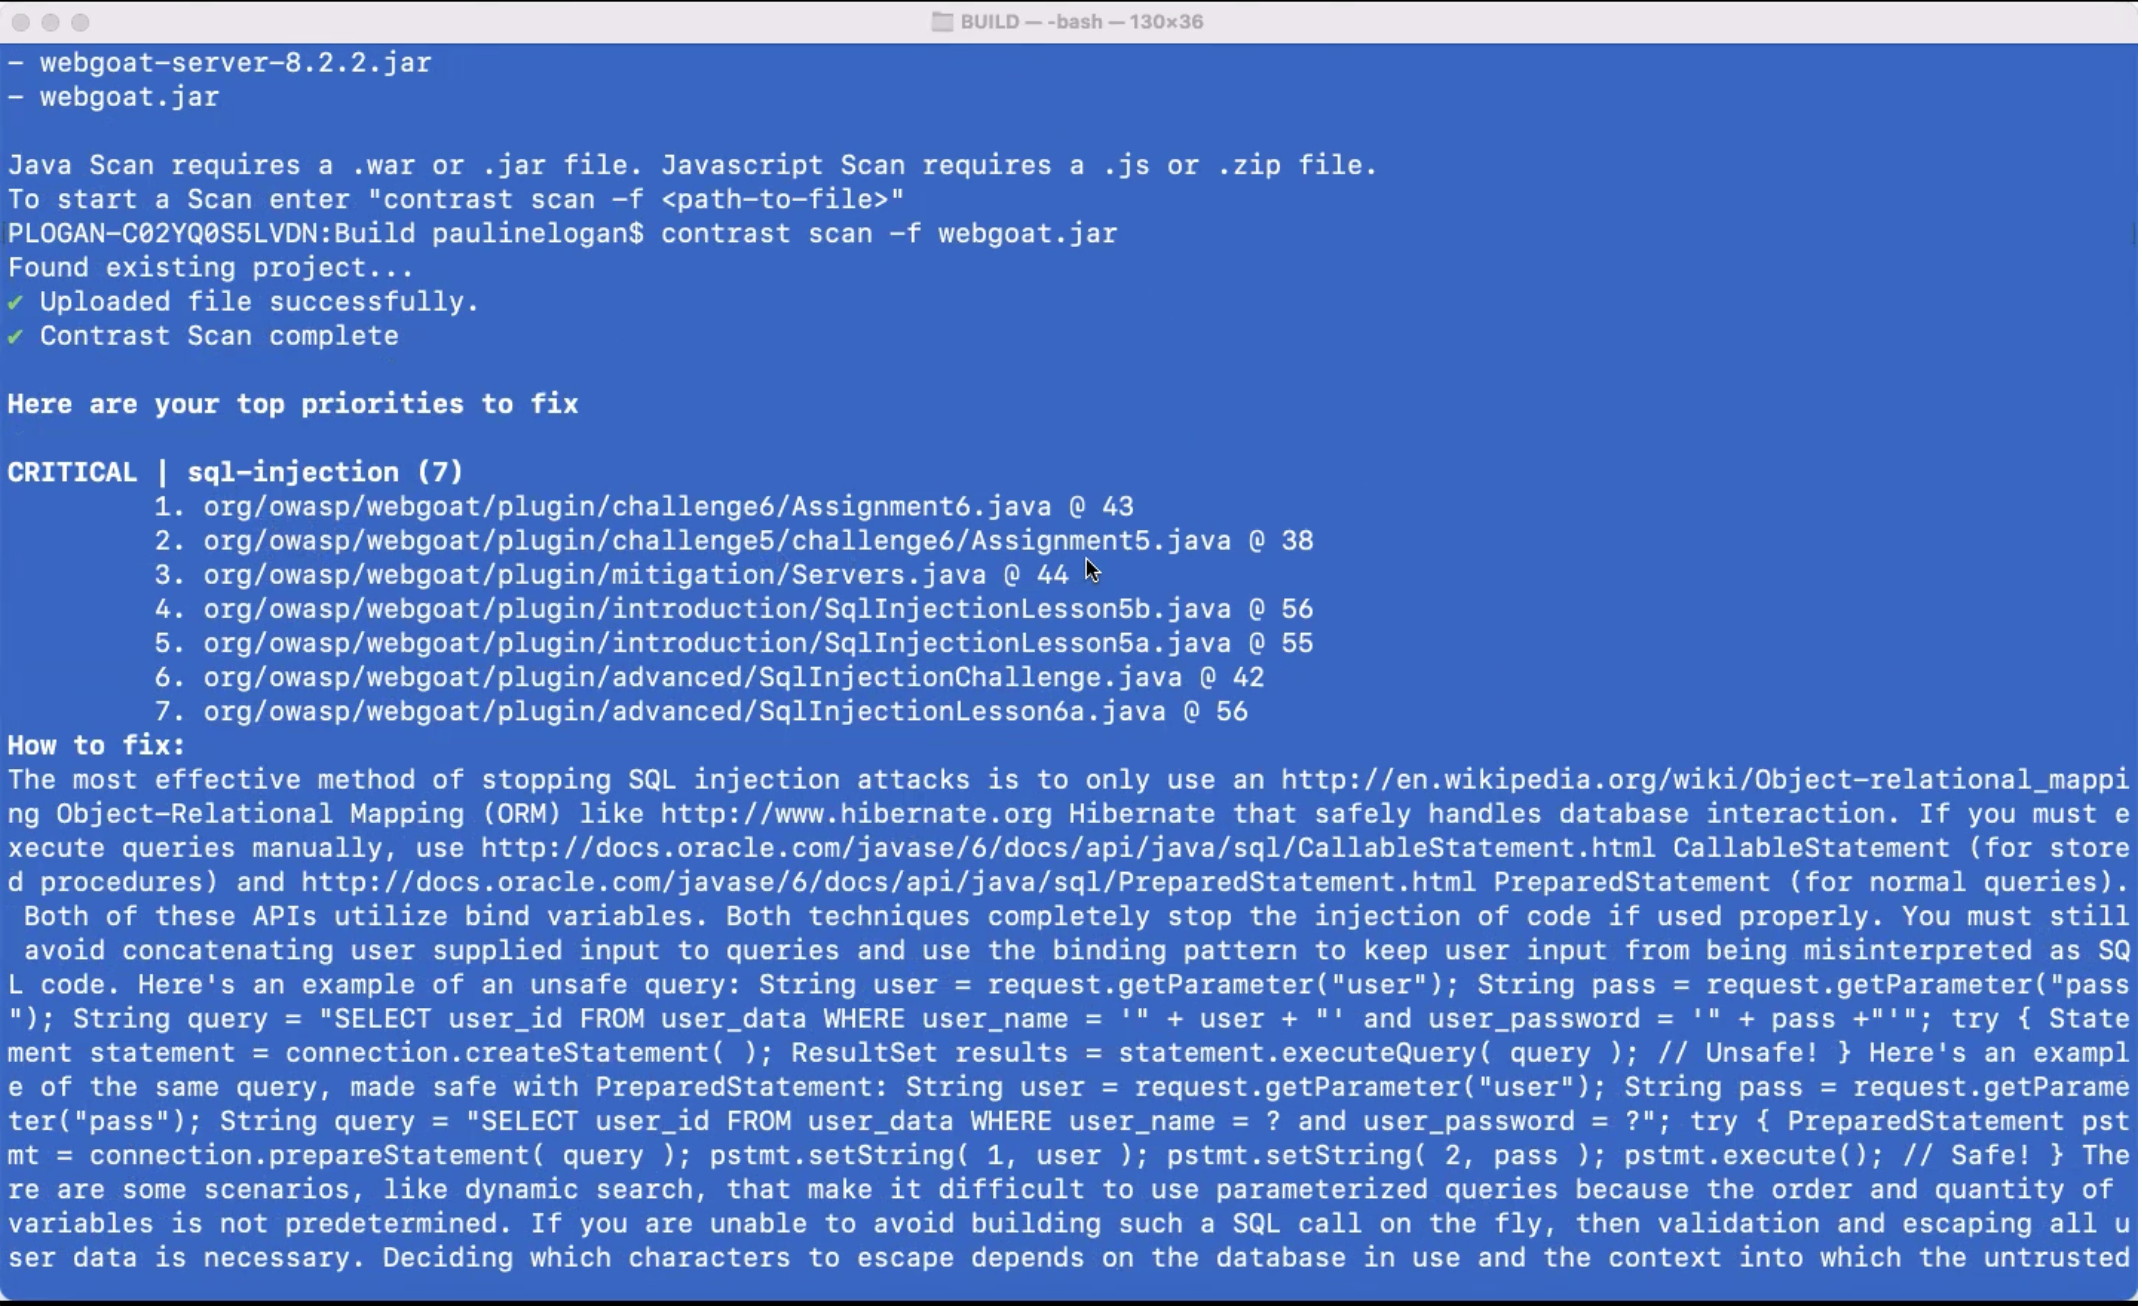
    Contrast Security this week made available a free security tool that enables developers to scan their code using the same core engine used by the cybersecurity team within their organization.

    Steven Phillips, vice president of product marketing for Contrast Security, said while there is no shortage of free tools for scanning code these days, the majority are not especially accurate. The scanning engine in CodeSec by Contrast Security is more than 10 times more accurate, Phillips said, because it is optimized to identify true positives versus generating a lot of false negatives, he claimed. He added that CodeSec is not just another freemium offering for developers that is a hobbled version of a commercial offering.

    CodeSec also differs from Contrast Security’s existing application security tool because it provides access to a command-line interface (CLI) that makes it easier to integrate within the context of a DevOps workflow. That approach makes it simpler for organizations to shift more responsibility for application security further left toward developers, noted Phillips.

    However, shifting responsibility left toward developers is not a panacea, Phillips said. The Contrast Security approach enables more collaboration between development and cybersecurity teams that are using the same scanning engine via a software-as-a-service (SaaS) platform to discover vulnerabilities, he noted.

    It’s difficult to determine just how far cybersecurity might shift left, but every vulnerability discovered by an application development team is one less for cybersecurity teams to ask developers to fix in a production environment. The challenge is making it as simple as possible for developers to discover those vulnerabilities.

    One way or another, the amount of time and effort being applied to application security has increased sharply in recent months following the disclosure of a series of high-profile breaches. Cybercriminals are now targeting software supply chains as part of an effort to compromise a wide range of downstream applications. Many of the modules that developers routinely reuse are being compromised by surreptitiously inserted malware. The fundamental challenge organizations are trying to address is how to build and deploy more secure applications without slowing down the rate at which they are built.

    Naturally, training developers to recognize security issues is a big part of the equation. However, no two developers are ever going to have the same level of cybersecurity expertise. Tools that identify vulnerabilities in ways that developers can act on are critical for advancing the adoption of DevSecOps best practices. Those tools require some level of acceptance among developers because they tend to prefer CLI tools.

    In the meantime, organizations will most likely have to scan a wide range of already-deployed applications for vulnerabilities. Applications running both inside and outside the cloud have been routinely deployed with a minimum level of scanning. The truth is that many developers have tended to view cybersecurity policies as an impediment to building and deploying applications. Unfortunately, cybercriminals now appreciate and take full advantage of the opportunity to wreak havoc.

  • Orca Security Adds CLI to Improve Cloud Security

    Orca Security Adds CLI to Improve Cloud Security

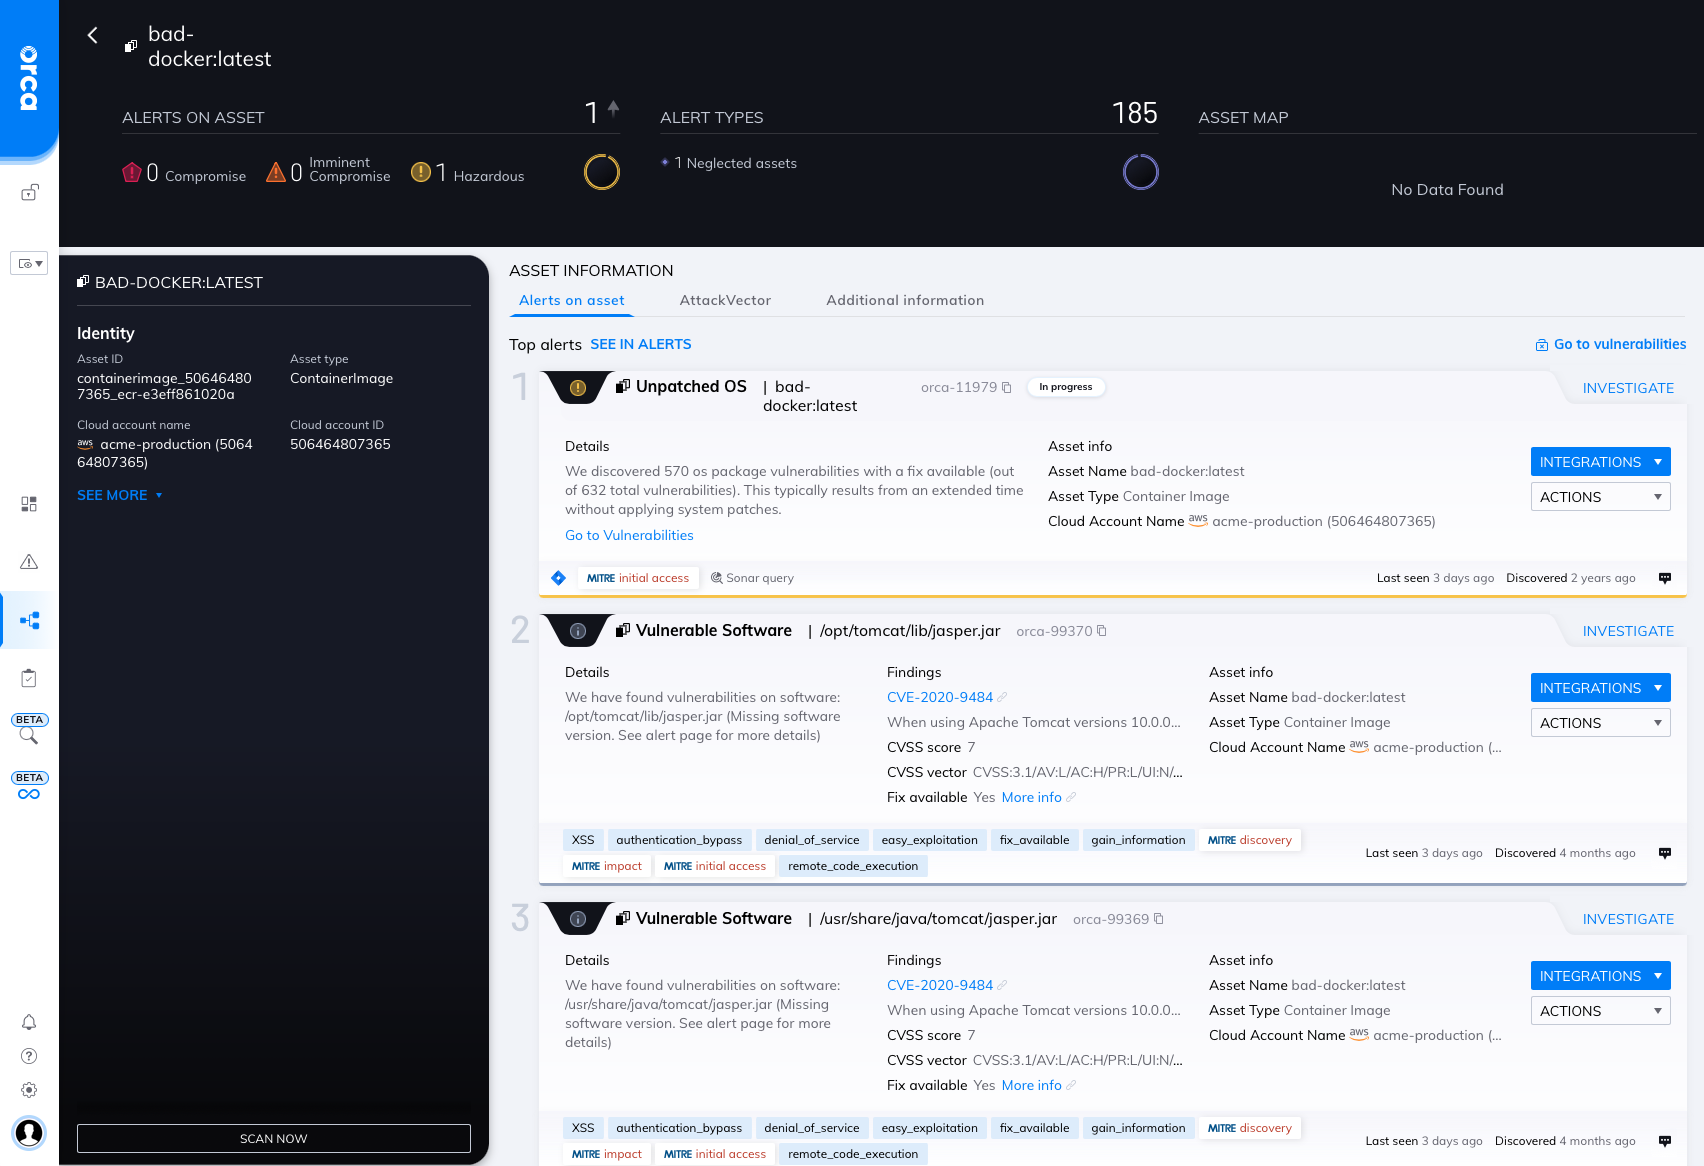
    Orca Security has extended its cloud security platform via a command-line interface (CLI) that makes it simpler to integrate with a wide range of DevOps tools.

    Rather than relying on agents, the Orca Security platform creates a risk profile using read-only access to block storage accessed via a runtime hosted on Amazon Web Services (AWS), Microsoft Azure or Google Cloud Platform. That approach, dubbed SideScanning, eliminates the need for DevOps teams to deploy and maintain agent software to ensure cloud security.

    The platform then scans both workloads and cloud configuration metadata to build a map of risks that better enables DevOps teams to prioritize cloud security efforts.

    Orca Security CEO Avi Shua said the CLI will now make it easier to shift responsibility for cloud security further left toward developers and the DevOps teams that support them by making it easier to scan for vulnerabilities with the context of a larger set of DevSecOps best practices.

    Cloud security remains a major challenge because infrastructure is often provisioned by developers that have little to no security expertise. It’s almost inevitable that mistakes will be made. Orca Security is making a case for a tool that enables organizations to identify those security issues without deploying additional agent software across a wide area network.

    The challenge, of course, is determining how far left to shift responsibility for application security. Even when alerted to a security issue, many developers may not fully appreciate the severity of that issue, noted Shua. Many developers also assume their cloud service provider is providing a level of security that they actually don’t. It’s the responsibility of the entity deploying the application to secure it and the associated configurations used to deploy it. Integrating a cloud security tool within a DevOps workflow becomes critical because it enables more members of a DevOps team to evaluate potential risk to the business as the application is being built rather than after it’s running in a production environment, he added.

    Many existing DevSecOps tools don’t provide enough context; all they do is provide static analysis of the code that’s been deployed, Shua noted. Developers need to have a deeper understanding of which issues represent a level of risk that requires their immediate attention, he said.

    There is, of course, more focus than ever on cloud security as more organizations review how their software supply chains are constructed in the wake of a series of high-profile cybersecurity breaches. Many are discovering that the level of security visibility they have into cloud computing environments is limited, at best.

    It’s not likely security concerns will slow down the rate at which applications are now being deployed in the cloud. Instead, the challenge is better understanding how to secure those applications using substantially different tools and processes than those used to secure applications within an on-premises IT environment.

  • 5 Testing Strategies For Deploying Microservices

    5 Testing Strategies For Deploying Microservices

    With rigorous development and pre-production testing, your microservices will perform as they should. However, microservices need to be continuously tested against actual end-user activity to adapt the application to changing preferences and requests. This article will cover five deployment strategies that will help developers and DevOps teams when releasing new features or making changes to microservices-based applications.

    Always Test in Production

    A staging environment is a necessary but insufficient step toward building a robust microservices infrastructure. Although indicative, it is not a substitute for evolving user traffic and behavior. When real users interact with the software during production, the services may not perform as efficiently.

    Users are unpredictable. They may make requests you have not accounted for when drawing up communication paths. Or your microservices architecture may not sustain the actual production traffic. When testing with real end-users, you are sure of your software’s performance and can improve it or add new functionality. 

    The disadvantage of working with real users is that they will be impacted by any errors. However, with specific deployment strategies, you can identify the issues and minimize their impact on those users. 

    Depending on your goals, you can implement the following testing strategies in the deployment stage. They can be performed individually or in various combinations, as each approach varies in its contribution to deployment.

    Blue-Green Deployment

    A blue-green deployment uses two distinct yet identical production environments. For example, you deploy an inactive version of your application in the blue environment. At the same time, the latest version available to end users runs in the green environment. Next, you push code to add new functionality to the blue environment. 

    At this stage, you test the services in the blue environment to ensure that they are running smoothly. You can automate this process by using basic smoke tests. When the microservices pass these tests, you can instruct the load balancer to gradually redirect user traffic to this new environment.

    If the new functionality poses no problems, the router moves all traffic from the green to blue environment, but can immediately revert traffic in case of any errors. 

    Due to the identical nature of both environments and their reliance on each other, there is little to no downtime. The end user’s experience is largely unaffected and the developers can move quickly to fix any bugs.

    The old environment serves as a backup, making it possible to execute a rollback without any downtime. After releasing the latest version, you can decide to kill the old instances, but only after you are confident that the new environment will continue running without errors. You can also clone both blue and green environments to repeat the process with other feature deployments in the future.

    Canary Deployment

    Canary deployment is similar to blue-green testing in that it protects against release-related risks.

    The phrase “canary deployment” originates from an old mining practice of placing caged birds in mine shafts to detect the presence of harmful gases. If present, the gases would kill the canary before affecting the miners, thus providing an early warning to vacate the mine immediately.

    A canary deployment works on a similar principle. Instead of creating two separate environments, a canary deployment operates within the same microservice or infrastructure. The developers roll out a new service or application version with changes only to a fraction of the end-users.

    You can quickly detect errors or vulnerabilities while using the new service. The impact is temporary and minimal as the experiment is only run on a subset of users with most remaining unaffected. Once they are working and have passed verification, you can scale up the changes. 

    The biggest challenge for those running canary deployments is the requirement to run multiple versions of the same microservices so that they can be deployed to a few users at a time. Implementing multiple versions also means you need to keep track of which users are on which versions to run accurate business metrics and analytics. Such monitoring can get increasingly complex with multiple canary deployments within the same application.

    Feature Flags

    A feature flag or feature toggle is a change or feature written inside conditional code. Developers can turn the feature on or off depending on their testing requirements while the application is running and in use.

    The code is already deployed and there are two code paths: One with the code that implements the feature and one without it. The developer only needs to choose one of the two paths. When the switch is toggled on, the code chunk is executed as part of the flow. When switched off, that code is skipped and the feature is not implemented. The rest of the source code continues to run as usual, independent of the feature flag’s condition, with no disturbances in the end user’s experience.

    Once integrated, a feature flag allows you to turn on a feature for a select group of users. Unlike a canary deployment where the selection is random, feature toggles are usually employed in specific cases. For example, developers do not create two separate applications to implement free and paid subscription tiers. Instead, operating a feature flag allows you to make a particular feature accessible only to subscription users.

    Feature flags are especially attractive during testing as developers can use them to run small experiments throughout the application without relinquishing control. Being able to flip the switch remotely also makes rollbacks easier. The risk is negligible as the application is self-sufficient in that it can continue to run without the feature. 

    Feature flags generate complex user-to-service paths by way of permutations and combinations. For a specific user, it is difficult to determine the exact route they took when using the services. Feature flags complicate this by allowing each user to have a different experience, ultimately making the application hard to debug. These toggles are easy to get started with minimal risks, but their maintenance can quickly become complex. It is best to use them only when needed and with other deployment strategies.

    Traffic Shadowing

    With traffic shadowing or mirroring, the router duplicates incoming traffic to an already-released service and gives the copy to another service. The request and response mechanism between the user and the existing service remains intact. On the other hand, the second service with a copy of the traffic contains new features that require testing. Consequently, it does not interfere with the existing process. Instead, the copy is used to test its functionality.

    Its most significant benefit is that it allows the new version to receive the same traffic that is currently being received by the service it seeks to replace. There is no need to create test data or worry about replicating scale. This accuracy comes with little risk, as there is no tangible impact on the existing services. Developers can run all relevant tests on this production environment, such as testing for errors and performance metrics. The new version’s responses, which are not sent to users, can also be compared to those of the production service. Both versions operate independently of each other with different end goals. This can happen in real-time or a copy can be saved and replayed for future testing.

    Traffic shadowing can be used with other deployment techniques like blue-green or canary deployments. After successfully shadowing a production environment, the changes can be rolled out gradually using a canary deployment to gain maximum confidence before a full release.

    Shadowing can have unintended consequences, though, so you should exercise caution when deploying this strategy with services that have third-party dependencies. 

    A/B Testing

    Unlike blue-green and canary deployments, A/B testing is focused on user perception and experience of new features. It measures if and how end users are interacting with these features, whether they are easy to notice and use and gauges the application’s overall functionality. It provides developer teams with business-level insight to improve their application as the features are ultimately implemented using code.

    A/B testing divides users into groups that access different features. Group A, for example, sees a different user interface than group B, although members in both groups are making the same requests to access the application. Traffic is routed to separate builds or different configurations on a common build. This is done by considering aspects like the users’ operating systems and user agents. It must be run on a sample that is representative of your end users. The test also needs to display statistically significant results to be valid.

    This test can be combined with blue-green or canary deployments as they handle the actual feature deployments that this strategy tests. After comparing the versions shown to the groups, the one that has performed better can be pushed to release for all users. 

    Building your Deployment Strategy

    Each strategy outlined can be used independently or together in a combination that best suits your goals, workflow and microservices requirements. They allow you to identify and reduce the impact of any vulnerabilities that may only surface at the final stage of your software’s release. Implementing them can be a somewhat complex process, especially with larger architectures and dependencies. But by implementing any of these strategies, your team will release the best possible version of your application. 

  • LogicMonitor Expands Reach and Scope of Observability Platform

    LogicMonitor Expands Reach and Scope of Observability Platform

    At its LM Elevate user conference, LogicMonitor today formally launched LM Envision, an observability platform that incorporates artificial intelligence (AI) to both discover and then remediate issues.

    LogicMonitor CEO Christina Kosmowski said LM Envision is the only observability platform available via a software-as-a-service (SaaS) model that can be applied to both on-premises and cloud applications. In total, there are already more than 2,000 integrations for the platform as part of the open LM Envision ecosystem, she noted.

    Over the last year, additional capabilities have been developed and added to the observability platform. These include application performance monitoring (APM) tools to identify bottlenecks and optimize performance, expanded support for public clouds and Kubernetes environments, integration with the StackStorm automation platform, integration with Terraform infrastructure-as-code tools and more advanced tools for searching logs.

    The company has also extended its AI operations tools to provide more context when troubleshooting issues by aggregating logs and including topology tools and graphs.

    Finally, LogicMonitor has added a push metrics application programming interface (API) to make it simpler to ingest data, pre-integrated dashboards and support for open source OpenTelemetry agent software.

    Kosmowski said it’s only a matter of time before observability and AIOps converge to the point where IT teams will finally be able to spend less time managing platforms. One of the major challenges IT teams face is that each platform they use requires its own framework to monitor and manage it. As observability and management frameworks converge, the overall overhead associated with managing modern IT environments should steadily decline as machine learning algorithms make it easier to surface issues before they create a major disruption, she noted.

    The overall goal is to close the loop between the discovery of an IT issue and its remediation, Kosmowski added.

    Observability, of course, is one of the core tenets of any set of DevOps best practices. Achieving it, however, has always been a challenge. The goal now is to eventually replace the hodgepodge of monitoring tools that track a limited set of pre-defined metrics with an observability platform that not only aggregates metrics but enables DevOps teams to launch queries and surface IT issues. In some instances, the rationalization of monitoring tools will help justify the acquisition of an observability platform. The paradox is that, as IT environments become more complex, it may actually become easier to manage those environments as more applications become instrumented and the various silos that isolate IT teams from one another start to collapse.

    In the meantime, there is no shortage of observability platform options. The primary difference between each of them is the degree of integration they provide and their ability to employ AIOps to automatically resolve issues, said Kosmowski. Each minute DevOps teams don’t spend on managing IT platforms is a minute that can be applied to spurring innovation, she added.

    One way or another, DevOps teams will soon have more access to information about their IT environments than ever. Less clear is how much of the data being collected by observability platforms will actually constitute actionable intelligence. But as observability continues to evolve, it’s now more a question of the degree to which that goal will be achieved versus if or when.

  • Catchpoint Enables Experimentation by Automating Web App Testing

    Catchpoint Enables Experimentation by Automating Web App Testing

    Catchpoint this week expanded its open source WebPageTest performance testing suite of tools to enable IT teams to run instant tests that surface suggestions for improving overall web application and site performance.

    In addition, Catchpoint is now providing support for private tests, bulk tests and priority testing capabilities within the WebPageTest tool suite.

    Tim Kadlec, director of engineering for WebPageTest, said the goal is to make it easier for both developers and DevOps teams to experiment with how changes to applications and websites could improve performance using a capability that has now been added to the core suite.

    Identifying opportunities to improve performance typically requires tediously constructing manual tests over a period of weeks, noted Kadlec. Much of that effort is experimental in the sense that no one knows for sure if the tests being constructed will have a material impact on performance.

    The Opportunities and Experiments capability provides teams with a low-code tool for building tests based on a set of best practices that Catchpoint has defined. That approach makes it simpler to automatically generate and test tweaks that, for example, eliminate blocking scripts, optimize image rendering and minimize layout shifts. The result is optimization tests that show how their applications and websites could benefit from specific, actionable improvements without having to change any of the code that has already been deployed, said Kadlec.

    That’s a critical capability because it will encourage a level of experimentation that previously IT teams shied away from, simply because the amount of effort required to achieve an uncertain outcome was too high.

    It’s not precisely clear who is conducting these types of tests, as more responsibility for testing applications continues to shift left toward developers. The latest additions to WebPageTest make it easier for developers to conduct those tests without necessarily requiring help from a DevOps team, noted Kadlec.

    While there has always been a tremendous amount of focus on web application and site performance, the attention level has risen across organizations in the digital business transformation era. Many of the processes being implemented via web applications are extremely latency-sensitive. As more of those applications become routinely tested, the overall level of application performance should steadily improve.

    At the same time, the number of web applications and websites that most organizations are supporting also continues to expand. Most of those organizations are looking for ways to test applications without necessarily having to expand the size of the testing team or significantly increase the amount of time spent on testing.

    Regardless of the approach, it is apparent that testing is becoming more automated. The goal is not so much to eliminate the need for dedicated testing teams, but reduce the number of rote tasks that contribute to test avoidance in the interest of saving time. In theory, the more tests run—and the earlier they are run—the fewer issues that DevOps teams will need to deal with later.

  • The Risks of Shadow Code

    The Risks of Shadow Code

    As the economy struggles to recover after the last two years of the COVID-19 pandemic, we have all learned a thing or two about supply chains—and what happens when they break down. But many people do not realize that modern websites also have digital supply chains, third-party ones that can be compromised in myriad ways. And just like the disruption of the physical supply chain affects things like pricing, availability and inventory, digital supply chains found on today’s websites play a big role in critical areas like site performance, customer experience and overall analytics. As a result, businesses today need to be aware of how the digital supply chain can introduce significant risk, especially when third parties do not adhere to their own set of stringent standards around security and compliance.

    According to a recent study by Source Defense, organizations that collect and use sensitive data—such as health care, finance, travel and online retailers—need to strengthen their focus on third-party risk management. As a result of mandates like GDPR and PCS DSS, these companies are now bound by compliance requirements to ensure their client-side threats are avoided and/or mitigated. This effort means recognizing more than just how to protect private data—it means understanding the properties of malicious code known as “shadow code” on modern websites and how it generates risk from dynamic and unpredictable scripts. Companies dealing in data today need to be aware of the different ways shadow code can affect their security, as well as the productivity and integrity of their DevOps teams.

    Third-Party Scripts and Shadow Code

    Shadow code refers to code that is baked into an application without proper vetting by the website’s IT department. This malicious code thrives in the cloud landscape, primarily because it allows for ease of deployment through CI/CD automation.

    When a web page calls in a third-party script, it loads directly into the browser from a remote server, which means general security controls such as firewalls and network monitoring tools are bypassed. And if one of these scripts has been compromised by a bad actor, shadow code can be embedded within. Sometimes these scripts include open source software that hasn’t been tested well—or at all. Other times, the code may be pulled from another layer of the organization where malicious code is hiding.

    Shadow code presents an array of threat opportunities, including the ability to mount an attack through digital supply chain partners. When these compromised scripts are used to steal data, redirect web traffic,or any other malicious activity, a clear path is essentially created into thousands of different websites, in almost every industry that collects data or deals in digital transactions. When a third-party script with shadow code enters a system, it gains the ability to:

    • Record keystrokes
    • Redirect visitors to malicious websites
    • Monitor clicks and track website activity
    • Change content on websites, including images and text
    • Steal credentials, such as personal logins and social security numbers

    As we know, these digital activities can lead to big consequences, like data breaches, fraud, theft, compliance violations, loss of reputation and hefty fines. Although code reviews can provide some software quality assurance, the process is not effective against shadow code, mostly because these scripts are constantly altered by third-parties. And when the threat is underestimated and unattended, these malicious scripts have the potential to permeate every area of a company’s web property.

    Because the benefits of using these types of third-party scripts are considerable, it can be hard to find a modern enterprise or agency that does not rely on at least a few to run web applications. In fact, many enterprises and government agencies today are running third-party scripts on every page of their sites. Even though these organizations are technically not responsible for this harmful code, regulators can (and do) hold web property owners accountable for any digital maleficence on their sites.

    DevOps Teams and Shadow Code

    Websites can provide rich experiences to visitors largely because developers use client-side JavaScript to improve the look and feel of these digital properties—all without the need for ongoing maintenance. Today, DevOps professionals can access vast libraries of these free and low-cost scripts from many different sources, such as allied coder groups, open source organizations, social media companies, web analytics firms, content delivery networks and more.

    But the reality is, code libraries accessed by DevOps teams are not always secure or trustworthy. Considering these packages often contain code from fourth and fifth parties, DevOps folks face the unavoidable possibility of tainted code—hard to identify and dangerous to use. In fact, the Source Defense report revealed that one in four scripts represented fourth- or fifth-party code, on average. Because developers tend to focus on keeping their code updated and as capable as possible, they often pull from the dynamic library from their repository. If there is a CI/CD process happening, DevOps teams will pull their library from that point. This is where shadow code introduces new vulnerabilities for developers.

    Shadow code also jeopardizes the integrity of DevOps work. Most developers take pride in what they do and are not interested in creating unsecure or low-quality code—not purposefully, anyway. And given that speed, productivity and constant innovation are all business goals for DevOps teams, it’s important to recognize how problematic shadow code can be for those in the business of building secure and high-quality software.

  • 3xFAIL: IPv6 Fails | Fintech Fails | Firefox Fails

    3xFAIL: IPv6 Fails | Fintech Fails | Firefox Fails

    Welcome to The Long View—where we peruse the news of the week and strip it to the essentials. Let’s work out what really matters.

    This week: IPv6 gets stabbed in the back, Fintech firms’ valuations are falling, and the latest browser war seems to be over—Firefox lost. (more…)

  • Three Common Testing Mistakes – And Solutions

    Three Common Testing Mistakes – And Solutions

    A few weeks ago at SauceCon, DevOps.com talked to Matt Wyman, chief customer officer at SauceLabs. This year’s theme, Reimagine Test, emphasized the need to prioritize the user experience in testing. As Wyman put it, “We really focused on that customer experience, using the right type of test tool at the right moment.” After the conference, we caught up with him to talk more about a critical point—that many teams don’t know how to test for user experience because that hasn’t been in their wheelhouse.

    Wyman provided advice on three typical testing mistakes and how developers can improve the accuracy and breadth of their testing environment.

    1. Bloated Testing Suites

    Here’s a common scenario: Flaky tests get slipped into large test suites and developers ignore them instead of correcting or removing them. The suite gets increasingly bloated as people add more and more tests, which can obscure their results. “From the outside, it’s hard to tell which tests are the most critical when you’re making a change to pass,” Wyman said.

    He explained that if two people are working on the same part of the codebase and person A sets up a focused series of tests, person B can make a change and be sure it will work when those tests pass. But that’s no longer the case with a testing suite stuffed with irrelevant tests.

    “If instead, I create a two-hour suite with thousands of tests in it, you won’t know which one is most applicable to the change you’re making,” Wyman pointed out. “This is one of the more significant complications when people are less knowledgeable about building a good test suite or test practice.”

    2. Using a Single Tool Like a Hammer

    Wyman emphasized the need to use the right testing tools at the right time for the right purpose—something many developers don’t do. In this common mistake scenario, he said, the developer takes a functional user interface testing framework and uses it to validate their integrations, their APIs, their visual results and everything else.

    “It’s a classic case where you have a hammer and everything looks like a nail,” he said. “It makes your overall testing practice very heavy and very long. Typically, if you’re not using the right tool for the right purpose, it takes a lot of effort to maintain it.”

    3. User blind spots

    You don’t know what you don’t know—or, as Wyman put it, “the experience error is hard to find and even harder to discover.”

    Wyman discussed a hypothetical scenario in which engineers build and test a system that accepts only numeric inputs. Testing runs perfectly—because the engineers test only the entry of numbers. The fix here is fuzz testing: Thinking beyond simple use cases and introducing a “what if” quotient by testing random and unforeseen inputs, such as users who enter letters. Building this foresight into the programming language itself can involve developers in the quality assurance process much earlier and avoid mistakes down the line.

    He also stressed the need for observability in testing, with instrumentation that can help teams predict where users might run into limitations. “Developers have to look at the user analytics and usage analytics, not just system analytics,” he said. “Quite often the user analytics and observability the product manager is looking at, they see from the outside—and that’s useful data for the developer, so they can see those failure cases early.”

    Transcending Testing Limitations

    Is there such a thing as a flawless test environment? Probably not. But by sidestepping the three mistakes above, developers can transcend ingrained testing paradigms and elevate both quality and experience.

  • Broadcom’s Software Strategy: Milk the Cash Cow, Exploit ‘Synergies’

    Broadcom’s Software Strategy: Milk the Cash Cow, Exploit ‘Synergies’

    The week began with rumors that Broadcom would acquire VMware and ended with the news that the deal is all but done. The VMware board, along with Michael Dell (who still owns about 41% of VMware’s stock), have a 40-day “go-shop” option; however, I don’t believe there will be other suitors.

    On Tuesday, I published an article about Broadcom’s desperation to gain cloud relevance and transform itself into a software company. I detailed the fact that VMware’s profitable business model and its nearly $4 billion of free cash flow makes it an attractive acquisition target. Finally, I said that Broadcom needed to find innovative DNA to make this acquisition work. 

    After thinking further about this proposed acquisition and talking to a number of VMware customers, as well as customers of CA Technology, which was acquired by Broadcom in July 2018, my outlook on the acquisition has become decidedly more cynical and likely more realistic.

    Milk Profits, Minimize Expenses

    We have seen this scenario play out before. Several former CA Technology customers and employees I spoke to was quick to say, “CA—where software goes to die.” That phrase has become so synonymous with CA that even the Wikipedia page for the company has a section on the phrase! Joking aside, most CA customers I spoke with over the last week agreed that since their acquisition, the company has “gone dark.” CA Technologies was a profitable company with important software that enterprise clients relied on and couldn’t easily transition away from. Sound familiar? VMware is in the exact same spot.

    Soon after the CA acquisition, Broadcom slashed about 40% of the CA workforce. On an analyst call to discuss the acquisition, Tom Krause, president, Broadcom Software Group (the Software Group will be renamed VMware) said that the company will increase VMware earnings from $4.7 billion to $8.5 billion within the next three years. How will the company nearly double earnings? “Synergies,” of course. The drivers of growth will be savings generated by eliminating duplicate functions in the combined company along with projections of more workloads running on the VMware platform.

    Do I expect Broadcom to change its corporate DNA to become an innovator? Will VMware innovators change Broadcom? Based on Broadcom’s past behavior, sadly, I think the answer is clear—No.

    I expect VMware to quickly cut costs across the board. Everything from headcount to R&D will see an immediate slash.

    This is Not Dell 2.0 For VMware

    You might argue that VMware has gone through this before when they were acquired by Dell and later set free by Dell Technologies in a 2021 spinoff. Why is this acquisition different? The Dell deal was, at its core, financial maneuvering to finance a deal and enrich investors with the goal of selling or taking the businesses public at a much higher market valuation. There was little cross-pollination between the Dell Technologies companies, and in this deal, Dell acted more like a private equity firm than an acquiring company.

    Broadcom is different. VMware is going to be milked as a cash cow as Broadcom tries to leverage VMware’s importance in the data center. VMware has huge cloud computing customers (AWS, for one) that are reliant on the company’s technology. If you are a VMware customer, get ready for higher prices as the company shifts to more of a subscription model. I also suspect that we will see large layoffs and the diminution of VMware as an entity. This is the end—VMware is not going to have another opportunity to go public on its own or go private in the future.

    I also don’t expect huge technology advancements from VMware over the next decade; but the company won’t die. The company will continue to exist because of the mere fact that enterprise software never dies.

    What Should Partners and Customers Do?

    This isn’t the end of technology acquisitions; nor is it a one-off event. Within the current market conditions, software vendor valuations have come crashing down to a more realistic level. I suspect that many large businesses with cash on hand will be looking to buy profitable software businesses that are viewed as essential. So, what should technology and business leaders do?

    • Understand vendor roadmaps and business. If you choose to go with an independent vendor, especially a smaller company, you need to understand their product roadmap along with their overall business strategy. 
    • Don’t become overly reliant on a single vendor. This isn’t the first time VMware has forced customers to rethink their relationship with the company. Years ago, VMware attempted to drastically increase licensing costs. Customers revolted and the company reversed course; however, it was a wake-up call and many businesses began to look at alternatives like OpenStack. You also need to ask technology leaders within your business what happens if a vendor changes their pricing, becomes a competitor or goes out of business. These “what if” scenarios are critical to reducing your risk.
    • Explore open source options. Open source isn’t a cure-all, but many businesses have adopted open source in part to reduce the risk of vendors changing strategies, increasing prices or no longer supporting your software. With open source technology, even if a project’s community is no longer active, a business that uses the technology can continue to contribute code and maintain the project.