Category: Blogs

  • SolarWinds Unveils Revamped APM Platform

    SolarWinds Unveils Revamped APM Platform

    SolarWinds is unifying its various application performance management (APM) tools within a single suite accessed via a software-as-a-service (SaaS) platform.

    Denny LeCompte, senior vice president for products at SolarWinds, said the APM Integrated Experience offering combines the company’s AppOptics, Loggly and Pingdom tools to collect metrics, traces and logs along with real user monitoring capabilities and tools to simulate application traffic.

    APM Integrated Experience also provides access to a landing page that identifies what has changed in an IT environment over the previous week and highlights which of those changes might become an issue. As most IT professionals well understand, most IT issues can be traced directly back to a recent change made to an IT environment that was previously running as intended.

    Other capabilities include advanced search tools and the ability to inspect lists and maps for hosts, containers and plugins for web servers and databases. In addition, APM Integrated Experience is integrated with both Amazon Web Services (AWS) and the Microsoft Azure cloud.

    LeCompte said the goal is to make it less expensive for the average IT organization to broadly instrument applications using an agent developed by SolarWinds that can automatically be installed.

    Ultimately, the goal is to enable organizations to better manage their software supply chains, LeCompte added. Of course, SolarWinds is at the heart of the software supply chain breach that involved its Orion network management software. That software runs on-premises. In comparison, APM Integrated Experience is a SaaS platform that is more secure. In fact, LeCompte said, IT professionals that manage software supply chains are generally sympathetic to the challenge the company currently faces. Most of those organizations have dealt with similar software supply chain issues, albeit on a smaller scale, LeCompte added.

    In general, LeCompte said it’s apparent most organizations need access to an APM platform that costs substantially less than rival platforms and still delivers 90% of the capabilities they require. In many cases, IT organizations are paying for extra capabilities that only very high-end enterprises require, LeCompte noted. In fact, one of the primary reasons APM platforms are not as widely employed is most organizations have found rival APM platforms simply too expensive to deploy, said LeCompte.

    LeCompte declined to speculate whether there is a meaningful difference between what has been historically known as monitoring and so-called observability platforms that have emerged in recent months. Regardless of approach, however, it’s clear as distributed IT environments become more diverse and complex, the number of organizations that need more visibility into their application environment is steadily increasing, said LeCompte.

    Of course, with the rise of microservices-based applications, that level of IT complexity is only going to increase. As applications grow and expand, the number of dependencies between microservices starts to increase. Understanding how an issue with one microservice is impacting a distributed computing environment will undoubtedly require more instrumentation. The challenge, going forward, will be determining how best to achieve that goal at a reasonable cost.

  • 2021 Site Reliability Engineering (SRE) Survey Now Open

    DevOps Institute, in partnership with Catchpoint and VMware Tanzu, encourages IT professionals to share their insights into SRE teams, metrics and automation in 2021

    BOCA RATON, Fla. – Feb. 25, 2021 – DevOps Institute, a global professional member association for advancing the human elements of DevOps, today announced the launch of the 2021 SRE Survey. DevOps Institute, Catchpoint and VMware Tanzu have collaborated to offer the 2021 survey. The survey will result in a more in-depth understanding of how SRE teams are organized, how they are measured, and a deep dive into specific automation needs within SRE teams.

    Take the 2021 SRE Survey here: http://bit.ly/3dKh22E

    “This year is critical for collecting data on the state of SRE after an unforeseeable 2020,” said Eveline Oehrlich, Chief Research Officer at DevOps Institute. “The survey takes a deep dive into the practices, organizational dynamics and critical changes to the SRE role over the last year. This data will be essential to building a report to help SRE teams gather a baseline and continue to advance the enterprise SRE role in 2021 and beyond.”

    The goal of the report is to offer practical details to continuously update the roadmap for adopting and expanding SRE success. The survey will focus on collecting data around:

    ●     Organizational structures, topology, and team composition.

    ●     Where the responsibility of SRE lies and what has changed since last year.

    ●     Specific practices that lead to improved automation work.

    ●     Key automation topics which are essential for SRE work.

    “The survey is essential to gathering extensive data from the industry—which will allow us to take an intensive look at the overall state of SRE,” said Leo Vasiliou, former IT Ops practitioner and current Director of Product Marketing at Catchpoint. “We are excited about the partnership with DevOps Institute and VMWare Tanzu to learn the state of SRE in 2021. The survey results will help the SRE community better understand the challenges ahead and ensure they will find success in 2021.”

    The 2021 SRE Survey is open now and will close on April 1, 2021. Additionally, for every survey taken, Catchpoint is donating $5 to Devices for Students, which helps to ensure all students have access to digital learning opportunities. Take the survey now.

    About Catchpoint

    Catchpoint, the global leader in Digital Experience Monitoring (DEM), empowers business and IT leaders to protect and advance the experiences of their customers and employees. In a digital economy, enabled by the cloud, SaaS and IoT, applications and users are everywhere. Catchpoint offers the largest and most geographically distributed monitoring network in the industry – it’s the only DEM platform that can scale and support today’s customer and employee location diversity and application distribution. It helps enterprises proactively detect, identify and validate user and application reachability, availability, performance and reliability across an increasingly complex digital delivery chain. Industry leaders like Google, L’Oréal, Verizon, Oracle, LinkedIn, Honeywell and Priceline trust Catchpoint’s out-of-the box monitoring platform to proactively detect, repair and optimize customer and employee experiences. Learn more at www.catchpoint.com

    About the DevOps Institute
    DevOps Institute is a professional member association whose mission is to advance the human elements of DevOps.

    We create a safe and interactive ecosystem where members can network, gain knowledge, grow their careers, lead and initiate, and celebrate professional achievements.

    We inspire thought leadership and knowledge by connecting and enabling the global member community to drive human transformation in the digital age.

  • Application Security and Continuous Observability with DeepFactor

    Application Security and Continuous Observability with DeepFactor

    Today’s modern applications are becoming increasingly complex and released more frequently than ever before, therefore increasing security, privacy and compliance risks. How do you identify the security and compliance risks hidden in your application before you deploy it to production?

    Continuous observability enables DevSecOps teams to observe millions of application telemetry events and find runtime security, compliance and privacy risks within the DevOps pipeline, while providing AppSec teams the ability to set guardrails and have continuous visibility with every build.

    In this TechStrong TV interview with DeepFactor Founder and CEO Kiran Kamity, we discuss the concept of observability and how to apply it for security and compliance. We also talk about the increasingly important role of AppSec and DeepFactor’s new Observability-as-Code API, which enables DevSecOps engineers to leverage observability functionality in their CI pipeline and gate builds.

    The video of the conversation is below, followed by the transcript. Enjoy!

    Transcript

    Mitch Ashley: I have the pleasure of being joined by Kiran Kamity, who is founder and CEO with DeepFactor. Welcome, Kiran.

    Kiran Kamity: Thank you, Mitch.

    Ashley: Great to have you. We’re gonna be talking about observability, super-hot topic, but before we get there, tell us a little bit about yourself, a little bit about your background, and then a little bit about DeepFactor.

    Kamity: Awesome, yeah. I came to the Bay Area about 20 years ago. I did my undergrad at the Indian Institute of Technology in India in Chennai, and then I came here to Stanford for my grad program. Once I came to the Bay Area, you get addicted to the entrepreneurial spirit, you never leave, this becomes your home. Happened to most people—happened to me as well.

    So, the Bay Area is my home, and I’ve had a mix of enterprise and infrastructure cloud computing, virtualization, and DevOps/AppSec kind of background over the last 20 years. I’ve done two companies as a Founder, which were acquired by other companies like Citrix and Cisco. My first company, RingCube Technologies, was acquired by Citrix. We built a container run time for the Windows Operating System before the Docker days. This was acquired by Citrix in 2011, so I was responsible for some of the product teams at Citrix after the acquisition.

    Then the bug bit me again, and I started ContainerX, which was a turnkey containers in a box type company, which was acquired by Cisco, and it’s now called Cisco Container Platform. While at Cisco, I was Head of Product for the Cisco Cloud Business Unit, which included container—container networking, OpenStack, and some of the other initiatives that they had.

    During that time, as I was looking at what to do next and analyzing the market, a lot of the learnings came to the following. There’s a lot of momentum that has happened so far in cloud native architectures, DevOps, et cetera. And the learnings were that the next wave of innovation is going to be as DevOps becomes DevSecOps. And that’s why I started DeepFactor, and we believe that the next wave of innovation in the world of DevSecOps is observability.

    Ashley: That’s something I both relate to and also am just fascinated by other entrepreneurs is that story of, you’re working on what you’re doing now and you’re still kinda looking at, “Well, what’s the next thing coming up, and what might I go do next?” and then you go off and solve the next problem.

    Kamity: Yeah, absolutely.

    Ashley: Start another company to do that—like you said, you get the bug, it’s kind of a fever. [Laughter] It definitely is.

    Well, cool. We’re talking about observability, and it does seem to be the hot topic of kinda late 2020, early 2021. So, let’s first start with kinda how did we get there—get here? How did we get to this place where suddenly observability is a thing and not only a thing, but important to a lot of people?

    Kamity: Yeah. Just to qualify it a little bit, our focus at DeepFactor is applying the concepts of observability for security and compliance, which is truly novel, and there’s very few companies that are trying to do that.

    Ashley: True. Observability can mean just sort of the next elevated monitoring, right?

    Kamity: Exactly.

    Ashley: So, you’re [Crosstalk] around security.

    Kamity: So far, a lot of the observability plays have been in the logs metrics tracing. Applying the concepts of observability, truly as the next generation of evolution of APM. But at DeepFactor, we’re leveraging the concepts of observability for identifying security and compliance risks in your applications before they go to production.

    So, to answer your question about how did we get here, let’s take a step back and analyze what has happened over the last few years, with respect to application development, right? Apps have become a lot more complex than they have ever been today. I mean, think about it—a common application is made of a bunch of different languages. You have a Java service, you have a Node.js service, and you have Angular in the front end, you have lots of different pieces, you have a database, et cetera.

    You have a lot of third parties—third party libraries that are baked into your services, third party components that are not built by you such as Nginx and MySQL and MongoDB, et cetera, that become part of your application.

    Ashley: A lot of open source, right, in that stack.

    Kamity: A lot of open source. Applications are now also being deployed in a bunch of different ways. You have applications that are not containerized, still mainstream. You have containerized applications, you have full on Kubernetes applications, and you have land applications as well, so the deployment of applications has become complex as well.

    So, in this world of applications becoming a lot more complex than they’ve been, what essentially happened from a security perspective is that the attack surface area of your application has significantly increased. It is the highest it’s ever been so are, and it’s only gonna go that way.

    Let’s take a look at a few other trends that have bene happening in industry. The velocity of releases—that has gone up as well due to DevOps. You’re no longer building or releasing an application once at three months, once at six months. You’re releasing that multiple times a week with DevOps, and different companies are different aspects of that spectrum, there.

    Now, when things are more complex and they’re being released at such a rapid pace, there is no way humanly possible for your AppSec teams to find all of the security risks and compliance risks that lie in your application before they deploy to production. At the same time, the risk of these issues being in production is higher than it’s ever been. If you think about it, the sophistication of the bad actors has increased significantly as well over the last few years, and therefore, the nature of the breaches, the size of the breaches, and the damage that they can cause has increased as well. Coupled with that, privacy concerns have increased, resulting in standards like GDPR and CCPA and all of those things emerging as well.

    Now, in such a landscape, you’ve got to automate identifying the security and compliance risks that are hidden in your application before you deploy your application to production. And that is where the current tools of just code scanning or identifying issues based on signatures or just DAST scanning your application, et cetera, don’t cut it. You need something that watches your application while the application is actually running in both pre-production environments as well as in a canary deployment of minimal production deployment before you release it to your broader production deployment.

    And in that environment, you’ve got to be able to watch the millions of events that are happening inside your application, take that data, analyze and find the needles in the haystack, and therefore determine where the security and compliance risks are and pass on all of this information with rich evidence such as stack traces, metrics, and whatever it takes to fix these issues back to the developers. And a lot of this has to happen in a seamless manner that is nicely tied into your DevOps kinda pipeline, and that’s where observability applied to security and compliance comes in, and that’s exactly what we call continuous observability at DeepFactor.

    Ashley: Interesting. I know, talking with you previously and kinda hearing about DeepFactor, you all talk about start left, not shift left—this idea that, really, it starts from the beginning, not, “Let’s kinda push it as far left as we can.”

    Kamity: Yeah, absolutely. If you think about it, we’ve had operator specific tools emerged in the last five years with respect to security. So, you’ve had container security tools that identify issues in your Kubernetes configuration or your Docker configuration or vulnerability scanners that identify issues in your host operating system if you’re deploying your app in a VM.

    Now, those are all the types of insights. Are there any misconfigurations that could lead to security issues that are very relevant for the Ops people? And those tools are coming up with the idea of shifting left, because you need to find these configuration issues before you go to production so that the Ops people can deploy these applications properly.

    But when it comes to developers, their agenda is not securely deploy your application. They don’t care, honestly, about how you’re Docker or Kubernetes is configured, for the most part. They care about what is in their application, securing at the source. And when the agenda for Dev teams is to secure at the source, then all you care about is—what is my application doing, whether it’s my application or some third party that I brought in, or just my interpreter itself when it is running? And can I identify the risks involved and understand my attack surface within the application ahead of time? And that’s why we call it start left.

    So, we think that operators care about shifting left. Developers should truly care about starting left.

    Ashley: Yeah, it’s interesting, because your point about code scanning and DAST approaches to security is, from a code standpoint, you do wanna be writing a secure code, so it’s a valid thing, of course, to be doing. But you mentioned Lambda, you mentioned, of course, infrastructure as code, essentially, where all this is dynamic, right, in our environments today, and more so, not less, every day, right?

    Kamity: Yes.

    Ashley: Every day, it gets to be more dynamic. Now, you’re really talking about the whole context of the environment with the application. Kind of, if you thought about it in the network, you’d say all seven layers, right? If you think about it in the security stack of software, it’s application plus all of the other things, right?

    Kamity: Yes.

    Ashley: It’s interesting what—how do you find people are accepting this idea of run time information being provided with context, you know, this rich information you were talking about, is that something new to developers or like, “Oh, my gosh, I’ve been waiting for this forever” or, “Well, this is really cool. Look at—let me see what I can do with it”? What’s more the experience that developers have?

    Kamity: Yeah, so, I think different organizations react differently to something like this. The old way of thinking is—oh, developers don’t care about security or compliance.

    Ashley: I’ve never met a develop that wants to write insecure code or unsecure code. [Laughter]

    Kamity: Exactly, right? That is exactly what’s happening now where, given the consequences of shipping insecure applications and given the need to be more and more secure at the source, I think developers—and just simply because it’s just not humanly possible for your AppSec teams to identify all these things. Given the talent shortage of the AppSec skill set as well, it is, the responsibility if identifying these risks has to be borne by the developers. Because at the end of the day, the developers are the ones that are writing the code and you’ve got to make sure that you’ve shipped secure code.

    Engineering leadership and AppSec teams in various organizations that we’ve been working with have been fully accepted. In fact, they’re fully aware. In fact, a lot of them want this kind of concept, it’s just the lack of tooling today. Because if you think about the current tools that are available, they’re doing the best they can with the existing set of tools.

    I mean, they’re scanning the code, they’re trying to scan the application from time to time—but those tools don’t lend themselves well, nicely into seamless integration into your CI pipeline, and therefore, giving developers the insight about, “Hey, here’s where we saw your application did this.” That can only happen with observability tools like what we’re building, because we watch every thread of every process of every service in your application when it is running in test and even canary deployment in your part of production before you deploy that thing widely to a larger section of production. And that is the kind of insight developers do care about.

    What we have gotten repeated feedback as we have been building this product with a few development partner type enterprises so far is that, the insights that we have needs to be enriched with richer evidence information so that developers can actually take that evidence information and directly go fix the problem. So, we’ve augmented our insights with stack traces wherever appropriate. You know, obviously, the good old things like CVE numbers and things like that, we have that.

    But what we focus more on is not just giving you a list of CVEs, but complementing the insights that your software composition tools give you by giving you run time usage information of that CVE. For example, we can tell you if a tool like Snyk will tell you there are 250 vulnerabilities in your application, DeepFactor will tell you, “Hey, there are 250 vulnerabilities according to what Snyk is telling you. Fifteen of those things have been used by your application at this time, when your application was executing here, ad here is the function, here is the call stack.”

    So, that will make it easy for a developer to go, “Okay, now I don’t have to get overwhelmed with fixing all of the 250 things or adding that to my backlog, I can actually prioritize which ones to fix first, because that’s what my application is actually doing.” It’s not about the whole thing that has been checked into your source code, it is what your application’s actually doing that will help you catch the more important things. It’ll help you also reduce the number of alerts that can inundate you.

    Now, with all of these changes, the rich evidence, reducing the number of alerts, and to the point, alerts based on what your app is actually doing, developers are finding it more and more meaningful, our insights. And as we grow the company, that’s gonna be our primary focus.

    Ashley: That’s always been the challenge with vulnerability scanners and code scanners is, yes, I get all of those results. What of those are real? Yes, they’re all theoretically possible. I may not be using it in a way that actually exposes me to that CVE, that vulnerability.

    But what you’re saying is, you’ve actually detected the use in the application or the software stack of something around that CVE that’s worth looking at. Hopefully, you’re cutting down on the number of things that are actually, they go look at. You can ignore the rest, if you will, or at least know that they’re much less likely to be an issue.

    Kamity: Yeah. We do not give you too many alerts. We give you the alerts that are relevant for your application because we watch the millions of events that are happening in your application in every part of your application, across various layers of the stack—like, system caller interface, library calls that your application has made, network behavior, web and API, all of that.

    And based on that data, we treat it as a data problem. So, we take that data and then we try to identify anomalies and detect that these are the risks that lie in your application from a security perspective, and this is how it maps into compliance. So, we will tell you that these are the security risks in your application and in our next module of the product, we’re gonna tell you that this can hurt your PCIDSS, and here’s the number, basically.

    Ashley: Mm-hmm. It definitely is gonna improve your relationship with the security and compliance team, right? If you’re solving these problems before it gets to them, they have to ask, “Well, did you do anything about this? Are we susceptible?”

    Kamity: Yeah.

    Ashley: Talk a little bit about—so, where in the tool chain and the workflow pipeline, where do you fit? Where does DeepFactor play?

    Kamity: Yeah. The best way to think of us is, if you take a step back, if you are thinking about your DevSecOps initiative in total, you want to plug in into a bunch of different points from a security perspective into your CI pipeline. Your developers write code. The next step should be you try to find risks in your code. That’s where the SaaS tools come in, they find the risks that are there in your code.

    Then you create your build artifacts—let’s say, your executables, your container images, and whatnot. Then you try to find risks that lie in your build artifacts. That includes your code, any third parties that you’ve compiled together and created your services. It’s still static, though. You’re not running them yet. Tools that allow you to identify risks in your build artifacts could be container scanning tools, like image scanning tools that scan your container images and find issues or software composition analysis tools like Snyk and Black Dock and tools like that. These tools find vulnerabilities that exist in your components after they’ve been built.

    Then you run your application, you’re testing your application. Either you’re testing it in a test environment or you’ve deployed and you’re testing it in a minimal configuration of your—like, a canary deployment in your production. During that time, you’ve flicked DeepFactor on. DeepFactor doesn’t require any changes to the code of your application; you’re simply running your application.

    And that’s where we’ve built a significant amount of IP. You know, my Co-founder, Mike Larkin, he’s the CTO, he’s the father of the OpenBSD hypervisor. And our senior engineering leadership members came from Qualys and FireEye, having been in the area for 20 plus years working on security products, each.

    So, we’ve created something that involves zero touch, pretty much. You don’t have to touch your application at all, you simply run a command called DFCTL, just like KubeCTL, we came up with DFCTL. So, you do DFCTL, run your app; or DCFTL, run your container; or you drop it into Kubernetes. We have a webhook admission controller that you simply drop into Kubernetes, and then any pod that you want to be monitored, you simply can specify a config file and that pod gets monitored automatically with DeepFactor.

    Now, the way DeepFactor inserts itself is completely behind the scenes. It’s language agnostic. You don’t have to worry about, is it Java, is it Node.js—DeepFactor figures out that it’s Java or Node.js and does some specific things and finds out more information.

    So, you simply run this, your application is running in your test environment or your minimal production environment, DeepFactor observes everything that it’s doing. When the tests are done, it tells you—you throw your automated tests at it while your application is running, just like normal. And then when it’s done, DeepFactor gives you all of that information about what insights have been found and what’s the evidence information that’s pointing to the insight. Is the issue or the risk presenting the attack factor lying in the code that you wrote? Is it lying in a third party that you brought in, or is it at the interpreter level itself? All of them are risks as far as the attacker is concerned that could be exploited, so you need to be aware of where your risks are.

    Ashley: Now, are developers putting in some library calls or DeepFactor code into their application stack as well, then? Is that how you’re getting into the software, knowing what’s happening inside as well as outside?

    Kamity: Actually, that’s the beauty of our IP, and we’ve filed a few patents in that area. Developers do not need to write any code to change, or change anything in their application. You simply enter DFCTL and run your app and DeepFactor inserts itself into the application at your run time, completely seamless to the developer, and when it’s done, it unplugs itself and your application and gives you all the insights.

    Ashley: Wow. That sounds pretty cool. I can imagine that’s a big plus for developers. [Laughter] Yet something ls they don’t have to debug, right?

    Kamity: Exactly, yeah. That’s the significant part of our IP.

    Ashley: You know, it’s interesting you mentioned your team comes from a number of other security companies that have been around for a while—you know, you mentioned Qualys and others starting in the scanning, the vulnerability management space some time ago; that’s about when I got into security, too.

    What do you think we’ve learned from those types of companies and those experiences that we’ve sort of changed our perspective about where we are today, just given—yes, we have much more complexity in software, much more porous security issues, but what have we learned from all of that security scanning that’s helping us?

    Kamity: Yeah, no, I think there have been numerous, numerous learnings, and the learnings have evolved over time as the landscape of application development has changed as well. You know, you’ve had tools in the past that were designed based on the applications of the past. But tools of today and tools of tomorrow are different, because the applications of today or the applications of tomorrow are definitely trending in a different direction.

    One example of the thought process itself is that, you know, when things are in single digits or a lesser number, it’s okay to have manual scanning, manual testing, once in a while test it and then find information, which is kinda the old kind of scan once in a while, identify it, or bring in a pen tester once in three months, you know, check some boxes and get it done kind of thing.

    Those are all great and they’re still relevant even now. What has become even more important is why you do those once in a while scans and checks. You’ve got to make sure that you get in the habit of securing at the source. You can no longer imagine that your infrastructure or the perimeter is gonna secure your application properly. You’ve got to make sure that you build your application securely to start. And that fundamentally has changed the kind of tools that we need to build in order to equip the developers who build applications to secure at the source.

    At the same time, I think the role of AppSec has become even more important than it has ever been. Because, you know, sometimes I keep getting asked, “Oh, are you saying that developers should use these security tools? That means the AppSec teams are no longer relevant?” That is totally wrong, because AppSec teams, their job is increasingly more relevant. Because if you take a step back and you look at the number of attack vectors that are there in your application, we just talked about how your pipeline should be architected—secure at the source, making sure that you scan your code, scan your builds, test your running applications, and identify risks in all of these areas—who ties them together? Who comes up with this overall strategy? Who comes up with that triaging process and passing the evidence back to the developers, identifying which ones are important and which ones are not?

    All of that should come from the AppSec person in the team—AppSec or if AppSec is assimilated into your DevOps and we call it the DevSecOps person, that’s the role of this person is to make sure that he or she is the shepherd of your CI pipeline from a continuous security perspective and then feeds all of that information back to the relevant parties. Some of that could be your developers, some of that could be to your engineering leadership, and some of that could be to your security leadership.

    Ashley: Mm-hmm.

    Kamity: That is how I see the organizations of tomorrow shaping up, learning from what has happened over the last 15 years to 20 years of innovation in this area.

    Ashley: I think that makes a lot of sense. Otherwise, (a) we’re just throwing tools at it, everybody’s doing whatever and who knows whether that’s helping us improve and improve security. And you mentioned the data coming out of it, right? That can also be used for continuous improvement, continuous learning, what are trends that are happening in our application?

    Suddenly we’re seeing much more of this technique or this architecture or this environment being deployed that, you know, not always do the security people have exposure to that early on in the process. So, it’s a good way just to know what the heck is goin’ on and then also, you have an idea about how all of your security tools, developer or non-developer, fit into an architecture that makes sense.

    Kamity: Yeah, exactly. I mean, imagine flipping a switch and identifying, “okay, these are all the touch points that my application has and these are the millions of things that it’s doing” and condensed very well to, “these are the red dots in that whole story, and this is where your risks lie.” That’s powerful, and I think it’s the AppSec person’s job to set all of that up and make sure that a framework is created and then say, any time something that comes up, you know, make sur that you pass it on to the developer with the appropriate evidence and work with the engineering team to decide.

    Because when you have so many different services and so many different languages, the AppSec people, especially because they’re already short staffed, cannot possibly know everything about the business logic of the application, resulting in those decisions that could have been made to bring in component X and component Y and whatnot.

    Ashley: Mm-hmm. You know, Kiran, one of the things that I’ve said over time is that security people need to get a greater understanding of software architecture. They don’t need to have to be developers, right, that’s not what their skill set is, nor necessary their desire. But you can’t treat security as this hard outer shell, you know, we just keep making it smaller and smaller. And now all you’ve got is thousands or hundreds of thousands of small outer shells and now you’re not securing anything, any more.

    It seems like the AppSec team can play a really important part of helping bridge that gap of what are we doing specifically, what are the architectures that we’re using, what might be some of the security risks that maybe a security engineer is just not fully up to speed on or trying to keep up to speed on as it’s changing?

    Kamity: Yeah, absolutely. Imagine the power of flipping the observability switch and the AppSec person going and saying, “Hey, Dev team, we noticed that in this particular piece of your code, you’re using an API that has been deprecated by the operating system” or, “In this particular piece of code, you’re invoking memory improperly, because this tool is showing me exactly what was done when this particular area of memory was allocated with the wrong permissions. Or, “This is an area of code where your interpreter is doing something wrong. Is it possible for us to go change the version of the interpreter that we’re using, maybe upgrade it to the latest version or put a patch?” Or, “Do we need to, in order to mitigate this thing, assuming that there’s no fix in the interpreter, do we need to go put something in our WA in our infrastructure to block the particular attack from happening?” Or, “Should we report this problem upstream to Java itself, the Java community itself, so they can go fix the problem in there?”

    So, lots of different things that could be done once the AppSec team is empowered with this much rich information about what’s happening in the application.

    Ashley: You know, something I don’t know that we talked enough about, we talked about how rapidly and how quickly we’re delivering software applications now. The environment of the software, the API calls we’re using, the libraries, the services, interpreters—all of that is changing in parallel very quickly. Sometimes you don’t feel like you have time to keep up with it, or that’s all you do is spend your time keeping up with that, not kinda delivering business value.

    I think folks that are maybe not involved too deeply in the software creation process really realize not only the complexity but how much change there is to deal with. There’s a lot that goes into that. We talk about technical debt or backlog or whatever—it’s a lot more than that, there’s much more to it. [Laughter]

    Kamity: Absolutely, there’s a lot more than that, and I think having an informed security team as well as, you know, coupled with a structure and the right tools baked into your pipeline, which results in informed Dev team, can result in goodness overall. You’ll end up identifying security and compliance risks earlier in your Dev cycle. You’ll end up fixing those things earlier, and therefore, you will end up shipping a much more secure application, and it’s a cycle. Every time more developers check in code, you know, this kind of identification happens automatically, and you end up identifying more and more risks and fixing more and more things, resulting in more and more secure applications into prod.

    Ashley: Mm-hmm. Awesome. Well, what are some things folks might have access to you can help them get started? Obviously, they can download HIV testing product or get involved that way. Do you have some other tools or things that they might be able to use to make it approachable to get into this kind of an approach?

    Kamity: Yeah, they can go to DeepFactor.io to check out the product, understand more about the product. And if they want to get started, they can either download the community edition that is now free for 10 user teams or less. If you need any help with setting up the product, you can reach out to our Customer Success person.

    We’re also giving away a free DevSecOps Risk Assessment to companies that are working with us as we expand our organization more. This will help any engineering team or any security team to get a free assessment of what DeepFactor can find in their applications so that they will be able to identify, “Okay, these are the kinds of things DeepFactor finds, and it’s useful for me and here’s where I need to go next” kind of thing.

    So, that DevSecOps Risk Assessment is completely free. Contact us, hello@deepfactor.io or just go to the website to learn more.

    Ashley: Awesome, great. I know you’re also speaking at the Cybersecurity 2021, I think you have a couple of sessions there, right? The dates are March 4th and 5th for that event.

    Kamity: Yeah. We have a couple of speaking sessions at Cybersecurity ’21. We have a virtual booth there as well, so do check us out. There is a—you know, our team can answer any questions or even try to explain to you or help you understand what DeepFactor can do and identify in your application.

    Also, today, we’re launching Observability-as-Code. It’s a new module that we’ve created, and a product that allows people to bake in observability into their CI pipeline, similar to how Infrastructure-as-Code enables DevOps and DevSecOps folks to spin up, spin down infrastructure in their CI pipeline itself and other related scripts. You can do, now, the same thing with observability for security and compliance with DeepFactor. So, you can use our API, we have a Swagger doc ready, you can use our API to invoke DeepFactor as part of your CI pipeline, get the results, triage the results, use that results to block, if there’s any P1s you want to block the _____, you can do that. You can do things like that with the Observability-as-Code API that we just announced.

    Ashley: Excellent. Well, I hope folks will check you out. I think it’s a great path to be going down, and I’m sure developers appreciate writing more secure code, but completing an application that’s more secure that they’re involved in developing.

    So, Kiran Kamity, great to have you here, CEO and founder, co-founder—I guess founder [Laughter] of DeepFactor.io. And be sure and check out the speakers that you all have at Cybersecurity 2021. It’s a great conference and we look forward to hearing more from you, there. Thanks for joining me today. Great to talk with you.

    Kamity: Thank you much. Appreciate the opportunity.

    Ashley: You bet.

    Kamity: Bye.

  • Why Every DevOps Team Needs a Spot Instance Strategy

    Why Every DevOps Team Needs a Spot Instance Strategy

    Most DevOps teams use the public cloud extensively and focus a lot of energy on reducing cloud costs. According to one estimate, U.S. businesses spent $14.1 billion in 2019 just on wasted, unused cloud resources. Spot instances are one of the most important ways to reduce the cost of public cloud services.

    Spot instances are not a new development. Amazon was the first to announce this pricing option in 2009, turning cloud computing into a market influenced by the dynamics of supply and demand. Microsoft Azure took more than a decade to follow suit, announcing its spot virtual machines offering in May 2020.

    The spot pricing model is simple on the surface but can be complex to implement. Spot instances are how cloud providers sell their unused capacity. When compute instances are not ordered by anyone via the regular, on-demand pricing model, the cloud provider puts them up for auction at very favorable prices, usually around 10% to 20% less than the on-demand cost.

    However, it’s not so simple to get this 80% to 90% discount. When another cloud customer requests the spot instance, the cloud provider sends a notification, and you need to immediately move your workloads before the instance is terminated. This makes it difficult to use spot instances for stateful, database-driven applications, or those that require high availability.

    This is not the only challenge. The market price fluctuates and is much more volatile than on-demand pricing. This means the level of discount that can be achieved over time is relatively unpredictable.

    However, there are at least three ways savvy DevOps teams can make great use of spot instances:

    1. Automation—DevOps teams are proficient with a range of automation tools, including configuration management, infrastructure as code (IaC) and cloud provider auto-scaling tools. These can be used to manage workloads in clusters and automatically fail over when a spot instance terminates.
    2. Dev/test environments—DevOps teams are responsible for setting up development and testing environments, which are extremely suitable for spot instances because they can usually tolerate brief interruptions, and, in many cases, are not stateful.
    3. CI/CD jobs—running jobs on Jenkins, GitLab and similar tools can be easy to scale on spot instances. These jobs are stateless, and if an instance drops, it’s easy to rerun the job on another.

    AWS Spot Instances

    AWS Spot Instances let you buy unused Amazon EC2 computing power at a significantly discounted price. You can specify a price, and when a spot instance is offered at that price, it is launched with the Amazon Machine Image (AMI) of your choice.

    How Spot Instances Work on AWS

    Spot instances are priced at a variable spot price, which is adjusted according to supply and demand conditions. To see current rates, use the AWS Spot Instance Advisor.

    You create a spot instance request, specifying what instance types you are interested in, and the availability zones (AZ) in which they should run. If capacity is available, and their current price is less than your maximum bid, instances are launched.

    Spot instances continue running until:

    • Capacity is no longer available (because the instances were requested by on-demand customers).
    • The price has risen over your maximum bid.
    • You request to terminate the instance, or it is automatically terminated by auto-scaling.

    You can also order spot instances with a predefined duration—you then pay a static hourly rate for that entire duration (even if market price changes in the interim).

    Automation Options

    You can automatically scale instances on Amazon EC2, including both on-demand instances and spot instances in a single auto-scaling group. If spot instances are not available when scaling up, the group can use regular on-demand instances.

    Amazon also supports mixing in reserved instances and savings plans (additional ways to save on on-demand instances by committing to a certain period of time or total capacity). So you can combine multiple saving methods in the same auto-scaling group.

    You can improve availability by deploying applications across multiple instance types running in multiple AZs. By allowing multiple instance types, you tap into multiple pools and increase the chances of obtaining a spot instance when you need it.

    Azure Spot Instances (Spot VMs)

    Azure offers Spot VMs that give you access to unused compute capacity. You can request a single spot VM, or launch multiple spot VMs using an Azure VM Scale Set (VMSS). Spot VMs replaced the previous Low Priority VMs feature, which let you purchase VMs that were in low demand on Azure for a reduced price.

    The spot price of VMs on Azure depends on the total capacity available for that specific instance size and SKU (instance type) in the Azure region. Azure commits to changing pricing slowly—avoiding sudden spikes—to maintain pricing stability and make it easier to manage budgets.

    Like on Amazon, discounts fluctuate significantly, and spot VMs can be up to 90% cheaper than the base price of the same VM.

    How Spot VMs Work on Azure

    The Azure Portal provides access to Azure spot VMs. When you create a spot VM, you can see the current price for the selected region, image and VM size. For consistency, prices are always in U.S. dollars, even if you use a different base currency for billing.

    There are two options for eviction of spot VMs—you can choose the condition on which spot VMs will be evicted:

    • Maximum price eviction—You set a maximum bidding price, and when the spot VM rises over that price, it is evicted.
    • Capacity eviction—You always pay the current price of the VM (without setting a maximum price), and when Azure does not have sufficient capacity of the requested VM type, your VM is evicted.

    When a VM is evicted, Azure applies an eviction policy called Stop / Deallocate. This means the instance is paused, but attached disks remain, and you are still charged for them. When the price goes down or capacity becomes available, the instance is restarted and continues working on the same disk data.

    Automation Options

    Azure provides virtual machine scale sets (VMSS), which can automatically increase or decrease the number of VMs running your application. You can create a scale set that includes spot VMs, and as your application scales, more spot VMs will be added as they become available. Spot scale sets operate in a single fault domain and do not guarantee high availability. Unlike AWS, Azure currently does not allow you to mix on-demand VMs and spot VMs.

    Both Amazon and Azure provide robust capabilities for cost savings using spot instances. Azure’s offering is newer and provides less-advanced bidding and auto-scaling capabilities, but these are expected to be added as the service matures.

    Whether DevOps teams choose to run in AWS, Azure, or both, they literally cannot afford to ignore spot instances, especially for low-criticality workloads like dev/test and CI/CD job execution.

  • Engineering Practices Can Overcome DevOps Challenges

    Engineering Practices Can Overcome DevOps Challenges

    When I think about the challenges of DevOps transformations, I love the viewpoint expressed by Ryan Harmon, strategic accounts manager at Trace3: “DevOps is a complex maze that has many leaders frustrated. In many large enterprises, ‘DevOps’ is simply a buzzword they are striving to achieve but struggle with what the end state looks like or even where to start. There are many layers across the organization that are instrumental to truly executing on DevOps. DevOps is not something you go get a quote for and simply buy. It’s an evolving journey.”

    In my previous article, The Time Has Come for an Engineering Approach to DevOps, I agree with Ryan.

    Too many organizations launch into a DevOps transformation initiative without considering the full scope of what it takes to engineer a successful DevOps solution. DevOps is more than “just” a CI/CD pipeline or toolchain, as complex and challenging as this alone may be to accomplish, for even one application. DevOps is more than simply a culture change, as difficult as that always is.

    There are 24 DevOps practice categories that need to be mastered to realize and evolve well-engineered, high-performance enterprise DevOps solutions. Not all 24 need to be mastered to begin the DevOps transformation, but, ultimately, all of them do need to be mastered before the solution will achieve the high performance levels to which many enterprises aspire. The good news is, successful enterprises have demonstrated that the investment in people and technologies required for the journey is worthwhile, and a strategic approach will get you there systematically if you follow a disciplined engineering implementation roadmap.

    As explained in my book, Engineering DevOps, the core of every successful DevOps practice includes nine core pillars. These are the pillars to focus on as you start on your DevOps journey. The following paragraphs illustrate requirements for each of the nine pillars.

    Leadership – Leaders set an inspiring DevOps directional vision for the organization, and proactively stimulate and sponsor team activities that help progress toward goals.
    Collaborative culture – The organization encourages cross-functional collaboration, shared responsibilities and works to reduce restrictive boundaries between organizational functions.
    Design for DevOps – Products are architected to support service-oriented, modular, independent packaging, testing and releases, in accordance with the principles of twelve-factor apps.
    Continuous integration – Changes to software code and artifacts needed for releases are frequently merged, built, tested and packaged into executable artifacts for application releases.
    Continuous testing – Software tests that are most important to verify the results of pipeline stages including pre-flight, integration, regression, performance and release acceptance tests are automated as much as possible.
    Elastic infrastructure – Infrastructure-as-a-service (IaaS) resources (i.e., software, computing machines, storage and networks) are integrated into a toolchain for automating builds and testing environments to efficiently support variable workload demands.
    Continuous monitoring – Applications, pipeline tools and infrastructure components are instrumented with metrics, and the collected data is analyzed to manage health and performance.
    Continuous security (DevSecOps) – Security practices, processes and technologies for applications, databases, pipelines and infrastructures are integrated into the culture and pipelines to assure security.
    Continuous delivery – Release artifacts are validated, prepared for deployment to production and may be automatically deployed to production once acceptable deployment measures are achieved.

    A Comprehensive Engineering Blueprint

    While the above nine practice categories are the core of every successful DevOps solution, 14 additional practice categories are essential parts of a comprehensive engineering blueprint for accomplishing high-performance DevOps.

    DevOps infrastructure practices are used continuously by the nine core practice categories as follows:

    Version management systems – Every stage in the end-to-end DevOps value stream depends on keeping track of versions of software source code, configuration data and executable images using source code management systems, artifact repositories and configuration management systems.

    Infrastructure-as-a-Service – Virtualized cloud and dedicated resources must be served up ephemerally to meet variable workload and storage demands, which requires mastering engineering practices for orchestrating dedicated and cloud, hybrid cloud and multicloud services, and deployment of applications to the infrastructure.

    DevOps pipeline practices, which constitute a layer just above the nine core practices, include two additional categories that make use of the nine core DevOps practices.

    Application release automation – Directing and monitoring software changes through the CI/CD pipeline requires process orchestration and data analysis working at a level above the CI/CD pipeline itself.

    Value stream management – A deployed service, composed of multiple application microservices and data services, requires orchestration and analysis of a federated set of services, end-to-end, across the value stream from planning through to operations.

    Management Practices

    DevOps management practices include four categories that make use of the DevOps Pipeline practices, as follows:

    Service catalogs – Organized collections of software stacks, tools and pre-configured pipelines, made available through portals, enable DevOps-as-a-Service operations and simplify access, configuration, control and evolution of DevOps resources needed by enterprise application teams.

    Disaster prevention and recovery – Proactive disaster monitoring coupled with high-availability configurations and disaster mitigation practices, such as automated processes, work together to minimize the blast radius of disastrous events, and orchestrate rapid restoration of essential DevOps services, when needed.

    Site reliability engineering (SRE) – A combination of practices which include service level objectives (SLOs), error budgets, monitoring, work-sharing policies, toil reduction, proactive anti-fragility practices and blameless post-mortems help to “shift left” production wisdom from operations into development, thus improving the efficiency, readiness, security and resiliency of applications and infrastructures in production.

    Governance – The scale and scope of enterprise DevOps solutions are controlled using governance policies-as-code implemented through service catalogs, management dashboards and error budget policies.

    Project Practices

    DevOps project practices include four categories that guide enterprise adoption and evolution of DevOps, as follows:

    Adoption – Enterprise-wide DevOps adoption strategies that engineer and build DevOps capabilities in logical phases. This begins with a small set of representative applications that serve as a model for other applications; this method has been shown to be more successful than “boil the ocean” strategies that attempt to transform all applications at the same time.

    Model applications – Applications – that can serve as a model for greater enterprise adoption – are selected and monitored according to criterion that spotlight the value of DevOps for other applications.

    Return on investment (ROI) – DevOps investments must compete with other IT projects for resources. An ROI model that demonstrates measurable cost savings is an approach that has proved to achieve greater numbers of DevOps project approvals compared to other methods.
    Continuous improvement – Competitive forces and industry trends require that DevOps solutions continue to evolve to keep up with enterprise requirements.

    The Human Element

    Human development practices include two categories, as follows:

    DevOps engineering – The development of DevOps engineer roles, skills and the structure of DevOps engineering within an organization is critical to the success of designing, building, maintaining and evolving DevOps solutions.

    Continuous learning – A DevOps continuous learning strategy is critical for the development and transfer of DevOps knowledge needed to develop and continuously improve DevOps for the enterprise.

    In summary, the importance of practice categories – and specific practices within each of the categories – will evolve as each application does, alongside the changing needs of the enterprise. DevOps is complex, but a comprehensive engineering strategy that considers the 24 DevOps practice categories described in this article can help enterprises achieve the high-performance DevOps solutions they need to justify the investment and to meet business goals.

  • Is GitOps Replacing DevOps?

    Is GitOps Replacing DevOps?

    Roundtable 7: Much of what we think of as DevOps is happening now within GitOps. Is GitOps the next stepping stone from DevOps? Will organizations go directly to GitOps? What does this mean for organizations working to implement CI/CD?

  • Applause Automates App Testing via SaaS Platform

    Applause Automates App Testing via SaaS Platform

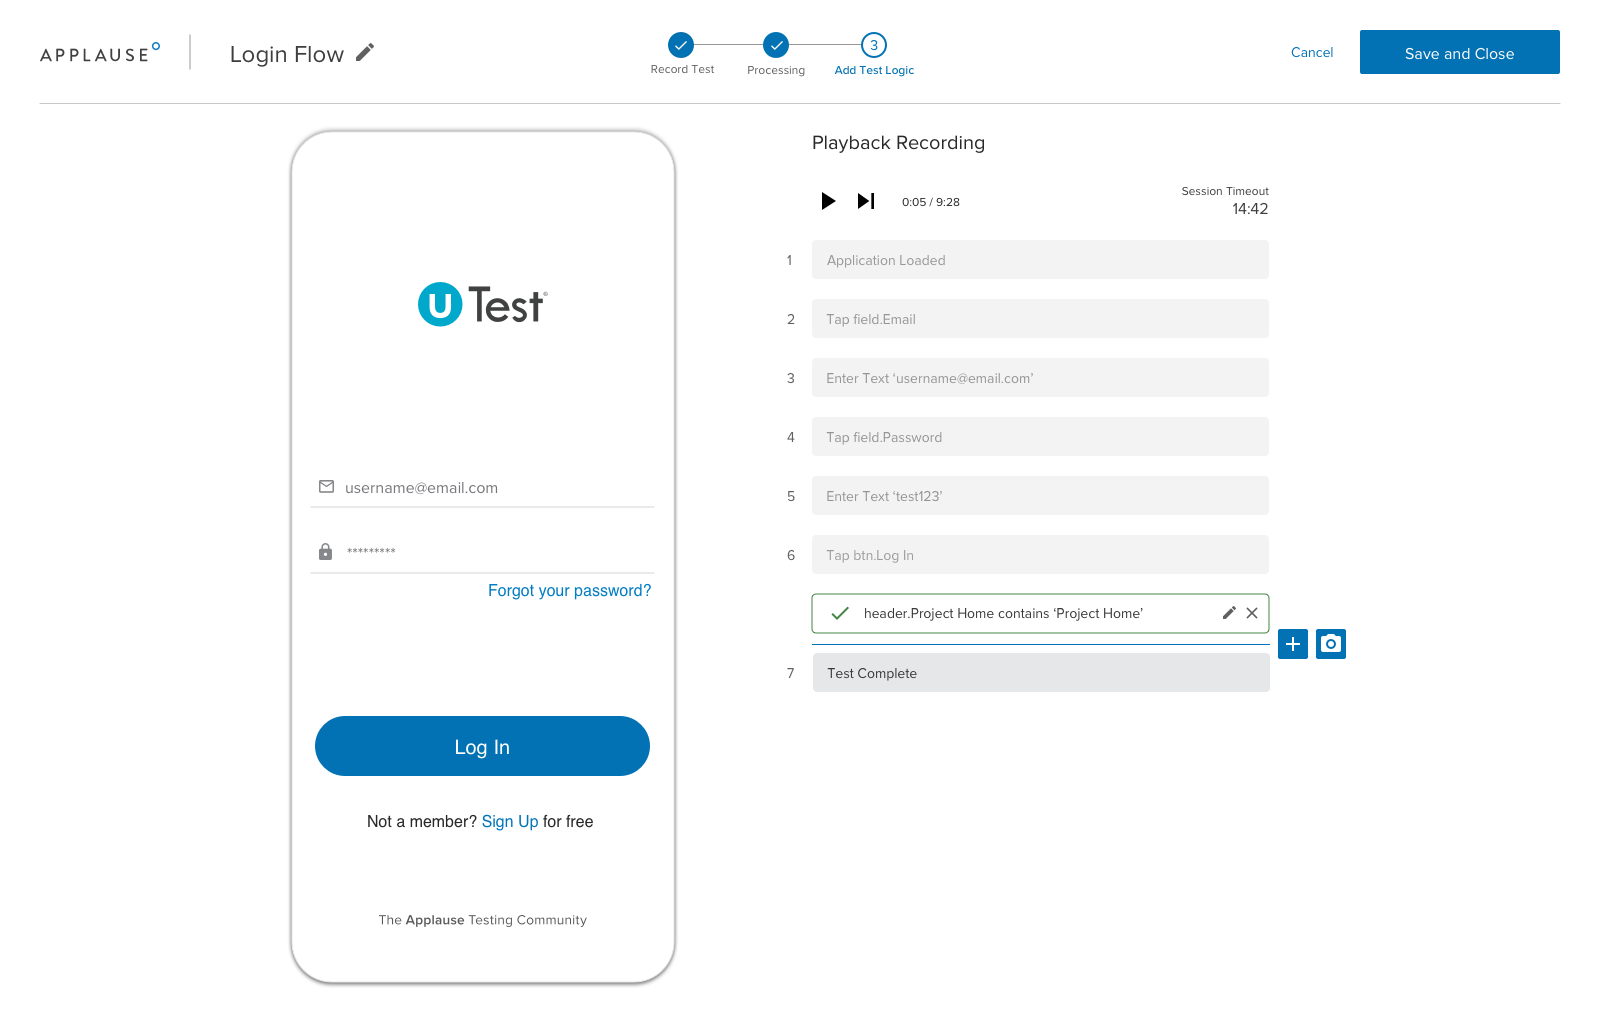
    Applause today unfurled a software-as-a-service (SaaS) platform that makes it easier to automatically create test automation scripts without having to write code.

    At the same time, the company is adding support for an application programming interface (API) through which DevOps teams can send new features to be tested by the Applause platform.

    Both offerings are now being included with a rebranded Product Excellence Platform (PEP) offering, a suite of tools and platform through which Applause is making its portfolio of offerings more accessible.

    Rob Mason, Applause CTO, said the Applause Codeless Automation (ACA) platform makes it possible for testers to record a series of test case scenarios using a SaaS platform that translates those sessions into an automation script without anyone having to write any code. The current offering supports Android and Apple iOS applications with support for web applications planned, Mason said.

    An Applause In-Sprint Testing capability, meanwhile, makes the testing process more iterative using a bi-directional API that can be plugged into any software development life cycle (SDLC) process, Mason said. That bi-directional capability makes it possible to embed the feedback from the testing process into any bug tracking system implemented by an application development team, said Mason.

    Mason said that capability is critical, because it enables DevOps teams to identify issues earlier, thereby avoiding late-stage bug fixes that are more costly to fix. It also provides the added benefit of making it easier for developers to address issues in the moment applications are being written, versus days or weeks later when the context around that issue has long since been lost, Mason added. The SaaS platform provide developers with a just-in-time testing capability, Mason said.

    Ultimately, Mason said the goal is to make it simpler for a wider range of individuals to participate in application testing by making it easier to reuse tests. In addition, he said, it will allow subject matter experts to record tests that can be turned into test scripts on their behalf. That approach will enable organizations to push testing further left, beyond the developers that originally created an application, to include the owners of that application, Mason added.

    The rate at which applications are being built to drive digital business transformation initiatives is increasing, and makes testing more problematic. Automation is the only way to close the gap between the number of application testers an organization can dedicate and all the applications being developed. The automated approach not only reduces the time and effort required to create a test, it also makes it easier to reuse tests across different application use cases.

    Ultimately, it’s only a matter of time before machine learning (ML) algorithms and other AI capabilities play a larger role in application testing. The challenge will be finding exactly where the interface between humans and machines should lie in the context of application testing.

    In the meantime, the more automated testing becomes, the more widely it will be conducted. The results of those tests may not always be welcome news, but the issues they raise are always better addressed sooner than later.

  • Katana Graph Secures $28.5 Million Series A Financing Round Led by Intel Capital

    Graph processing, AI and analytics company will use new investment to accelerate product roadmap execution, sales and marketing activities

    AUSTIN, TX – February 24, 2021 – Katana Graph, the high-performance scale-out graph processing, AI and analytics company, announced today that it has completed a $28.5 million Series A financing round led by Intel Capital with participation from existing and new investors including WRVI Capital, Nepenthe Capital, Dell Technologies Capital, and Redline Capital. Intel Capital investment director, Vijay Reddy, will join Katana Graph’s board of directors, while Redline’s managing partner Tatiana Evtushenkova, and Dell Technologies Capital president, Scott Darling, will join as board observers.

    “We are delighted to welcome our new investors,” said Keshav Pingali, CEO and cofounder of Katana Graph. “These investments will let us accelerate our product roadmap execution, and continue to expand the use of our technology across a range of industries and innovative applications.”

    Katana Graph’s platform extracts actionable insights from massive unstructured data sets, using high-performance graph algorithms. At the heart of Katana Graph’s solution is the Katana Graph Engine with its accompanying partitioner, communication, virtualization and storage technology modules, which are the culmination of more than a decade of advanced research in graph technology and high performance computing.

     “Katana Graph’s platform helps large enterprises make sense of their large unstructured data sets, and we’re seeing this demand across a variety of industries from social networks to biomedical and pharmaceutical research,” said Anthony Lin, managing partner and Head of Intel Capital. “We are excited to lead Katana Graph’s new funding round based on our collaboration last year where Katana Graph’s technology was optimized for Intel®️ Xeon® processors and Xeon-based clusters. We’re looking forward to helping Katana Graph accelerate their growth.”

    “We are delighted to be investing in Katana Graph and its elite team,” said Scott Darling, president of Dell Technologies Capital. “The Katana platform is a breakthrough solution that integrates data ingestion, querying, and analytics with unprecedented scale and performance to address the data deluge problem for unstructured graph data. We are also excited to back the company given Dell Technologies’ and Katana Graph’s shared roots in the University of Texas at Austin.”

    “I am excited and honored to provide initial capital and partner with professor Keshav Pingali and professor Chris Rossbach to provide the most comprehensive platform for large-scale graph data mining, query and analytics,” said Lip-Bu Tan, chairman of Walden International and founding managing partner of WRVI Capital. “I am pleased to have Intel Capital, Dell Technologies Capital, Nepenthe Capital and Redline Capital join us in building Katana Graph into the leading graph computing platform for multiple vertical markets.”

    The Series A financing builds on an exceptional year for Katana Graph, which saw a rapidly-growing number of enterprise clients in the pharmaceutical, fintech, identity, security, and EDA market segments, as well as strong momentum in the explosive big data analytics market. Katana’s leadership team also includes industry veterans with track records of running successful technology businesses or divisions, including Chris Rossbach, CTO and co-founder, who has held senior roles at VMware and Microsoft Research, and Farshid Sabet, Chief Business Officer, who was GM of Edge AI at Intel. N. R. Narayana Murthy, founder of Infosys and Amy Chang, board member at Procter & Gamble and Cisco, are board advisors for Katana.

    Key features and benefits of the Katana Graph include:

    • Ability to handle massive unstructured data and integrate complex pattern mining workloads on large enterprise data sets and knowledge graphs;

    • Superior performance for complex graph AI, graph pattern mining and graph analytics algorithms;

    • Support for heterogeneous clusters of computing resources including x86 CPUs, ARM CPUs, GPUs and other accelerators; and

    • Ease of development of high-performance graph AI, graph pattern mining and graph analytics applications, and seamless integration with graph querying.

    About Katana Graph

    Katana Graph analyzes unstructured data and enables our partners to make better decisions by solving challenging big data problems through graph analytics and machine learning. Katana Graph combines cutting-edge algorithms, innovation in hardware acceleration, and emerging storage technologies to provide multiple orders of magnitude performance improvements to graph databases, graph analytics and graph mining workloads. Katana Graph’s elite team includes field leaders in graph algorithms, machine learning, graph neural net, programming languages, runtimes, virtualization and storage. To learn more about Katana Graph, visit www.katanagraph.com.

    About Intel Capital

    Intel Capital invests in innovative startups targeting artificial intelligence, autonomous vehicles, datacenter and cloud, 5G, next generation compute and a wide range of other disruptive technologies. Since 1991, Intel Capital has invested US$12.9 billion in more than 1,582 companies worldwide, and 692 portfolio companies have gone public or participated in a merger. Intel Capital curates thousands of business development introductions each year between its portfolio companies and the Global 2000. For more information on what makes Intel Capital one of the world’s most powerful venture capital firms, visit www.intelcapital.com or follow @Intelcapital.


  • Mabl Adds Beta of Desktop Continuous Testing Tool

    Mabl Adds Beta of Desktop Continuous Testing Tool

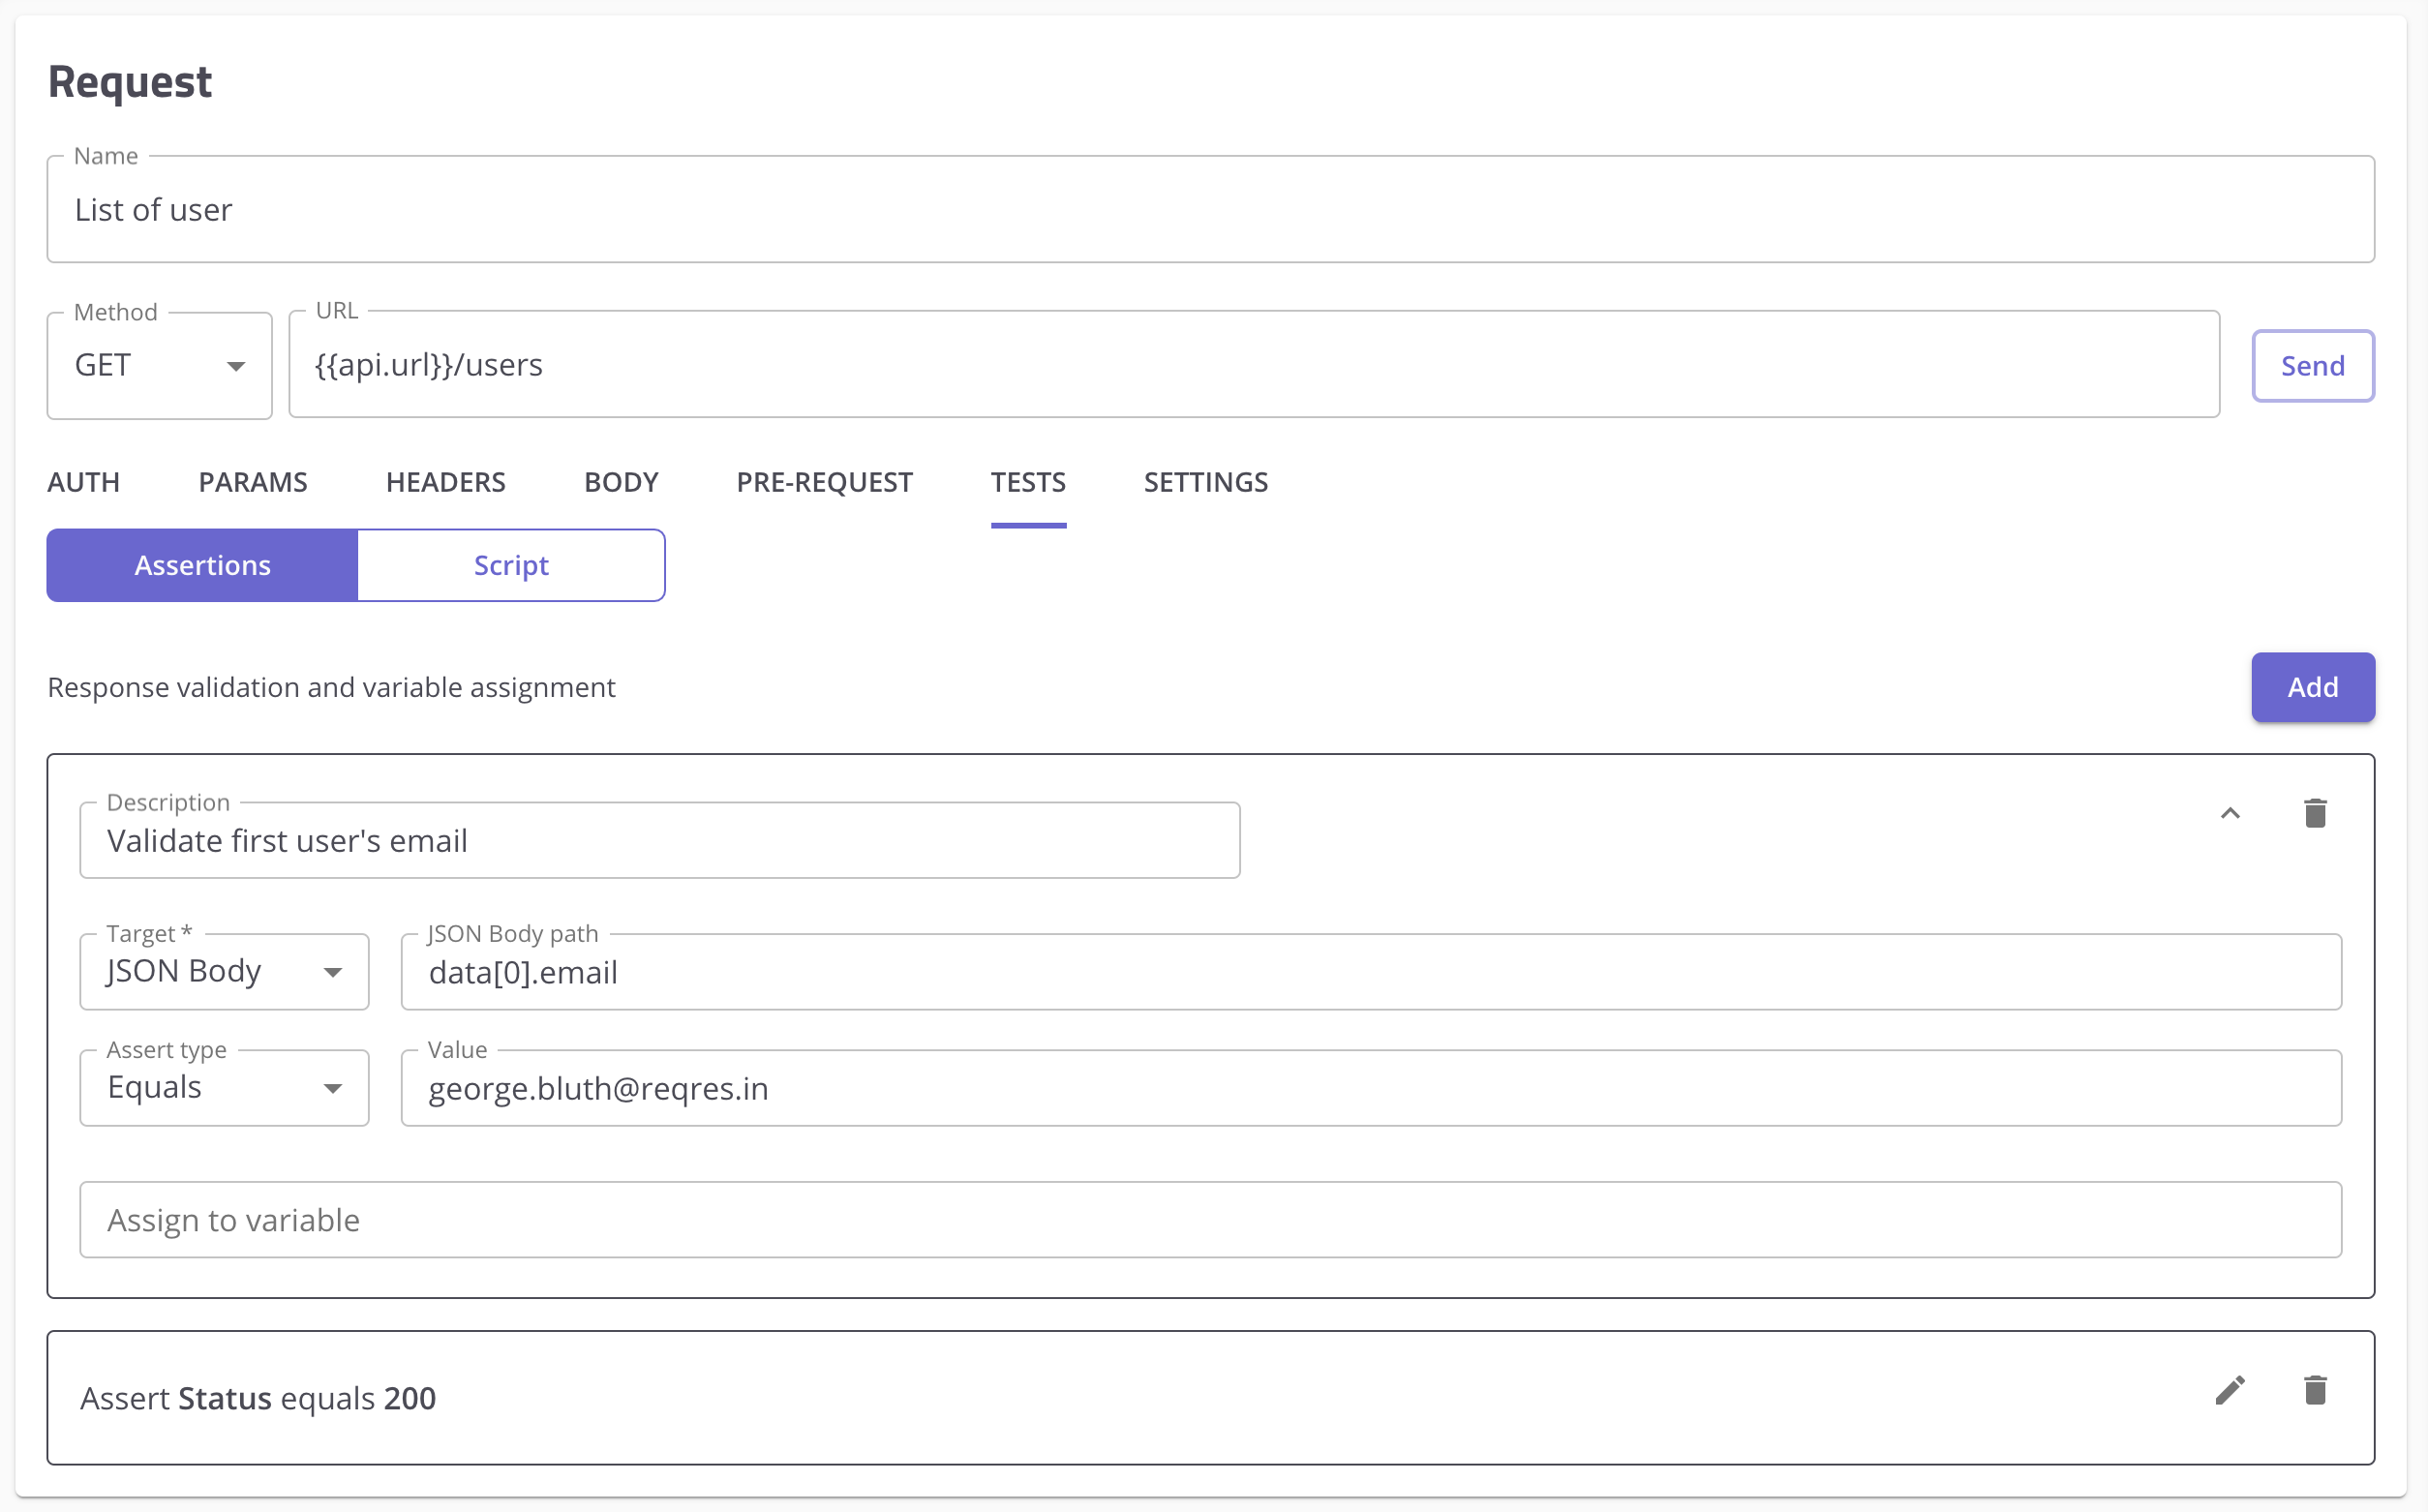
    Mabl today announced availability of a beta version of a desktop tool for creating tests that can be applied to browsers and application programming interfaces (APIs) using a low-code tool.

    Dan Belcher, co-founder of Mabl, said the goal is to make it simpler to streamline testing processes as responsibility for application quality assurance (QA) continues to shift left within the context of a DevOps workflow.

    Mabl provides a low-code tool for testing desktop and mobile browser applications, alongside the APIs they invoke, using an Electron tool that generates tests in a way that eliminates the need to write scripts. Previously available only via a software-as-a-service (SaaS) platform, Belcher said the desktop platform will make it simpler for developers to test code as they develop it on a local machine.

    Developers using the desktop tool can now also manage and run tests instantly via command line interface, versus having to completely exit from a project to invoke a separate testing tool, Belcher said.

    The Mabl testing tools are already integrated with multiple continuous integration/continuous delivery (CI/CD) platforms, such as Bitbucket and Bamboo, as well as the GitHub repository.

    In the longer term, Belcher said it is clear organizations will need to involve more developers in QA testing, as the rate at which applications are being built and deployed continues to increase. Testing teams, on their own, can no longer keep pace with the rate of change, Belcher noted.

    The challenge is achieving that goal in a way that creates the least amount of friction possible, Belcher added. The Mabl platform and desktop application make it feasible for developers to test both web and mobile applications without taking too much time away from developing application code, said Belcher.

    Testing has become a major DevOps issue because, as developers assume more responsibility for applications after they have been deployed in a production environment, they naturally want to vet applications more thoroughly. Issues that arise after an application is deployed simply result in less time available to write new code. There will always be issues that need to be addressed, but the more of them that are resolved as part of a QA process integrated within a DevOps workflow, the more productive an application development team will be.

    Unfortunately, testing is often given short shrift; it primarily occurs at the back end of the application development life cycle. Developers are typically behind schedule, so there is a natural tendency to reduce the amount of time allocated to testing in the hope of making an application delivery deadline. The vicious cycle that ensues is that, inevitably, there are more bugs to fix after an application has been deployed, simply because not enough testing was done during the original development cycle.

    Of course, some development teams have become conditioned to fixing bugs as part of an agile development process that, too often, encourages them to push known issues off to the next sprint. The trouble is, in the absence of continuous testing, it’s not long before all those known bugs start to pile up. It’s not uncommon for applications to be riddled with bugs that development teams – with mixed success – attempt to address all at once. The earlier those issues are addressed, the less stress there will be later for all concerned.

  • 3 Common App Modernization Pitfalls to Avoid

    3 Common App Modernization Pitfalls to Avoid

    Application modernization has been a consistent theme for organizations year after year. Businesses today still rely on their legacy applications for the majority of their revenue generation, from mainframes to Java EE. New digital transformation initiatives and mandates have pushed application modernization back to the forefront, as a new generation of automation platforms and best practices are helping these organizations avoid the pitfalls of the past and accelerate their journey to cloud-native architectures.

    Here are the three most common application modernization pitfalls and how to avoid them.

    Lack of a Clear Organizational Destination

    Application modernization journeys need a north star – a destination point that development, infrastructure and DevOps teams can rally around. In order to establish a clear, unified direction, everyone must share a precise understanding of that destination. That journey starts by defining a set of business goals you are trying to accomplish (such as cost savings, business agility, resiliency and/or competitive advantage) that can guide and prioritize the technical decisions.

    Next, you need to decide which application modernization technologies, platforms, and infrastructure will help you deliver on those business goals (e.g., Red Hat OpenShift, Kubernetes, serverless, hybrid, private or public cloud, etc.). Setting common architectural standards will help avoid disparate future stacks and ensure a common shared platform for microservices architectures. For example, if an application starts with Java WebSphere, should the goal be to move to a modern container framework like Spring Boot, or a specific microservices Java framework like Quarkus? To avoid analysis paralysis and internal drag, set tangible objectives and targets that prescribe how teams are expected to prioritize, select and modernize these applications and how their progress should be measured, communicated and shared.

    Taking Shortcuts – Don’t Fall For the Old ‘Lift and Shift’

    The more one modernizes, the more value one gets from the cloud – but not all modernization efforts are created equal. For example, ‘lift and shift,’ putting a monolith into a container and application refactoring into microservices are all called “modernization.” But only refactoring allows enterprises to realize the true benefits of the cloud, including elasticity, regained engineering velocity and cost savings. Don’t fall into the quick-and-easy modernization temptation with lift and shift or brute force containerization. You will still have a monolith, in the end; you’ll simply end up paying more and trading one set of monolithic problems for another.

    Not Bringing Everyone Along – No Developer Left Behind

    Modernization is never just about technology. Modernization requires that your team’s processes (for example, agile practices), structure (vertical domain teams as opposed to horizontal teams – UI team, for instance) and skills must all adapt. The organizational culture needs to grow to adopt DevOps and cloud-native best practices to take advantage of the deep development, build, deployment and operational benefits that are available. Take the time to train and educate so everyone is brought along. Modernizing legacy applications can introduce a whole new set of technologists, responsible for those applications and the supporting infrastructure, into the cloud-native world. This is a win-win for everyone.

    In other words, the organization needs to have crystal clear answers to the where (destination), why (path) and how (team) to ensure success and avoid the three most common pitfalls of application modernization.