Category: DevOps Toolbox

  • 6 Big, Bad Mistakes in Configuration Management, Part 2

    6 Big, Bad Mistakes in Configuration Management, Part 2

    In Part One of my article on big, bad mistakes in configuration management, I reviewed the dangers of using the wrong tools for the configuration management job. Provisioning management tools, application release automation tools and continuous integration tools each have their place in your DevOps toolchain. But they should not be used as a substitute for ongoing configuration management. In this article I am focused less on misusing tools and more on bad practices, limited thinking and short-sightedness that should be avoided.

    Mistake No. 4: Direct Server Access to Production

    This one may not bite you … until it does. I’ve worked with many companies where developers have direct access to Production. This is not good. And, in many cases, it is a violation of compliance policies. Please don’t take offense, my developer friends. You shouldn’t want direct access to Production. I find that 9 times out of 10, your code is not the problem—the configuration is the problem. However, you’re being asked to log directly into the server to do comparisons between your environment (where it worked just fine) and Production. This leads to the, “How did he fix it?” problem, and it leads to the dreaded typos and other manual errors. I’ve witnessed companies lose millions of dollars in a matter of minutes because someone logged directly into a server and made an incorrect configuration change.

    The question is, How do you cut off direct access to Production? How do you quickly find configuration differences between environments without logging into the server? The answer is a good configuration management solution that quickly shows differences between the environments for all your tiers. This is easy when you’re doing file-to-file comparisons, but what about registry key comparisons, or WebSphere comparisons? Find a configuration management tool that gives you visibility fast, exactly when you need it, for the important parts of the stack that keep your applications running. And insist on a configuration management solution with robust RBAC (role-based access control) over what changes can be made, where and when they can be made, who can make them and even who can approve them.

    Mistake No. 5: Leaving Your DBAs Out of the Picture

    The majority of companies I work with have completely disconnected database and middleware teams—the DBAs don’t really know what the middleware team is doing and the middleware team has no visibility into what the DBAs are doing. I believe there are a couple reasons for this: people and technology. We won’t worry about the people aspect today, other than to say that each team thinks the other team is “quirky” J. From the technology aspect, traditional tools simply do not provide configuration visibility into both the middleware and the database tier. So the DBAs end up having one toolset, and the middleware team a completely different toolset. This prevents collaboration, orchestrated releases, and the complete configuration picture that’s needed to make sure your application is fully configured, performing, and running correctly.

    This is a big problem. In fact 37 percent of survey respondents admitted that they relied on scripting and manual processes to determine which databases were used by which applications in their ecosystems. And another 38 percent admitted they don’t even have a way to determine this information. Talk about blindfolds! My advice is to find a solution that both middleware and database teams can use. That doesn’t necessarily mean the DBAs will replace their favorite tools, but they’re now involved in the process, allowing that collaboration and orchestration that was missing.

    Also, if you use a single, integrated configuration management solution your management, middleware, OS and DBA teams will all have visibility into every aspect that makes the application run. The middleware team can see if there are schema changes that may be causing an application issue as opposed to spending hours looking for a middleware configuration issue they’ll never find, or vice versa. Having one unified tool cuts down on the mean time to diagnose because you can see all the tiers in one place.

    Mistake No. 6: Focusing Only a Single Part of the Stack

    The previous “big, bad mistake” segues nicely into this one: focusing on just a single part of the stack. There are many tiers supporting your application, and we’ve touched on several in this series—namely middleware, database and OS. Within each tier you may be supporting different technologies. Some applications may be running on IIS with a SQL Server back end while others run on WebSphere with an Oracle back end. Then you have the operating system settings to worry about: making sure registry keys are set, system services have the right accounts, filesystem permissions are accurate, all the correct versions of Linux packages are installed, etc.

    Based on a lack of comprehensive coverage up and down the application stack, many companies have chosen to explore configuration management tools for just a single part of it. These point tools tend to focus on the most business-critical applications, the one where they hit the most configuration issues or simply the one that’s most difficult to manage. This is not necessarily a bad thing to do, but take care not to be too single-minded. Try not to choose a configuration management solution that works well for one part of the stack but not others, or that works very well in one environment (Linux/Unix), but not very well in another (Windows). Managing these disparate point solutions, with maddening gaps and overlaps in coverage, can be exhausting.

    Choose a tool that’s extensible to other parts of the stack, business or other teams. My suggestion is to make a list of all present and future technologies you use that need configuration management support. Divide them into different parts of the stack and then rank them from “most onerous to manage and/or most business critical” to “nice to have.” Refer to this list when evaluating configuration management tools so you don’t lose sight of the forest from the trees. Make sure the tool can support all your top items and ask about their road map for your “nice to haves.”

    Tune into our upcoming webinar, which will touch on these topics as well.

    About the Author / Kristy McDougal

    Kristy McDougal leads Product and Sales Engineering for Orca, an application release and configuration automation solution for DevOps teams. Prior to launching Orca, Kristy was a Senior Pre-Sales Consultant within BMC Software’s worldwide DevOps specialist team. Before BMC, Kristy held technical positions at VaraLogix, Virtual Bridges, Global Foundries and Advanced Micro Devices. Her experience includes Unix systems administration, systems engineering, pre-sales consulting and post-sales services. Kristy is ITIL Foundation-certified and is an electrical engineering graduate of the University of Texas at Austin.
  • 6 Big, Bad Mistakes in Configuration Management, Part 1

    6 Big, Bad Mistakes in Configuration Management, Part 1

    Configuration problems come in many flavors. Some are mere nuisances. Often though, configuration errors can lead to more serious mishaps like application performance problems, policy compliance violations or even security vulnerabilities. They can often go undetected, quietly doing their damage in the background while everyone’s attention is focused elsewhere.

    Unfortunately, I find that configuration management is an area where many companies either 1) put it as a “last to solve” on their priority list (when arguably it’s quite important), or 2) try to solve it with a do-it-yourself fix, but in a way that’s not always extensible or that doesn’t end up working with their DevOps toolchain.

    Usually, I find configuration issues stemming from the age old problem: using the wrong tool for the job. In this blog I’ll address six big, bad mistakes of configuration management. (For the sake of brevity, three will be addressed here and three in an upcoming blog.)

    Before I get into it, though, there are so many definitions of configuration management that it warrants a brief summary so we’re all on the same page. I’m talking about the ongoing configuration management of the infrastructure tiers supporting your applications—the middleware, database and OS-level configurations that keep your applications’ lights on and everyone happy.

    Mistake No. 1: Only Considering Provisioning

    Notice I just mentioned the word “ongoing” in my definition of configuration management. I find that so often people forget to take the ever-important “ongoing” into consideration. I have many conversations with folks wanting to implement a “provisioning tool.” On the surface, they think they need just that: a tool that provisions infrastructure including all the tiers of the application. But when I probe further, what they’re really wanting is something that provisions and then continues to monitor, manage and fix. There’s a big difference there.

    Some tools do great at provisioning but lack the visibility and “ongoing” configuration management needs. Think of a provisioning tool as waving a bat at a piñata. Yes, you can “blow away your environment” and start over, but that blindfold prevents true visibility and ongoing interaction.

    When looking for configuration management, be sure to focus on your current and future needs. Do you just need a provisioning tool? Or do you need an ongoing configuration management tool? Or both? Most tools that tout doing both do one much better than the other, so be sure to do your research.

    Mistake No. 2: Using an ARA Tool to Manage Configurations

    In a previous position I spent quite a bit of time onsite with clients helping them automate their application deployment processes. What I found is that around 80 percent of “application deployment” tasks are actually configuration tasks. The application deployment is the easy part; it’s the configuration management aspect that causes all of the headaches. I would spend the majority of my time onsite hurriedly writing little scripts that would be hurriedly inserted into the deployment process that would set the application pool, restart the service, change a heap size, etc. I had to write the scripts because application deployment products are workflow automation engines with process wrapped around them. They are not meant to be infrastructure configuration management products.

    It bears repeating: Traditional application deployment solutions are not meant to be infrastructure configuration management products. They can get you part of the way there, but 1) you’ll need to script it all, which is not extensible and defeats the true purpose of a tool, and 2) they simply catapult your application (one way only!) into the next environment (i.e. Test to Staging, Staging to Prod), so you can forget about the “ongoing” piece we discussed above. Compare that one-way catapult launch to the complexity of routinely engineering one safe launch (and landing!!!) after another on an aircraft carrier on the open seas. A mission-critical task like this requires advanced technologies, visibility, communication and coordination to account for constantly changing environmental factors.

    Mistake No. 3: Using a CI or Build Automation Tool When You Need Configuration Management

    As bad as misusing an application release tool when you really needed a configuration management solution, it’s even worse using a continuous integration tool for this. Like many DevOps solutions, CI tools are particularly helpful for developers. CI tools like Jenkins and Bamboo require Dev teams to share or check in their updated code into a repository. The CI tool then detects potential problems early by automatically verifying builds for the developer. From the Dev team’s perspective, there is no more wondering if their code is going to work, and they spend less time debugging and redoing. The financial benefits of CI and the early warning system they provide should be obvious and considered a must-have for developers.

    But while detecting coding errors early saves a lot of hassle for the Dev and Test teams, Ops teams do not directly benefit from CI. Here’s why: Operations teams are concerned with the application release into Production environments and then the ongoing configuration management of the entire application stack including the application, middleware, database and operating system. Once the (application) baton is passed to them, they require visibility into and intelligence about the application’s operating environments—well after Dev and UAT. As good as they are for Dev teams, CI tools are simply not equipped to provide ongoing operations support, visibility and coordination in Production that modern Configuration Management solutions provide.

    These are just a few big, bad mistakes in configuration management and they focus largely on misusing tools beyond their intended scope. I will follow up with a Part II companion article that addresses configuration management practices to be avoided.

    Tune into our upcoming webinar, which will touch on these topics as well.

    About the Author / Kristy McDougal

    Kristy McDougal leads Product and Sales Engineering for Orca, an application release and configuration automation solution for DevOps teams. Prior to launching Orca, Kristy was a Senior Pre-Sales Consultant within BMC Software’s worldwide DevOps specialist team. Before BMC, Kristy held technical positions at VaraLogix, Virtual Bridges, Global Foundries and Advanced Micro Devices. Her experience includes Unix systems administration, systems engineering, pre-sales consulting and post-sales services. Kristy is ITIL Foundation-certified and is an electrical engineering graduate of the University of Texas at Austin.

  • Getting the Most Out of QA in Complex Environments

    Getting the Most Out of QA in Complex Environments

    We live in a world in which software is increasingly dominant. Not only do we rely ever more on software, but its complexity is becoming even greater. And with increased complexity, bugs are more likely to be intermittent, making failures difficult to reproduce. Sometimes this non-determinism results in failures never getting fixed. Any unfixed bug is potentially a security breach or catastrophic customer outage waiting to happen. With such risks on the line, ensuring your software is of the highest quality is essential to running a successful operation.

    To cope with this complexity while still providing some assurance of delivered software quality, the DevOps industry has embraced a variety of automated testing regimes. A development team of a given size is able to run many more tests than it could before and must triage, and attempt to resolve, a correspondingly larger number of test failures. Diagnosing the cause of each test failure can still take a lot of time, particularly if the problem is intermittent or otherwise not easily reproducible. In fact, developers can spend on average as much as 50 percent of their programming time debugging, not coding. Think of all the innovation that could occur if that time were reallocated.

    Traditional QA

    When it comes to Quality Assurance (QA), developers and testers are all aware of the sequence of deliverables, beginning with development delivering an untested product to QA, which releases the tested and approved product to the end user. However, when a bug is found, QA and Development must communicate with one another to solve the issue quickly. The effectiveness of the delivery channel between QA and Development hinges on the quality of the information about the failure.

    Some common challenges raised by inefficient QA processes include:

    • Complex control flow – Difficult to make inferences about how a failure unfolded
    • Non-deterministic failures – Hard to reliably reproduce a failure to investigate the root cause
    • International R&D – Collaboration is made more difficult by geographic separation

    Conventional test systems inform that there is a bug but offer limited information about the cause. Workflows such as continuous integration (CI) often offer clues, such as informing which commit to the codebase caused the failure. However, there are several cases where CI cannot directly help identify problematic code changes. For example, the triggering code change may be entirely correct, yet cause a pre-existing bug to manifest. The developer cannot simply stare at the modification in the expectation that the source of the bug will eventually appear. Conversely, the failure may not easily reproduce for the developers even if they run the same test again. In short, CI is often very good at making the easier bugs very easy to fix, but typically is of little help with the more difficult bugs, particularly intermittent ones.

    The Next Evolution of QA

    To bridge the gap between identifying a failure in the QA process and resolution by development, DevOps teams have adopted a variety of technologies to complement their automated testing setups. New to this scene is technology capable of recording all or part of a program’s execution for subsequent replay and analysis, capturing test failures as they happen. The recording contains all the information a developer needs to understand the exact set of conditions that led to the test failure. It can be analyzed on different machines to the one on which the failure occurred, facilitating collaboration between colleagues who can work on separate machines to resolve the same issue—a particularly useful benefit for large software companies with geographically distributed teams. By gaining the ability to debug an exact replica of the failure, developers immediately reduce the time and effort required to diagnose and fix failures, therefore speeding the development cycle.

    Being able to generate recordings of failed tests, especially those intermittent issues which might not otherwise get fixed, coupled with the productivity gains of increased collaboration between development and QA allows companies to maintain a competitive advantage in a volatile marketplace.

    About the Author / Greg Law

    Greg is the co-founder and CEO of Undo. Greg has 20 years’ experience in the software industry and has held development and management roles at companies including the pioneering British computer firm Acorn, as well as fast-growing startups, NexWave and Solarflare. Greg left Solarflare in 2012 to lead Undo as CEO and has overseen the company as it transitioned from the shed in his back garden to a scalable award-winning business. Greg holds a PhD from City University, London, that was nominated for the 2001 British Computer Society Distinguished Dissertation Award. He lives in Cambridge, UK with his wife and two children.

  • Help Us Understand CI/CD, DevOps & Job Scheduling

    Help Us Understand CI/CD, DevOps & Job Scheduling

    While plenty of vendors tell us what they think is happening in the market, the only way to really learn is from you, our readers. So we are asking you to take a few minutes to take this important survey on the adoption of CI/CD, DevOps and job scheduling.

    We will be giving a $50 Amazon gift card to one out of every 50 respondents. More importantly we will be publishing the results here on devopsy.kinsta.cloud to share with everyone. The survey is sponsored by BMC and co-produced with devopsy.kinsta.cloud.

    You can take the survey right here:
    Create your own user feedback survey
    Thanks for taking the time and helping us help us all.

    — Alan Shimel

  • How Developers Can Spend More Time Coding, Less Time Fixing

    How Developers Can Spend More Time Coding, Less Time Fixing

    I don’t think anyone became a developer because they loved to spend their time debugging. As frustrating as it may be, making sure your build works is critical—and this burden is now falling on developers. If your organization wants to deliver highly rated apps faster, building quality into the development cycle is imperative. Even though agile development has become a popular approach, it’s execution has a ways to go.

    A recent trends report in mobile and web development shows 25 percent of time is spent addressing a bug fix backlog. This can slow time-to-market and limit the amount of new features your company can roll out—not ideal when your top priority is to draw in new users and boost engagement to stay competitive. The good news is, the time spent debugging throughout the development cycle can be minimized. How? By shifting QA into the development process, you can spend more time coding and less time fixing.

    Mastering Agility in Practice

    The question for devs today isn’t whether they test, but when and how to do it best. We’ve all heard the vague, top-line answers before: “Adopt Agile development,” or, “Shift left.” The problem is, these terms and strategies can be challenging to execute in practice, especially without proper tools to make it happen.

    When we talk about “shifting left,” there’s still an important balance to be found as to which stage is right for dev teams to test—it can’t be too early, when there is nothing meaningful to test, and it can’t be too late, when the test batch pile is too big. Once your coding and testing processes are harmonized, you can effectively maximize your time and resources and get the job done faster and better.

    For development teams, if testing is done in bulk at the end, identifying the specific point in the build that needs to be corrected is like finding a needle in a haystack. When we shift quality left, defects are found earlier among a much smaller set of changes, and are therefore easier to fix. That’s why continuous integration (CI) calls for building, integrating and testing the system you’re developing upon delivery of even the smallest change.

    By testing continuously, uncertainty is reduced and feedback loops are made smaller, ensuring you’re building in the correct direction. The “shift left” trend is ultimately going to condense the dev cycle by getting quality back into the ingredient list. The earlier we deal with quality issues, the less focus is taken from our primary goal: building valuable, innovative technology.

    Find Tools that Mesh with Your Workflow

    Whether you use Selenium, Appium or Android Studio, new products need to integrate seamlessly into existing developer environments. Having to switch between building tools and testing tools is a big waste of time, and it’s unrealistic to expect a high adoption rate if the product is disrupting, rather than enhancing, your workflow. If you’re expected to shift testing into your development cycle, look for testing tools that seamlessly support the continuous integration of testing.

    Once your testing and building processes is aligned, the testing feedback and analysis becomes a new bottleneck. To minimize inefficiencies and feedback gaps, you need to carefully select tools that will improve visibility into build health, and help avoid batching up issues.

    Empower Developers to Satisfy Users

    At the end of the day, smaller batch sizes are only half the battle. No matter the batch size, quality only can be built in if it includes full test coverage, and if all the defects can be fixed in a way that actually meets user standards of quality.

    With tons of potential end user environments, injecting reality into the development process is crucial if you want to meet the high expectations of today’s consumers. With different phones, operating systems, levels of connectivity and apps running in the background, you never know what your apps will be put through once released. Leveraging stable test environments capable of recreating all potential user conditions throughout the developments cycle will maximize efficiency in development and accelerate the speed of innovation at your organization.

    Through a better delivery pipeline, mobile app and web developers are simply more effective. Once your test process is automated, aligned and maximized, writing better code can become your main focus. By taking a strategic, practical approach to shifting quality left—and giving developers the opportunity to focus on what matters most—you’ll see happier developers, and in turn, more successful businesses.

    About the Author / Paul Bruce

    Paul Bruce is Developer Evangelist at Perfecto, focusing on the value of quality and velocity throughout the software life cycle. He previously worked as an advocate for API development and testing practices and a full stack developer before that. He now writes, speaks, listens and teaches about software delivery patterns in modern enterprises and key industries around the world. Connect with him on LinkedIn and Twitter.
  • DataDog Announces APM. Why You Should Care

    DataDog Announces APM. Why You Should Care

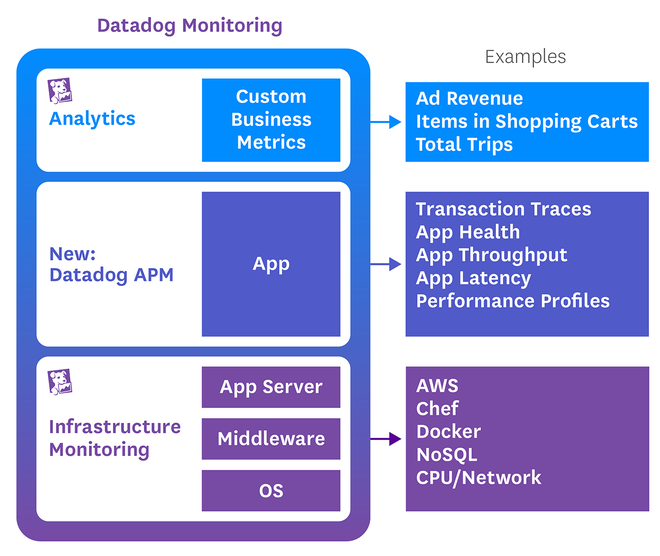
    In case you missed it, DataDog announced it has added application performance monitoring to infrastructure and business goal monitoring.

    1Part of my background includes a variety of clustered systems. First VMware, then OpenStack, Hadoop and its derivatives for a while, and these days the Mesos family. One of the many things I have learned along that journey is the inter-related nature of infrastructure and application. While we all know about that relationship, it goes further, I think, than most people recognize. A single degraded hard disk or loose network connection, which pushes work back out to the rest of the cluster, can drag an entire cluster to its knees.Since my time at F5 Networks taught me a metric ton about the nature of load balancing, I can say confidently that the same could happen to your load-balanced application.

    The biggest frustration for me in most multi-system configurations is the inability to track enough places to quickly diagnose the problem, because your application could be brought to its knees just as easily by a memory leak. But the logs are spread across multiple logs on multiple machines, between the hardware, OS, and software, and you generally have to go looking for more information. Even if you have some of the best tools in the business, you are still looking in multiple places to find information about one problem and having to do things like sort by time to correlate events between the systems.

    To be certain, other vendors are offering hardware/OS diagnostics with their APM. But DataDog’s approach, adding APM from the infrastructure side (rather than the more common reverse scenario), will offer different insights. So I’m interested in seeing how DataDog’s offering pans out.

    I obviously haven’t had the chance to play with DataDog’s new functionality, but it is a space that very much interests me and one we as an industry do need more work in. So just the fact that DataDog is integrating these three monitoring layers is important. From here, it has a platform for adding things (security monitoring? Inclusive root cause analysis?) or increasing the quality and quantity of across-the-application, metal-to-user information available to Ops and for alerting. In fact, it disappoints me that actual infrastructure isn’t a core part of the APM Conceptual Framework, because the hardware under the VM that is hosting the app server for your app really does matter when performance degrades.

    At a minimum, APM can help you get from problem to solution somewhat faster. If done well, it can alert you to the problem and show you where it is, helping you get from problem to solution even more quickly.

    — Don Macvittie

  • Automation, ChatBots Can Improve DevOps

    Automation, ChatBots Can Improve DevOps

    At its heart, the goal of DevOps is to foster better communication between the development team and operations team at an organization. When these two teams are systematically connected, they can easily stay in sync on most issues and there is strong coordination in building and delivering the product to customers.

    Automation and ChatBots can play a big role in the connecting development and operations. They open the door for companies to go beyond simply being alerted when something happens in a chat application, allowing an employee to take action after receiving the alert either in an automated manner or by providing guidance to the employee on which actions to take.

    Automation: Creating Smart Alerts That Don’t Require Follow-Up

    Monitoring applications, systems, virtual machines and networks are a key part of any operations team. There are a number of tools that are used for this purpose, including CloudWatch, Splunk, Rollbar, Pingdom and Newrelic. These tools typically alert the operations teams when there are issues. Engineering teams, on the other hand, use tools such as JIRA and Github to track tickets and manage their agile development process. Alerts from the tools used by operations are helpful, but they still require some manual follow-up. For example, imagine a critical alert is reported by one of the tools because of a product issue. Follow up on this alert would require:

    • Creating a ticket in JIRA/Github with all the relevant information to help diagnose the issue.
    • Escalating that ticket so that it gets looked into right away.
    • Keeping the required people in sync as the status of the issue changes.

    This entire process can be automated. When automated, the workflow operates like this:

    • When the monitoring tool senses there’s something abnormal, like error rates above certain thresholds or a critical failure, alerts are sent and a ticket is created in JIRA or Github automatically with all the relevant information about the issue.
    • Taking this a step further, based on the type of issue, it can be automatically assigned to the right person and even post a message on the appropriate Slack channel.
    • As engineering works through the issue, everyone is automatically informed in Slack when the ticket is updated.

    The key to getting this scenario automated is to leverage an integration and automation platform that is powerful enough to handle complex workflows, yet easy to use so that these automations can be built in minutes. Users don’t want to work for your automations, they want their automations to work for them. With that in mind, the platform should also be flexible so changes can be made to the workflows without any engineering effort (i.e., an automation platform where integrations and automations can be built and changed without any coding).

    ChatOps: Monitor and Orchestrate via Chat Platforms

    With all the apps being used by DevOps, it is difficult for any team to stay on top of monitoring and managing issues while also taking actions across all these tools. Studies show that app hopping is not efficient and results in constant context switching, which negatively impacts productivity.

    ChatOps allows users to stay on top of everything including orchestrating workflows right from chat platforms such as Slack. To make ChatOps work, users need a bot that works in tandem with an integration and automation platform. The bot works with all business apps (even the tough ones with custom objects such as Github and Salesforce), is customized to meet the specific needs of the business and can extend to address all operational needs.

    Here are three ways users can leverage bots for better DevOps:

    Smart, actionable alerts: Rather than have a firehose of alerts coming in, users can define various thresholds, monitor velocity of alerts and, based on these settings, post an alert to the relevant channel or person on Slack. Bots can also prompt the person to take action based on the notification.

    Stop services, virtual machines: Bots can connect with any app, or service that has a HTTP/REST API. Not only can they monitor various apps and environments, they also can start and stop them.

    Workflow orchestration: Various workflows such as managing incidents, escalations and deploying code are all triggered and managed through Slack.

    Automating DevOps has significant benefits in overall increased engineering and operations productivity. The key to automation success is to select an integration and automation platform that is secure, resilient, can handle complex workflows, can be easily customized to meet the specific needs of the business and can be managed through Slack. It should be easy to use so automations can be built fast and changed easily as workflows change. Automation and ChatOps will streamline business workflow, keep the important players from both development and operations informed and increase productivity for everyone involved.

    About the Author / Gautham Viswanathan

    Gautham Viswanathan is the founder/head of products at Workato, www.workato.com. He also leads the team in creating Workbot For Slack, a bot designed to be customizable and allow you to do work in your apps right from Slack. Gautham has a deep background in integration platforms and was previously the head of products and engineering at TIBCO. Connect with him on LinkedIn.
     

  • Relevant Continuous Testing: The Primary Key to DevOps

    Relevant Continuous Testing: The Primary Key to DevOps

    My recent blog, “7 Pillars of DevOps,” identified seven essential best practices areas that make up successful DevOps and explained that the pillars are not silos, but rather foundations that need to be kept in balance. One of the pillars is continuous testing (CT).

    For well-balanced DevOps, CT performs tests that are fast enough to just fit within the time budget, yet thorough enough to cover the quality needed for deployment to production. Despite the need for balance, CT can be considered the true backbone of DevOps because testing is the one pillar that proves the validity of changes needed to operate and validate the correct operation of the other pillars from end to end across the pipeline.

    Compared to older testing strategies in which large software changes were tested as a complete product after “release to QA,” DevOps CT strategically tests changes incrementally over a series of DevOps stages. CT begins the moment a change is made in development and continues through all DevOps pipeline stages. Release readiness is judged on analysis of test results accumulated prior to deployment. With Blue-Green, A/B and Canary test strategies, some tests may continue into the live environment after deployment, and the results may influence future CT activities.

    Like continuous integration (CI), frequent, small, incremental testing has many merits. Quick feedback on problems enables a release consisting of many individual changes to be tested incrementally with confidence. The root cause of problems can be isolated much faster when the changes are tested incrementally. The problem is determining which tests are most relevant to run at each stage of a DevOps pipeline with content, with the risk of changes varying widely from one change to the next.

    Given that testing is a stochastic sampling process, there is no such thing as 100 percent testing in any absolute sense. Left unchecked, the content of tests will grow exponentially beyond the content of the product that is being tested. No number of test resources, even if elastic on-demand cloud infrastructures are used, will keep up with the growing demands to satisfy test requirements. The key is to create and choose tests that are most relevant to the changes that are being processed in the pipeline rather than attempting to run all tests with no regard to actual matter what the changes you wish to inspect. A strategy that chooses the most relevant tests at each stage in the pipeline is optimal.

    Several strategies for creating and selecting relevant tests are described below. These relevant test strategies may be used standalone for specific DevOps stages or a plurality of these relevant test strategies may be used end to end across the pipeline.

    1. Choose tests that focus on source code deficiencies. Metrics based on static analysis scans can determine which areas of source code have the highest number of defects. Test creation and selection algorithms can provide higher weight to tests written for those areas. This seems like a good idea; however, there are several limitations. Scan tools are limited to specific languages, may miss critical defects and do not have intelligence regarding the systemwide relevance of a specific defect.
    2. Create and choose tests for areas of the code with low test coverage. This also sounds like a good idea, but it is not. The most obvious reason is that tests probably are not available to select or the coverage would have been higher in the first place. Also, code coverage algorithms, especially at the system level, are limited to simple metrics such statement coverage, which is not a good indicator of system-level performance.
    3. Create and choose tests that match the artifacts of build changes including build dependencies. In this approach, tests are mapped to build changes and tests are selected that match the changes. This sounds logical, but unfortunately, a static mapping between test and build artifacts may not reflect system impacts of changes, as critical failures may occur due to interactions with modules outside the build dependency chain.
    4. Create and choose tests per risk analysis. This approach keeps a running record of code changes correlated to test results. Tests that tend to fail the most when a code module is changed are selected. This approach has several advantages over the other approaches. Test selection is not limited to implementation language or build dependency maps. Empirical experience correlates to risk better than code structures in the stochastic context of testing. The same algorithms can be applied to every stage in the pipeline. And the pipeline metrics can be adjusted dynamically for each pipeline stage run.

    The above CT practices indicate that relevant testing strategies reduces the time for CT execution and reduces the infrastructure cost for CT, without sacrificing quality delivered to production.

    Summary

    What do you think? Do you agree with the above relevant continuous testing practices? Are there others you recommend?

    While DevOps implemented with all seven pillars provides a strong foundation for long-term enterprise business improvements, it is important to understand DevOps is not an island. Enterprises implementing DevOps should be aware that DevOps interoperates with other IT systems and practices. Enterprises are well-advised to put in place governance policies that encourage the selection of tool-agnostic IT partners with solutions that best suit the needs of each unique enterprise and can integrate and evolve DevOps together with all their IT systems.

    — Marc Hornbeek

  • Automation: Achieving Faster Rollouts with Better Accuracy

    Automation: Achieving Faster Rollouts with Better Accuracy

    A changing landscape requires new processes

    At the recent Symposium/ITxpo, Gartner shared a list of technologies and trends that will be important for organizations to embrace and prepare for in 2017. These trends, which are listed in the report, “Top Strategic Predictions for 2017 and Beyond: Surviving the Storm Winds of Digital Disruption,” reinforce the breadth of technology that IT must support, roll out and engage with. This includes everything from the 100 million consumers who will shop using augmented reality to dealing with the roughly 21 billion endpoints expected to be in use in 2020.

    The report also demonstrates how fast technology changes directions. For example, Gartner predicts that in 2019, 20 percent of brands are expected to abandon their mobile apps. “Many brands are finding that the level of adoption, customer engagement and return on investment (ROI) delivered by their mobile applications are significantly less than the expectations that underpinned their app investment,” the report notes. However, this doesn’t mean less work. IT departments continuously have shift gears to support new processes, news apps and new technologies, such as the Internet of Things (IoT) and the massive amount of data that it produces.

    The dynamic needs of today’s businesses are driving organizations to increasingly adopt new technologies and applications that oftentimes don’t play nice with the existing set of infrastructure and legacy systems in place. So, while it’s clear that the technology landscape is changing, what isn’t so obvious is how IT and business decision makers should be adapting to an industry that is in constant motion.

    In-Steps DevOps

    To keep up, IT must implement agile methodologies that can adapt quickly to market changes. The DevOps mentality is making its way into many organizations and involves the development team creating, building and evolving products to ensure the organization is up to date, while the operations team confirms everything is running smoothly prior to a launch going live. This level of checks and balances isn’t just a nice to have, it’s a necessity—one mistake and the entire system can be brought down. Fostering a greater level of collaboration between development and operations makes it possible to efficiently and effectively build, test and correct new features and new products.

    While the shift to a more collaborative environment between the Dev and Ops teams can take time, using modern IT automation solutions can make this transition easier. Such solutions automate many of the routine—and even not so routine—elements of the application release process within DevOps. Many of the actions necessary to move from code to production—not to mention maintenance, testing and cleanup tasks—can be taken off the backs of developers and operations, saving them time so they can focus on higher-level projects and reduce manual errors.

    Finding the Balance Between Speed and Accuracy

    In 2012, Facebook announced it was increasing the speed at which it released code to twice a day, every day. As Chuck Rossi, director of Release Engineering at Facebook said, his team follows the advice “ship early and ship often.” Facebook continues to follow this model, and while the company certainly didn’t invent it, the model has caught on and is spreading among companies developing virtually every type of technology. The catch? It’s an incredibly time-intensive process and not every company has the resources necessary for a dedicated release team. Plus, a true shift to DevOps doesn’t happen overnight, especially since there is a ramp-up time for folks to get on board. For example, Phil Dibowitz, systems engineer at Facebook, told TechTarget that it “led its Chef team through a three-year process to rethink configuration management to scale on par with the web-scale company’s data centers.”  This took three years, he said, “not because of the technological change, but because of the structural change.”

    A slow transition to a new technology or new way of operating is a common occurrence because historically the production systems are cordoned off from development groups. While the Ops team has to ensure the rollout will meet certain standards, the Dev team wants to speed the process to begin the final rollout process as soon as possible. A happy medium exists, but if it isn’t found, things can go very wrong. Unfortunately, 2015 gave us two major examples of what can go wrong if products can’t speak to each other and rollouts are completed too early: Remember the New York Stock Exchange and United debacles?

    Breaking Constraints Through Automation

    This is where modern workload automation comes into play. Automation and solid change management allows IT to flexibly add on new technologies with automated processes for building, testing, upgrading and configuring IT—all while reducing the slack time between various steps. For instance, a workload automation solution should be able to trigger a build, deploy the build to the test environment, run the test suite and, assuming testing meets acceptable criteria, promote the build to production. If something does go wrong, necessary remediation can occur, and through monitoring and alerting capabilities, the required parties can be notified proactively.

    Additionally, automation solutions with pre-built integrations make it easier for disparate applications to communicate, creating an end-to-end approach to workflow creation and maintenance. As a result, IT organizations can minimize the risk of business disruptions and achieve a more fluid technology delivery to the business.

    Although it’s not a silver bullet that will solve all DevOps transition issues, automation does reduce manual intervention, which leads to fewer delays and errors and improves speed at which tasks are completed. However, beyond the technological aspects, there must be a clear understanding by both sides (the Dev and Ops group) on what their counterparts need—and this requires a high level of trust and coordination.

    While the specifics around the DevOps methodology certainly will change, automation will remain a critical piece of the process. With IT automaton, DevOps teams are able to refocus on critical IT business and operational processes, thereby reducing delays, decreasing errors and improving the speed at which tasks are completed. Ultimately, automation makes it possible to increase the speed of product releases and enable companies to stay ahead in the age of unpredictable customer preferences and ever-changing technological developments.

    About the Author / Mehul Amin

    Mehul Amin, a 21-year veteran of Advanced Systems Concepts Inc. (ASCI), previously held roles as product engineer and technical support manager and played an integral part in building the company’s workload automation solution, ActiveBatch. In his current role as director of Engineering, Mehul drives high-profile initiatives and leads both the Product Engineering and Release Engineering teams. Mehul received a master’s in computer science from the Stevens Institute of Technology.

  • An Operational Approach to Benchmarking Microservices

    An Operational Approach to Benchmarking Microservices

    Benchmarking microservices often falls behind on the engineering team’s to-do list. However, those that aren’t are missing out on a key component. The fundamental goal of benchmarking is to better understand the software, and test out the effects of various optimization techniques for microservices. In this post, I’ll describe an effective approach to benchmarking microservices.

    First, create a spreadsheet for tracking your benchmarking. One convenient way to document a series of benchmarks is in a Google Spreadsheet. It allows collaboration and provides the necessary features to analyze and sum up your results. Structure your spreadsheet as follows:

    • Title page
      • Goals
      • Methodology
      • List of planned and completed experiments (evolving as you learn more)
      • Insights
    • Additional pages
      • Detailed benchmark results for various experiments

    Then, before you engage in benchmarking, clearly state (and document) your goal. Examples of goals are:

    • “I am trying to understand how input X affects metric Y”
    • “I am running experiments A, B and C to increase/decrease metric X”

    Next, pick one key metric, stating clearly which one metric you are concerned about and how the metric affects users of the system. If you choose to capture additional metrics for your test runs, ensure that the key metrics stands out.

    Now, you’re going to have to think like a scientist and perform a series of experiments to better understand which inputs affect your key metric and how. Consider and document the variables you devise and create a standard control set to compare against. Design your series of experiments in a fashion that leads to the understanding in the least amount of time and effort. You’ll then need to define a methodology for running your benchmarks. It is critical your benchmarks be:

    • Fairly fast (several minutes, ideally)
    • Reproducible in the exact same manner, even months later
    • Documented well enough so another person can repeat them and get identical results

    Document your methodology in detail. Also document how to re-create your environment. Include all details another person needs to know:

    • Versions used
    • Feature flags and other configuration
    • Instance types and any other environmental details

    In most cases, to accomplish repeatable, rapid-fire experiments, you need a synthetic load generation tool. Find out whether one already exists. If not, you may need to write one. Understand that load generation tools are at best an approximation of what is going on in production. The better the approximation, the more relevant the results you’re going to obtain. If you find yourself drawing insights from benchmarks that do not translate into production, revisit your load generation tool.

    It is then important to validate your benchmarking methodology, and repeat a baseline benchmark at least 10 times and calculate the standard deviation over the results. You can use the following spreadsheet formula:

    =STDEV(<range>)/AVERAGE(<range>)

    Format this number as a percentage, and you’ll see how big the relative variance in your result set is. Ideally, you want this value to be less than 10 percent. If your benchmarks have larger variance, revisit your methodology. You may need to tweak factors like:

    • Increase the duration of the tests.
    • Eliminate variance from the environments.
      • Ensure all benchmarks start in the same state (i.e. cold caches, freshly launched JVMs, etc).
      • Consider the effects of Hotspot/JITs.
    • Simplify/stub components and dependencies on other microservices that add variance but aren’t key to your benchmark.
      • Don’t be shy to make hacky code changes and push binaries you’d never ship to production.

    Important: Determine the number of results you need to get the standard deviation below a good threshold. Run each of your actual benchmarks at least that many times. Otherwise, your results may be too random.

    Now that you have developed a sound methodology, it’s time to gather data. Some tips include:

    • Only vary one input/knob/configuration setting at a time.
    • For every run of the benchmark, capture start and end time. This will help you correlate it to logs and metrics later.
    • If you’re unsure whether the input will actually affect your metric, try extreme values to confirm it’s worth running a series.
    • Script the execution of the benchmarks and collection of metrics.
    • Interleave your benchmarks to make sure what you’re observing aren’t slow changes in your test environment. Instead of running AAAABBBBCCCC, run ABCABCABCABC.

    Now, you’ll need to create enough loads to be able to measure a difference. There are two different strategies for generating load:

    1. Redline it! In most cases, you want to ensure you’re creating enough load to saturate your component. If you do not manage to accomplish that, how would you see that you increased its throughput? If your component falls apart at redline (i.e. OOMs, throughput drops, or otherwise spirals out of control), understand why, and fix the problem.
    2. Measure machine resources. In cases where you cannot redline the component, or you have reason to believe it behaves substantially different in less-than-100-percent-load situations, you may need to resort to OS metrics such as CPU utilization and IOPS to determine whether you’ve made a change. Make sure your load is large enough for changes to be visible. If your load causes 3 percent CPU utilization, a 50 percent improvement in performance will be lost in the noise. Try different amounts of load and find a sweet spot, where your OS metric measurement is sensitive enough.

    As you execute your benchmarks and develop a better understanding of the system, you are likely to discover new factors that may impact your key metric. Add new experiments to your list and prioritize them over the previous ones if needed.

    In some instances, the code may not have configuration or control knobs for the inputs you want to vary. Find the fastest way to change the input, even if it means hacking the code, commenting out sections or otherwise manipulating the code in ways that wouldn’t be “kosher” for merges into master. Remember: The goal here is to get answers as quickly as possible, not to write production-quality code—that comes later, once we have our answers.

    Once you’ve completed a series of benchmarks, take a step back and think about what the data is telling you about the system you’re benchmarking. Document your insights and how the data backs them up. It may be helpful to:

    • Calculate the average for each series of benchmarks you ran and to use that to calculate the difference (in percent) between series — i.e. “when I doubled the number of threads, QPS increased by 23 percent on average.”
    • Graph your results — is the relationship between your input and the performance metric linear? Logarithmic? Bell curve?

    Finally, you’ll need to present your insights. Here are some final tips for exhibiting to management and/or other engineering teams:

    • Apply the Pyramid Principle. Engineers often make the mistake of explaining methodology, results and concluding with the insights. It is preferable to reverse the order and start with the insight. Then, if needed/requested, explain methodology and how the data supports your insight.
    • Omit nitty-gritty details of any experiments that didn’t lead to interesting insights.
    • Avoid jargon, and if you cannot, explain it. Don’t assume your audience knows the jargon.
    • Make sure your graphs have meaningful, human-readable units.
    • Make sure your graphs can be read when projected onto a screen or TV.

    — Stefan Zier