Category: DevOps and Open Technologies

Editorial Calendar for February 2016

  • Open Mainframe Project Pushes Zowe Platform Into LTS

    Open Mainframe Project Pushes Zowe Platform Into LTS

    The Open Mainframe Project (OMP) announced this week that a long-term support (LTS) edition of Zowe, the open source integration platform for mainframes running z/OS, is now generally available.

    Announced at the virtual Open Source Summit, this edition of the framework for integrating administration, management and development tools based on web technologies will not be updated again for the next 24 months. OMP, an arm of The Linux Foundation, will continue to update other editions of Zowe for IT organizations that want to incorporate new capabilities as they are made available.

    John Mertic, director of strategic programs at The Linux Foundation, said the LTS edition of Zowe is required because many IT organizations that have mainframes will only deploy software that is guaranteed to be stable enough to require only a minimal number of patches and updates for an extended period of time.

    Launched last year by Broadcom, IBM, Phoenix Software and Rocket Software, the Zowe framework consists of a web user interface (UI) that provides a virtual desktop that includes applications to access a 3270 terminal and a VT Terminal, as well as an editor and explorers for working with JES, MVS Data Sets and Unix System Services. Additional features include an application programming interface (API) mediation layer that provides a gateway that acts as a reverse proxy for z/OS services along with a catalog of REST APIs and a command-line interface (CLI) that enables developers to remotely interact with mainframe via a variety of tools. Via the API Mediation Layer, Zowe also provides access to a single sign-on framework.

    The Zowe framework is part of a broader initiative to make z/OS more accessible. Rather than requiring IT teams to acquire and retain specialized skills, IBM and the rest of independent software vendors (ISVs) that make up the mainframe ecosystem have been modernizing tools and processes as part of an effort to make mainframes running z/OS much like any other platform an IT organization deploys application on. IBM, for example, this month updated the DevOps tools for z/OS it provides using container technologies that encapsulate IBM middleware. That approach makes it easier to build and test z/OS applications using x86 platforms.

    At the same time, IBM is working toward making Kubernetes available on zOS in addition to researching the feasibility of running COBOL applications natively on that platform.

    Historically, mainframe applications have been built using mainly waterfall-based processes. However, as organizations launch digital business transformation initiatives, there is a growing need for DevOps tools and processes that enable z/OS applications to be built and updated faster. Using existing waterfall processes, often it can take IT organizations more than a year to build, test and deploy an application.

    It’s not clear to what degree IT organizations managing mainframes will abandon waterfall-based processes in favor of DevOps. However, as the pressure to become more agile continues to mount, it’s now more of a question of how much organizations should embrace DevOps, rather than if or even when.

  • How to Use Microservices To Evolve DevOps Pipelines

    How to Use Microservices To Evolve DevOps Pipelines

    Enterprises are quickly becoming an intricate mesh of many applications. As companies create more and more microservices, their deployment environments are becoming increasingly elaborate. Without proper configurations, a microservices road map could quickly become unmaintainable.

    According to DeployHub CEO Tracy Ragan, if development teams are pushing points to a cluster continuously, application development can suffer without high visibility into their dependencies and application interrelationships.

    In her recent talk, “Evolving Your Pipeline for Microservices with DeployHub,” presented by the Continuous Delivery Foundation (CDF), Ragan, also Governing Board member of CDF, discussed ways in which teams can obtain improved insight into microservices delivery pipelines.

    Microservices Tracking Issues

    A 2018 study conducted by O’Reilly found that 86% of respondents reached mild success in adopting microservices in production. Only 15% reported “massive success.” These results demonstrate both the excitement surrounding microservices and the rarity of flawless execution.

    “I’m a huge fan of microservices,” said Ragan. “This is an exciting time to be in software development.” Microservices break from the traditional software delivery model, she said, forcing teams to emphasize the runtime. However, with this shift, it becomes easy to lose the logical views between applications.

    According to Tracy, dependency tracking and version control are top issues in maintaining microservices arrangements. With continuous updates, it can be challenging to keep track of which version a service is using. “Microservices development falls apart without a coherent management approach,” she said.

    Losing Visibility Moving From CI to CD

    Part of the loss of visibility stems from the move from CI to CD. Continuous integration (CI) involves routinely updating source code and starting the compile process. This is often done every hour, as opposed to every week or month. With traditional CI, the system created a package and scanned for dependencies at compile. This was the first step in the continuous journey.

    However, nowadays, microservices are typically linked at runtime or in the Kubernetes deploy file as part of a continuous delivery (CD) processes. In doing so, we’ve lost a certain amount of visibility that CI granted. Ragan likened it to “hammering a wine glass”—we still have the constituent parts, but they lie shattered in pieces.

    Large microservices suites of 50, 100 or even 300 are not uncommon these days. Such large ecosystems require logical tracking of versions and dependencies. Ragan argued that development teams need a workaround layer to replace the critical configuration management lost in CI compile reports. Visibility into interrelationships is necessary to trace how changes in one service will impact other applications.

    Enter Ortelius

    Ortelius is a package that helps with continuous microservices management. Ortelius, named after Abraham Ortelius, the inventor of the first atlas, helps trace the connections between services to improve an ecosystem’s visibility.

    To get an idea of how it behaves, consider an e-commerce store. To reach an evolvable microservices pipeline, each microservice should be independently deployable with its own workflow. For example, an e-commerce store may require a product microservice, payment microservice and an authentication microservice. These reusable components are independently deployable but rely upon one another to function as a whole.

    At a macro scale, an enterprise with thousands of inter-application dependencies would visually resemble a constellation of nodes. An extreme example of this may resemble the Netflix Death Star, a mass conglomeration of intersecting points. Ortelius grants transparency into an otherwise tangled mess as an “internal marketplace for microservices,” said Ragan.

    Paring Ortelius With DeployHub

    Ortelius is the open source core of DeployHub, an open source SaaS for sharing and releasing microservices. Ortelius, paired with DeployHub, enables teams to see the logical application map, exposing the complexity of microservices dependencies.

    Developers add DeployHub to any existing microservice development workflow prior to release. Ortelius is then called to increment the service and record dependency information. DepoyHub then uses for Helm or Ansible for the actual code push, and adds the record metadata and adds the tracking and mapping layer. Having such information is still critical for reporting like dif reports or a bill of materials report, noted Ragan.

    This sort of solution, Ragan proposed, is also vital for continuous configuration management—when a microservice changes, the team will always be aware of the new application version.

    The New Microservice Pipeline Model

    As noted above, in the traditional model, DevOps teams map dependencies in the CI stage. When an API developer publishes to the main catalog, they define specific attributes based on the microservices. A versioning engine will then typically map to visualize dependencies.

    Ragan outlined steps for a new microservices pipeline:

    1. Build image: Compile and build the container image.
    2. Put into registry: Quay or Docker registry. Specific for container registries.
    3. Track service-application configurations: This is where we collect configuration data to map the structural relationships.
    4. Push to cluster: DeployHub helps to standardize this process across an organization.
    5. Collect feedback: Configuration reporting and impact analysis.

    Core to this process is being able to independently deploy microservices and aggregate useful information. Of course, this is an incomplete model—a complete pipeline would utilize other steps including testing and automated security scanning as well.

    Benefits

    By streamlining the microservices journey in this way, repos will be broken out and teams no longer go through one big long workflow. According to Ragan, the visibility garnered from this method could help organizations in multiple other ways:

    • Reduce time: Ragan estimated automated application relationship mapping could replace one to two hours of manual work per week per development team.
    • Reusability: Decomposing applications into their domains aids reusability across an organization.
    • Avoid redundancy: Code sharing can significantly reduce duplicated code, thus avoiding redundancy and increasing flexibility.
    • Visibility: Detailed application to service relational knowledge could empower SREs to make better data-driven decisions.
    • Centralize: Helps standardize container deployment processes regardless of cluster type or collection, aiding both traditional and containerized microservices deployments.
    • Versioning: Improved insight into versioning helps when you need to share services externally.

    Lastly, what’s nice is Ortelius is open source on GitHub. Ortelius adopts an open community format to accept feedback. “Democratization is the core reason we have open source,” said Ragan. Ortelius can be used for free, or with added features from DeployHub pricing for enterprise cases.

    A Confluence of Software Delivery Styles

    Managing continuous software delivery across many microservices leads to unprecedented issues. In solving these issues, the industry appears to be fracturing slightly. For example, the model promoted by Ragan is in contrast with a recent presentation I covered from Codefresh.

    Where Ragan suggested improving visibility into independent microservices deployment pipelines, Dan Garfield of CodeFresh suggested adopting a single CI/CD pipeline to operate all microservices from a single control plane. As it goes so often in software tooling, the use case will likely dictate adoption.

    Whatever the software delivery process, when decomposing applications—or “taking the hammer to the wine glass,” as Ragan called it—we probably shouldn’t sacrifice visibility into the metadata associated with application versions and service to application interrelationships. If such data is lost or not managed correctly, we could lose a lot of potential value.

    For more information on evolving DevOps pipelines, watch the CDF-presented webinar here. DeployHub also published an adjacent article on this subject here. You can also contribute to Ortelius on GitHub.

  • Kong Donates Kuma Service Mesh to the CNCF

    Kong Donates Kuma Service Mesh to the CNCF

    The Cloud Native Computing Foundation (CNCF) announced today it has accepted the open source Kuma service mesh developed by Kong as a sandbox level project.

    At the same time, Kong announced an update to the service mesh for monolithic and microservices-based applications that makes it easier to deploy multi-tenant instances of Kuma across multiple types of networking environments.

    A service mesh provides a layer of abstraction across networking environments that simplifies the deployment of distributed applications. Rather than having to manually configure each application service for a specific network, the service mesh automatically routes application traffic across multiple network underlays.

    Kuma is based on Envoy, an open source proxy server developed under the auspices of the CNCF. Kuma will be the second service mesh project that CNCF has accepted after Linkerd. However, Linkerd is not based on Envoy, so the CNCF is adding another service mesh project.

    Kong CTO Marco Palladino said Envoy provides an opportunity to create a lighter-weight service mesh that is easier to deploy across a distributed computing environment.

    Arguably, the best-known instance of a service mesh is Istio, which was developed by Google, IBM and Lyft for Kubernetes clusters. Istio, however, is complex to deploy and manage, and it hasn’t come under the auspices of any open source consortium.

    Palladino said given the popularity of Envoy, it only makes sense to add a service mesh that is both lighter-weight, scales better and is more extensible. For example, the latest release of Kuma adds support for global/remote control plane replication across hundreds of thousands of data plane proxies, he said.

    Also added was an ingress data plane mode that automates cross-platform and cross-cluster service mesh communication and a native universal DNS service discovery application programming interface (API) that makes it appear multiple services are all sharing the same cluster.

    As a sandbox-level project managed by the CNCF, Kong is now inviting other organizations to contribute to the development of the Kuma service. It remains to be seen which service meshes will eventually gain broad support. In addition to Kuma, Istio and Linkerd, the open source Consul service mesh from HashiCorp is vying for support. There are other proxy servers as well, such as NGINX, on which service meshes can be constructed.

    Very few IT organizations have deployed any type of service mesh in a production environment. However, as the number of microservices being deployed steadily increases, IT organizations need an easier way to enable applications to invoke network resources. Kuma provides a service mesh to address that issue that can be employed by both emerging microservices-based applications and legacy monolithic applications.

    Kuma also makes it possible to more easily secure traffic, establish service connectivity permissions and capture metrics using a combination of routing rules that can be set using APIs, says Palladino. It also comes with out-of-the-box policies for the most common service mesh use cases.

    Service meshes should also play a major role in the eventual convergence of network operations (NetOps) and best DevOps practices. Network specialists still will be needed to deploy the physical network underlay. However, network services themselves are becoming a virtual abstraction that developers can invoke within the parameters of policies defined by a central IT organization.

    The challenge now is advancing service mesh platforms to the point where the average enterprise IT team is capable of deploying and managing them.

  • How to Minimize Latency and Its Impact on UX

    How to Minimize Latency and Its Impact on UX

    Latency can have an enormous impact on user experience. Here’s what you need to know to mitigate latency before it impacts your customer experience

    Businesses have been digitizing for decades, but recent events have accelerated the process beyond all expectations. Customers are now using more digital services than ever, and their switching costs are often extremely low. That puts enormous pressure on businesses to deliver not just online services but also consistently high performance. Businesses that once measured performance in seconds now measure it down to the millisecond and even the microsecond. For that reason, they’re eager to minimize latency and its impact on their bottom line.

    Latency can be defined as the delay before a transfer of data begins following an instruction for its transfer. However we define it, its effects are clear: A study by Amazon found that 100 milliseconds (ms) of latency cost 1% in sales. A similar study by Google found that a half-second (500 ms) lag in returning search results reduced traffic by 20%. A study by Loadstorm shows that latency can have similar effects on any business’s conversion rates. Long latencies lead to abandonment of shopping carts and frustrated users leaving your site to find the same information, product or service elsewhere.

    The moral: As businesses try to convert users and move them through their pipeline, latency can be the greatest enemy. But how do you measure it, and what can you do about it?

    Measuring Latency

    Given the impact of latency on the user experience, it’s surprising how many businesses don’t give it enough attention—or even measure it properly. A common mistake is to focus on average performance, which is ultimately a theoretical measurement that might not reflect actual end user experience.

    A better, more meaningful, way to measure real-world latency is with percentiles.

    Latency is typically calculated in the 50th, 90th, 95th, and 99th percentiles, commonly referred to as p50, p90, p95, and p99. Imagine 10 latency measurements: 1, 2, 5, 5, 18, 25, 33, 36, 122, and 1000 milliseconds (ms). A p50 measurement represents the median performance of the system. In this case, the p50 measurement is 18 ms, meaning 50% of users experienced that latency or less. The p90 measurement is 122, meaning that 9 of the 10 latencies measured less than 122.

    Each measurement within a given percentile reflects a real latency that actually impacted the experience of at least one, but likely many more end users.

    By contrast, the mean of our 10 measurements comes to roughly 125 ms, not even close to the midpoint in the observed data–in fact, slightly above the 90th percentile.

    It is vital to keep in mind the outliers, what are called “long-tail latencies.” Under real-world conditions, p99 (and higher) latencies are often the ones you need to worry about most.

    Gil Tene, the CTO of Azul Systems, addresses this problem in his presentation, “How NOT to Measure Latency.” He notes that p99 latencies can easily impact a far larger than expected proportion of users. If a typical user session involves five page-loads, averaging 40 resources per page, about 18% of users will experience at least one response longer than even the p99.9. He also points out that the average response percentile is experienced by more than 95% of users will be the p99.97 latency.

    As Google engineer Luiz André Barroso put it:

    “When a request is implemented by work done in parallel, as is common with today’s service-oriented systems, the overall response time is dominated by the long tail distribution of the parallel operations. Every response must have a consistent and low latency or the overall operation response time will be tragically slow.”

    In other words, the slowest operation in a set of parallel operations usually defines the user experience. It doesn’t matter that 99% of the operations finish quickly if the other 1% holds everything up. This explains why it’s not enough to keep p95 latencies blazing fast. You have to keep long-tail latencies (p99 and up) consistently low as well.

    Causes of Long-tail Latency

    To fix the problem of long-tail latency, we need to understand why it occurs. Long-tail latency has many causes, but, significantly, it is not usually caused by application-specific problems or normal network lag. Instead, long-tail latency has systemic causes, usually related to problems in the underlying infrastructure. These can include pauses due to Java Virtual Machine (JVM) “garbage collection,” context switches, database repair, cache flushes and so on. This makes long-tail latency very tricky to diagnose and fix, as it’s often a “whack-a-mole” exercise.

    Disk I/O and Network Bottlenecks

    The main causes of long-tail latency are network and system bottlenecks. IT commonly invests heavily in the best components available: great solid-state drives (SSDs, and associated NVMes), CPUs and memory. But it often shoots itself in the foot by configuring a “narrow” network that bottlenecks all that highly performant hardware.

    SSD settings are also commonly misconfigured. Cloud SSDs have two associated throttles: burst and sustained. Background operations such as streaming and compaction can chew up the sustained throughput, which may be 1/10 of burst. While the backend process hogs I/O, there is no capacity left for frontend, user-induced operations. While some transactions will be able to use the burst capacity,  the steady-state frontend traffic will start backlogging and eventually time out.

    Speed Mismatch

    Database performance is strongly influenced by the combined speed of CPU and memory on the one hand and disk speed on the other. CPU tends to be faster, while disk tends to be slower. SSDs are catching up with CPUs, but the rule still generally holds.

    Speed mismatch is a more common problem with write workloads bounded by disk speed. This can happen either because the disk is slow or because the payloads are large. Large payloads shift the bottleneck to the disk. When the time comes to write to disk, any relative disk slowness will cause queries to back up in the buffer. This will result in outlier p99 latencies.

    Exceeding Your Latency Budget

    Every system is designed with a “latency” budget, which is the ratio of latency to throughput. p95 and p99 latency are a function of the throughput a given system is designed to support. You can think of this ratio in terms of highway traffic and throughput as the number of lanes on the highway. More lanes mean that the highway can support more vehicles, and hence more trips. That’s throughput. Latency is defined by the speed limit. Having many lanes combined with a slow top-speed reduces the overall number of trips. The ratio between the two defines the latency budget.

    Ideally, if you just add more throughput you should be able to reduce latencies, right? Well, not necessarily. Just like traffic on freeways can expand to fill an extra lane, still leaving you stuck in a traffic jam, you can easily overwhelm systems that weren’t designed well to begin with, even if you try to add more throughput. In fact, trying to add more throughput can degrade all of your latencies. In the routing world, that sort of poor architectural consideration is called bufferbloat.

    If a system is trying to add too much throughput while other bottlenecks still exist in a system, then you only end up with longer latencies, even to the point of transactions timing out. That can exacerbate a bad situation since all failed transactions will attempt one or more retries.

    Systems that handle big data have several considerations. These include the most obvious hardware-oriented factors; storage (the reason why NVMe SSDs are widely prevalent these days, for example), CPU cores, memory (RAM) and network interfaces.

    Modern servers running on Intel Xeon Scalable Processor Platinum chips are common across AWS, Azure and Google Cloud. Server needs are based upon how much throughput each of these multicore chips can support.

    Additional considerations get into how your database system was designed to handle data distribution and replication for high availability, peer-to-peer versus leader/follower designs, how it minimizes hops and redirects between servers, effective use of caching, how it efficiently it utilizes all the hardware available to it and so on.

    These are all components that define a system’s latency budget. It’s important to understand and stay within those limitations. When they are exceeded, outlier latencies are virtually assured to occur.

    Latency and the Database

    So far we’ve treated long-tail latency as a systemwide phenomenon. Now let’s consider the role of the database. Most HTTP and API requests result in at least one, if not more, database calls, often a mix of reads and writes. Hence, the database plays a central role in the end user experience of latency.

    NoSQL databases were invented specifically to address the need for low-latency, globally distributed data stores. The basic premise of the NoSQL database is the ability to “scale out” on cheap, commodity hardware. When more capacity is needed, administrators simply add servers to database clusters. This simplicity, however, has morphed into a vulnerability. Clusters often grow out of control, resulting in a phenomenon called “node sprawl.” The architecture of the first-gen NoSQL databases actively encourages larger clusters of less powerful machines. From the perspective of latency, this architecture virtually ensures inconsistent p99 performance due to more internode traffic, context switches, disk failures and network hiccups, all of which create latency outliers.

    One database that is particularly susceptible to this problem is Apache Cassandra. First, Cassandra is implemented in Java, making it vulnerable to pauses caused by garbage collection (GC). Some monitoring teams even have a dedicated metric devoted to GC stall percentage. Compaction and repair operations, which become more onerous in larger clusters, add to the outliers that plague Cassandra deployments.

    Second, Cassandra has limited ability to utilize modern hardware for compaction and streaming. Since Cassandra is an “append-only’ system, keeping data coherent for reads requires a compaction process. Servers with a large number of cores are readily available on public clouds, IaaS and for on-prem deployment. However, Cassandra can’t scale compaction linearly with the increased number of available cores, so it cannot effectively utilize those larger servers. This limitation results in higher read latency due to the need to deploy many more smaller servers in the clusters.

    Since Cassandra exposes settings for storage media, JVM heap cache and concurrency on read and writes, the burden is placed on administrators to properly configure the system for specific workloads. When workloads are unpredictable and spiky, administrators must constantly tune the Cassandra cluster to optimize read and write latencies.

    Many IT organizations turn to external caches as an aid to insulate end users from the poor long-tail performance of their databases. Caches are often used to enhance read performance but write latencies derive little or no benefit. Transactional systems, which depend on real-time performance, cannot drop mutations, so caches offer no help. Transactional systems depend on low long-tail latency for writes as well as reads. If spikes are too frequent, the client experience deteriorates, becoming very sluggish.

    Still, front-end cache for reads is often a necessary evil, to the point where it is treated as obligatory. However, maintaining coherence between cache and persistent storage is a well-documented hassle that can easily bog down operations and negatively impact customers. The best approach is to identify a system that intrinsically combines cache and persistent storage in a way that optimizes performance and data integrity.

    Winning the Battle for Consistently Low Long-Tail Latency

    With these issues in mind, there are a number of guidelines your organization can follow to minimize long-tail latency.

    • Design a system that ensures the lowest p99 latency based on your organization’s current and future throughput targets.
    • Don’t ignore performance outliers. Embrace them and use them to optimize system performance.
    • Reduce the number of components in your architecture, from redundant cache systems to bloated hardware infrastructure. Shrink database clusters by scaling vertically on more powerful hardware.
    • Adopt database infrastructure that scales linearly with your resources: CPU, memory, storage, network and number of nodes in the cluster.
    • When using database-as-a-service (DBaaS) offerings, look out for “scaling bloopers”—points at which you can’t scale linearly and have to increase spending beyond the marginal benefit you get from the system.
    • Make sure your DBaaS vendor can offer multi-region deployments, so you can utilize the offering near your application, eliminating long-haul data traffic. While this will not reduce latency within a database, it will reduce end-to-end database latency between the database and the client application.

    Latency often gets short-shrift in IT calculations because it’s so poorly understood and so badly measured. But you can’t ignore it. It does its damage whether it’s recognized or not (and the less you recognize it, the worse damage it does). Luckily, as we’ve seen, there are good ways to measure latency and squash it down to size. With the right metrics and an informed strategy, businesses can turn what used to be a fearsome adversary into a customer-experience advantage.

  • Eclipse Foundation Touts Jakarta Progress

    Eclipse Foundation Touts Jakarta Progress

    The Eclipse Foundation today published the results of survey of 2,180 software developers that finds over half of respondents (55%) have adopted Java/Jakarta EE 8.

    In addition, the Eclipse Foundation is making available an update to the Jakarta Enterprise Edition (EE) specification that will move away from the javax namespace to embrace jakarta namespaces for all components.

    Jakarta EE 8 is essentially Java EE 8, which Oracle agreed would become open source software when it transferred ownership last year to the Eclipse Foundation. The transition from Java EE to Jakarta nomenclature remains a work in process.

    The Eclipse Foundation finds the use of Java technologies is in a state of flux across the board. For example, adoption of Java 11 now stands at 28%, while Java 14 adoption is at 11%, according to the survey. That compares to 64% that are still employing Java 8.

    Spring/Spring Boot at 44% adoption continues to be the leading framework for building cloud-native applications, compared to 35% using Jakarta EE and 16% for Red Hat Quarkus, a framework that runs natively on Kubernetes.

    Usage of Eclipse Che, an open source integrated development environment (IDE) for building applications on Kubernetes, now stands at 11%, the survey also finds.

    Mike Milinkovich, executive director of the Eclipse Foundation, said it’s clear organizations are now employing multiple frameworks to build Java applications, given a 13% drop in reliance on Spring/Spring Boot from last year’s survey results.

    However, the survey also finds that overall, the use of Java to build microservice applications has declined to 39% from 43% during the same period. That drop may reflect both the complexity of building microservices-based applications, given the fact that 25% of survey respondents said they are using Java to build monolithic applications, said Milinkovich.

    At the same time, some organizations may be opting to lift and shift existing monolithic Java applications into the cloud in response to the COVID-19 pandemic, he said, noting once redeployed, those organizations may then opt to modernize those applications using microservices.

    With access to many local data centers limited during the pandemic, many organizations may have decided the most prudent option was to lift and shift Java applications as they are than re-engineer them first, he added.

    There are currently 12 frameworks officially that are compatible with Jakarta EE 8, which Milinkovich said is indicative of the continued relevance of Java technologies for building applications both inside and out of the cloud. Now that Java is available as open source software, the level of innovation surrounding Java platforms will also accelerate, he said.

    There is still a large base of developers that rely on Java and by extension Jakarta to build enterprise applications. However, IT organizations now routinely employ a wide range of programming languages and platforms to build applications. Java is still the most dominant when it comes to building backend applications; however, many organizations are still evaluating their options when it comes to building cloud-native applications on platforms such as Kubernetes.

    Java in all its forms will, of course, be around for a long time to come. The only real question is how much organizations will continue to rely on it, in an IT world that continues to transform.

  • CNCF Elevates SPIFFE Spec to Secure App Services

    CNCF Elevates SPIFFE Spec to Secure App Services

    The Technical Oversight Committee (TOC) of the Cloud Native Computing Foundation (CNCF) announced that the open source Secure Production Identity Framework For Everyone (SPIFFE) specification and the SPIFFE Runtime Environment (SPIRE) have become incubation-level hosted projects.

    Andrew Harding, SPIRE maintainer and a principal software engineer at Hewlett Packard Enterprise (HPE), said the elevation of a potential standard to authenticate software services using cryptographic identities that are platform-agnostic could go a long way toward advancing the adoption of best DevSecOps practices.

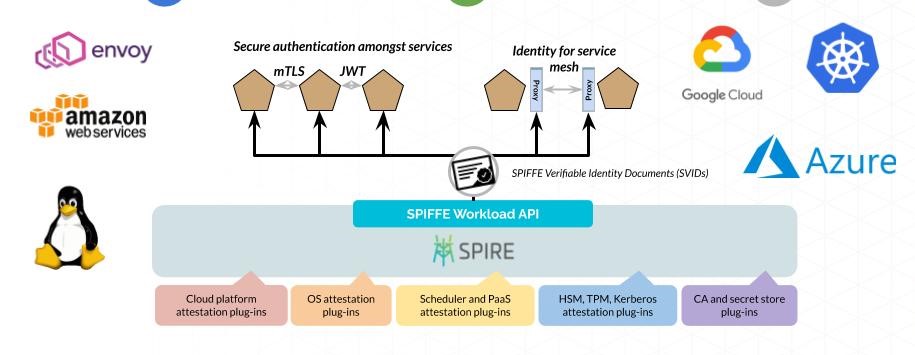
    At the core of SPIFFE specification are short-lived cryptographic identity documents known as SVIDs that are invoked via an application programming interface (API). Workloads employ an SVID when authenticating to other workloads by establishing a TLS connection or by signing and verifying a JSON web token (JWT).

    Previously a sandbox level project, the SPIFFE specification is designed to reduce reliance on hard-coded secrets to authenticate application services, Harding said. Instead, developers will be able to more easily invoke multi-factor authentication to issue and verify identities for any type of application service. Each service is given its own identity, he noted.

    Amazon, Bloomberg, Google, HPE, Pinterest, Square, TransferWise and Uber are all contributors to SPIFFE. Since joining the CNCF last year contributors to SPIRE have added support for Amazon Web Services (AWS), Google Cloud Platform (GCP), Microsoft Azure, Kubernetes and bare-metal servers.

    SPIFFE and SPIRE are designed to work across both monolithic and microservices-based applications. The latter are not likely to completely replace the former anytime soon, so IT organizations need a consistent approach to authentication regardless of how an application is built, noted Harding. SPIFFE and SPIRE together enable an IT organization to implement a zero-trust architecture spanning multiple applications, he said.

    Ultimately, Harding said the goal is to enable better application security without compromising flexibility. As an added benefit, SPIFFE and SPIRE don’t require developers to share application secrets to enable interoperability between services running on different platforms. That’s because SPIRE doesn’t generate SPIFFE identities that can be used to authenticate to other systems nor does it store existing keys such as a database password on behalf of a workload. Each SVID generated is unique to the service use case.

    As the number of services and platforms being employed continues to increase, it’s not practical to continue to rely on approaches to authentication that rely on hard coding. The level of dependency that exists between services requires a more frictionless approach to authentication.

    It may be a very long time before reliance on tokens such as passwords disappear. However, it’s clear specifications such as SPIFFE, in the long run, will transform application security. The challenge now is not only getting developers to appreciate a new approach but also convincing skeptical cybersecurity teams that long have relied on some form of hard or soft token to secure applications. Given the number of times those tokens are misplaced or lost, there are more than a few IT help desk professionals wishing tokens would become obsolete sooner than later.

  • DataStax Brings AIOps to Cassandra Database Management

    DataStax Brings AIOps to Cassandra Database Management

    DataStax today unveiled a private beta release of artificial intelligence tool dubbed Vector that provides advice on how to optimize clusters running the open source Cassandra wide column store database.

    Vector analyzes individual nodes and then compares behavior to other nodes in the cluster to identify opportunities to improve deployments.

    Ed Anuff, chief product officer for DataStax, said the goal is to enable IT teams to take advantage of AIOps for things such as improving performance and query techniques.

    Available for both instances of Cassandra downloaded by IT teams as well as the curated instance of Cassandra that DataStax makes available as DataStax Enterprise, Vector is intended to augment rather than replace IT teams managing Cassandra databases, said Anuff.

    Anuff said by employing algorithms and heuristics, Vector provides IT teams with predictive guidance, which they can determine whether to implement or not.

    As IT becomes more complex the need to rely on AIOps tools such as Vector is becoming more pronounced. The number of variables that could adversely impact the performance of applications deployed on Cassandra or any other database exceeds the ability of most IT teams to monitor manually. AIOps tools such as Vector essentially provide IT teams with a digital assistant to help optimize database deployments.

    Anuff said there will always be a need for a human to be in the loop, but each IT organization will determine the degree it trusts the recommendations being surfaced by AIOps tools such as Vector. In some cases, IT teams will use those recommendations to inform frameworks to automate the management of databases.

    Given the commitment to ruthless automation by IT organizations that have embraced DevOps, Anuff said DataStax expects DevOps teams to be at the forefront of embracing AIOps. In many cases, those DevOps teams have already assumed management responsibilities for both applications and the underlying databases on which they depend.

    Of course, AIOps is still in its infancy. However, in the wake of the economic downturn brought on by the COVID-19 pandemic interest in AIOps as a means to reduce the total cost of IT is rising. Many IT teams are becoming smaller as organizations downsize, while others are limiting headcount. AIOps provides a way to manage IT at scale without necessarily having to expand the size of the current IT staff.

    Regardless of the motivation, AIOps is here to stay. Many of the rote tasks that conspire to turn IT into drudgery should soon be eliminated. That may reduce the number of entry-level jobs that historically have been available. However, as schools adjust to this new reality, it may also mean that new entrants into the field may be able to take on more complex challenges sooner than later.

    In the meantime, IT professionals might want to consider what part of their job might be better handled by a machine and plan the next step in their careers accordingly.

  • The Linux Foundation Adds Free Jenkins Training Course

    The Linux Foundation Adds Free Jenkins Training Course

    The Linux Foundation, in collaboration with the Continuous Delivery Foundation (CDF), today launched a free introductory course to the open source Jenkins continuous integration/continuous delivery (CI/CD) platform as part of what it plans will become a series of free and paid online DevOps tools courses.

    Clyde Seepersad, general manager of training at the Linux Foundation, said that while the foundation already provides access to some higher-level conceptual DevOps courses, the launch of the CDF last year provides a knowledge base from which the Linux Foundation can now provide online courses specific to DevOps tools. The CDF is an arm of The Linux Foundation.

    The Linux Foundation will also provide courses on Spinnaker, a CD platform, and other DevOps tools that, along with Jenkins, are now being developed under the auspices of the CDF, he added.

    In general, Seepersad said demand for DevOps expertise is increasing as organizations more aggressively embrace digital business transformation initiatives in the wake of the COVID-19 pandemic. At the same time, IT teams are adopting a wider range of cloud-native technologies to build more flexible and resilient applications. DevOps platforms such as Jenkins make it possible for IT teams to build those applications faster.

    The challenge many organizations underestimate is the extent of changes to their internal IT culture required to make that transition, Seepersad said—too many organizations still put tools into the hands of developers without really thinking through the workflow issues between developers and IT operations teams.

    The most important thing for any organization to do, he said, is to make sure there is an open DevOps dialogue versus tiptoeing around issues that will tend to increase resistance only further.

    Ultimately, free training should help expand the overall size of the DevOps community at a time when many IT professionals are trying to increase their skills. DevOps professionals not only command higher salaries, but they are also less likely to be laid off. DevOps teams oversee the development and deployment of applications and can also programmatically manage levels of infrastructure that IT administrators relying on traditional graphical user interface (GUI) tools can’t match. That’s a critical issue when many IT organizations these days are trying to do a lot more with even less.

    There’s nothing quite like an economic crisis to focus everyone’s mind. The biggest DevOps challenge any organization typically faces is overcoming inertia. Too many IT professionals have relatively narrow skillsets that conspire to increase the total size of the IT organization. In addition to relying on increased levels of automation to reduce costs, IT leaders want to be able to scale IT environments without having to increase headcount.

    It may take a little while longer for the transition to DevOps to fully play out. However, it’s now more of a question of existential survival rather than if or even to what degree to embrace DevOps. Organizations that don’t embrace DevOps processes to ruthlessly automate the management of IT now might very well never get another chance.

  • Hasura Launches Beta of GraphQL-Based Remote Joins Tool

    Hasura Launches Beta of GraphQL-Based Remote Joins Tool

    Hasura today announced the public beta of Remote Joins, which makes use of an open source GraphQL query language for application programming interfaces (API) to join disparate data sources residing in different repositories.

    Company CEO Tanmai Gopal said Remote Joins extends a GraphQL engine the company has developed around a project that is now hosted by the GraphQL Foundation, an arm of the Linux Foundation. The GraphQL Foundation counts among its members Airbnb, Amazon Web Services (AWS), Apollo, Coursera, Elementl, Facebook, GitHub, IBM, Intuit Hasura, Paypal, Prisma, Shopify and Twitter.

    Originally developed by Facebook, GraphQL has emerged as the basis for a more streamlined alternative to REST APIs. GraphQL provides a complete description of the data made available via an API and is organized in terms of types and fields rather than traditional endpoints. In addition to making it more clear what data is available via that API, developers can employ types to avoid writing manual parsing code.

    Hasura is now taking that concept a step further by enabling IT organizations to join data residing in different databases and microservices to enable that data to be queried as if it were a single data source. The core Hasura engine automatically generates the GraphQL engine, which enables those remote joins to be created in a few minutes.

    Gopal said joining data across a complex portfolio of modern applications based on microservices and legacy monolithic applications is becoming increasingly difficult as the number of microservices in an IT environment continues to proliferate. The Hasura engine addresses that issue by providing data access and flow tool base on a GraphQL type system for managing APIs that can be applied to GraphQL APIs as well as REST APIs or other protocols, he said.

    The join, authorization logic and consistency checks are all managed by the Hasura engine. Hasura also provides data change management, observability, auditing, security and performance management capabilities. That approach makes it possible for data sources and APIs to evolve independently while still allowing organizations to query data flexibly, noted Gopal.

    As DevOps and DataOps processes continue to converge, IT organizations will need to find a way to advance application and API development in a way that doesn’t result in data access becoming a major bottleneck. Too many DevOps teams are rapidly building applications and APIs only to find themselves waiting to be given access to data. GraphQL could provide a foundation on which IT teams can manage DevOps and DataOps processes more collaboratively.

    It’s not likely IT teams will be replacing existing REST APIs wholesale overnight. However, it’s also apparent that REST APIs may not enable IT environments to scale as efficiently as GraphQL, which is the primary reason why Facebook developed it. Of course, it’s still early days as far adoption of GraphQL is concerned. However, with more IT teams under pressure to innovate faster, interest in a more streamlined approach to building and managing APIs is likely to gain additional momentum.

  • Camunda Extends Reach of BPM Platform

    Camunda Extends Reach of BPM Platform

    Camunda, a provider of a business process management (BPM) platform written in Java, this week added support for an open application programming interface (API) to make it easier to integrate its namesake software with applications written in Javascript/Node.js, Python and C#.

    Company CTO Daniel Mayer said at a time when many organizations are investing in digital business transformation initiatives, the latest updates to the Camunda BPM platform adds support for an OpenAPI standard advanced by The Linux Foundation to enable IT organizations to integrate business processes spanning modules created using different programming languages. In the case of Camunda, IT organizations will be able to generate a REST API client using their preferred coding language that can be integrated with the core Camunda BPM platform, he said.

    In addition, Camunda announced that version 7.13 of the Camunda BPM platform will be available in the form of a lightweight distribution, dubbed Camunda BPM Run, that can be deployed as a Docker container to create a standalone engine with no Java or application server knowledge required.

    Camunda has also added support for Camunda’s Optimize 3.0 to provide a unified view of real-time process insights from any data source and the ability to visually track changes across different versions of process models using its Cawemo tool.

    Finally, Camunda has added support for version 1.3 of the Decision Model and Notation (DMN) specification as well as version 1.2 of the Friendly Enough Expression Language (FEEL) defined by The Object Management Group.

    In the wake of the economic downturn brought on by the COVID-19 pandemic, many organizations are looking to reduce costs by streamlining business processes. The decision many of them need to make is determining to what degree they want to rely on packaged applications to achieve that goal versus a platform that enables them to create custom business processes. While many rote processes can be automated using packaged applications, Mayer said the Camunda platform makes it possible to create business processes that truly differentiate organizations from rivals. Packaged applications, in contrast, drive organizations to employ the same business processes in the same way.

    Of course, organizations can customize packaged applications. However, at that point, most of them will have embarked on an application development project that would be easier to complete using a platform designed for that purpose, he noted.

    Naturally, there are other platforms for integrating business processes that revolve around graphical user interfaces. Camunda has been making the case for an open source Java-based platform that enables developers to create and deploy custom business processes using best DevOps practices at a much lower total cost. The company also commercially makes available an enterprise edition of its platform. In total, Camunda claims there are now than 100,000 developers participating in the Camunda community.

    It’s too early to determine to what degree organizations will rely on packaged applications versus BPM platforms to drive digital business transformation initiatives. However, given the current economic climate, it’s apparent these projects have never been more urgent.