Category: Continuous Delivery

Continuous delivery is a software engineering discipline that allows organizations to consistently develop and release quality software at a rapid pace. It is achieved by automating the software development lifecycle, enabling tasks such as development, testing and release to occur concurrently and continuously.

  • How to Build a Team That Embraces Metrics

    How to Build a Team That Embraces Metrics

    When we talk about metrics in software delivery, a lot of developers think of execution metrics — things like throughput, delivery and number of deploys. But in reality, those metrics don’t motivate anyone — at least not without connecting them to a bigger picture.

    I’ve worked in software for 23 years. I’m a three-time founder and four-time CTO, responsible for leading a 200+ member distributed engineering organization. I’m passionate about metrics because they can tell me a lot about where things are working and where they are not. On the other hand, there’s a risk that operating metrics become the focus, taking attention away from measures of business value.

    Getting your developers to embrace metrics isn’t about hand-selecting specific metrics to track. It’s about disseminating the bigger picture and sharing measures of business impact that allow your team to see progress against those larger, shared goals.

    When developers understand how their day-to-day work directly impacts the company’s goals and vision, they’re able to understand their impact, too, and will want to do better. When they want to do better, they want execution metrics to get them there.

    Clarify Your Goals

    If you want your developers to not only track their metrics but be excited to use them, there are a few things you need to do first:

    • Get clarity on the goals you’re trying to accomplish as a team and as an organization
    • Figure out how you’re executing against those goals
    • Find out what’s getting in the way

    Developers shouldn’t be obsessing over execution metrics. Rather, you need them to understand what the company is trying to achieve. What is the outcome you’re aiming to deliver to customers and for the business overall?

    If your developers have clarity on the company’s mission and vision, they understand how their work directly impacts the customer and the success of the organization, which is highly motivating.

    Individual contributors will start asking for access to more information so they can diagnose their own problems and improve their work.

    Are we spending too much time on technical investment? Does it feel like we have too many incidents, issues and escalations from customers? Are we far off on our estimates? By answering these questions, your team can determine which metrics to track.

    Don’t Make These Mistakes

    Using one metric to rule them all. A lot of engineering organizations try to rally entire departments around the same execution metrics. Velocity, or throughput, for example, is a great tool to expose other issues, but consistent velocity is not a guarantee of delivering business value. In fact, targeting consistent velocity is likely to result in tradeoffs you didn’t anticipate, like taking shortcuts to get things out the door.

    Treating the metric as the goal. Meeting a metric shouldn’t be the goal; rather, metrics should be viewed as a way to ensure your team is meeting their goals. Organizing around business value is what really helps your team understand the purpose of their work. If you’re just rallying around how many times you can deploy per day, then sure, you can be an amazing software-deploying machine — but you might be deploying changes all day that have nothing to do with the actual goals of the business.

    Being a blocker. Developers need autonomy and flexibility to do their jobs well. Give teams a high-level objective and let them determine which metrics they need to push, instead of giving everybody the same metrics and telling them to get better.

    If engineers don’t have the autonomy to make their own decisions, then they’re going to feel like they’re just part of the machine. As engineers, and as humans, problem solving is what motivates us, along with the knowledge that our skills are contributing to a larger, shared goal.

    A Team That Embraces Metrics: Putting it Into Practice

    There are three channels that are essential to communicating business-value metrics to teams. At the company level, executives will introduce their high-level goals at all-hands meetings — where the company is trying to go this year, how you differentiate in the market — the things that really matter to a business.

    One level down, during organizational or department meetings, is where to communicate how teams should think about the goals from a product and engineering perspective, while still thinking about them within that overall business context.

    It’s also important that this is understood down through the management chain. An engineering manager should be able to explain to their team the overall business goals with local-level reinforcement and how it all ties together.

    When you have that knowledge as a team, you know what you’re capable of executing because you understand what you’re trying to achieve for the company and the customer. That’s when developers start asking for more metrics because they want to understand how to get there faster.

    If You’re Not Hitting Your Goals, You Should be Asking for the Data

    The only real failure is not learning from failure. It should be okay to not hit your numbers. Set a bold target and push yourself, then learn something from your misses. Figure out what you didn’t understand, what got in your way and why.

    Estimation is hard. Trying to plan work is hard. But if you know how much you were able to deliver last quarter, you can focus on getting something similar done this quarter instead of assuming this will be the one quarter where there are no interruptions, your initiatives will all be perfectly defined and nobody will get sick.

    If you’re not hitting your business goals and you’re not looking at your historical data, then you’re missing your opportunity to improve.

    Your Team Embraces Metrics. Now, How Do You Get Them Excited?

    The first time I started using continuous deployment (CD), I was truly amazed at how quickly it allowed my team to put new functionality into the hands of our customers. We could instantly find out if they liked it, and if they didn’t, we would build another version tomorrow.

    As an engineer, CD is a great way to feel more connected to your customers because you get to put something you built in front of them the same day you complete it. You also become interested in a different form of metrics: usage and adoption.

    The connection between your work and the ultimate value to the user is much clearer when the feedback cycle is shorter. CD allows you to get that feedback from customers directly and really see the impact you have on them. That gets people excited.

    There’s no Shortcut

    You can try to drive an entire organization by execution metrics, but it simply won’t be fulfilling for anyone. If your team is aligned around what they’re trying to achieve, they will recognize the value of execution metrics and they will come looking for them.

    There’s no shortcut.

    If you start with the reason and you end with the numbers, you know you’re on the right track. You’ll know you’re getting there because you’ll see the numbers moving, your team will be excited by that, and they’ll be motivated to do even better.


  • IT Ops Takes Center Stage

    IT Ops Takes Center Stage

    When people talk about the last 18 months, most will remember it as a disruptive time when nothing felt certain. Yet, for many IT Ops and network operation center (NOC) leaders, it was the year they stepped out of the darkness and into the spotlight. Suddenly, it mattered deeply who was maintaining those services we relied on to shop, work, eat, live – and it became clear that IT Ops teams – who were previously thought of only as the number you called for a password reset – had been keeping our businesses running all along.

    While there may have been some recognition before the pandemic, that awareness certainly gained momentum during 2020 and, now, shows no signs of stopping.

    As Ben Narramore, senior manager of operations with Sony Playstation Network said at a recent customer conference, “Today, I am able to talk to leaders across the company that I would never have talked to a year ago. They didn’t care about operations, they didn’t care about the NOC, didn’t care about incident management, and now they’re like, ‘Wow, this is great stuff,’” he said. “I’m excited right now. We’re at a place in operations where my team has evolved, doing more than just problem-solving.”

    I am excited to hear sentiments like that, because for the last 10 years or so, application development has been the golden child of IT. The faster you could crank out code, the faster the business could move. For years, every dollar and every resource went to building out amazing applications and services, leaving the IT Ops people to keep it all available and performing. Sure, some companies like Hulu and Expedia had the dynamics worked out and built a modern, optimized organization that could run as fast as it built, but most companies paid a high price in time, focus and resources to keep their services up and running.

    For most companies, it felt like a war of speed versus availability. Engineering wins when they can deliver what the business needs, quickly. They do not need to look beyond their group for much and – if it works as intended – they are good to go. IT Ops, on the other hand, needs a broad view of the entire technology landscape. They need to think about the availability of all services, which requires them to have visibility across the entire enterprise stack, often dealing with the downstream implications of outages and incidents that cross networks, hardware, software and clouds.

    Now, it’s 2021, and the war is over. And it turns out, the rise of operations wasn’t about a revolution. It was about recognition. IT Ops teams needed a seat at the table. They finally got the chance to explain that they want to move fast, too – to streamline operations, consolidate awareness, automate wherever possible and help support and enable the velocity the business demands, side by side with their partners in engineering.

    Jeremy Bragg is an infrastructure automation architect at Abbott Labs. I thought his role description was really compelling; here’s how he explained it: “Probably the most interesting aspect about being in automation is that we break down silos. We cannot just be a server team or a network team or a mobility team. We work across the board with all the teams to try to further their causes. We ask ourselves: where are we doing manual work today that we could automate?”

    Over the next five years, I believe more teams will start to take advantage of AI and machine learning to set the pace for the modern IT organization; more of the mundane work will be automated so they are free to lead innovation, not just react to it.

    Ben Narramore also has a lot of passion for that very topic. “If I look at my teams in the last ten years, we were firefighters; we’re good at it out of necessity. Now, we’re at a point with cloud computing [and] with AI that gives us a chance to reassess our team. I’m excited about how our team has evolved from day-to-day problem solving to looking at our business with the future in mind. Being able to automate manual operations and workflows gave us the ability to do new, more exciting work, as well as helping out with incident management and problem management.”

    My own take on IT is that the shift is happening, and I am excited to have a front-row seat as IT Ops teams step out of the shadows and into the light, taking their well-deserved place as strategic partners at the table, and helping drive the business forward.

  • Three Ways Machine Learning Can Change Incident Management

    Three Ways Machine Learning Can Change Incident Management

    Incident management for important applications has many connotations, many of them negative. Most are well-deserved. Stress, panic, hurry, urgent, drop-everything, all-hands-on-deck, emergency, to name a few. Typically, there is a critical problem, ranging from complete failure to loss of certain functionality or performance. The problem or outage potentially means loss of revenue, loss of customers, negative social media commentary or bad reviews and more. Time is of the essence, dictating that the primary objective is fixing the incident as quickly as possible. Often, this means that symptoms or partial causes are mainly addressed rather than the underlying root cause.

    Without fully addressing the underlying issue, companies virtually guarantee that the same problem – or a similar one – will reoccur. Not identifying root cause often prevents a durable fix. In addition, companies lose the opportunity to proactively improve application code or infrastructure based on real-world experiences and issues. Postmortems may only result in reviews of monitoring and observability solutions and the inevitable updates to alert rules. Most DevOps professionals not only understand but have lived through these frustrations on an ongoing basis. Management, then, often wonders why their systems are so unstable.

    Changing the model for incident management has been limited by a combination of the overriding urgency combined with short-staffed, overworked teams. Although AI and machine learning has been positioned as the panacea for nearly every kind of technical ill, this is a clear case where “machines” could fundamentally enhance human efforts to improve a situation. The best troubleshooters exhibit a combination of instinct, experience and patience to carefully sift through reams of data, spotting unusual events and their correlation with bad outcomes. This turns out to be a perfect application for machine learning.

    By ingesting all logs and metrics to find meaningful problems or anomalies, systematized machine learning can quickly and comprehensively sift through all data to gain a thorough understanding of the real problem. Using this approach significantly speeds up the root cause analysis. Such an applied solution introduces three game-changers for incident management.

    Three Game-Changers for Incident Management

    First, incident remediation times can be reduced dramatically and with less of an all-hands-on deck, drop-everything frenzy. Rather than SREs and engineers spending hours digging through dashboards, traces and millions of log lines, an automated approach can accomplish it more quickly, more thoroughly and with less impact on human professionals, allowing them to focus on other responsibilities. This instantly relieves stress and panic and alleviates pressure because incidents can be remedied better and faster, restoring the application to its expected service level. The value is, of course, two-fold: faster time to resolution and greater efficiency or productivity of the teams who would otherwise be involved. Ending or mitigating the frustration professionals have to deal with is an additional bonus.

    Second, besides faster MTTR, an automated, machine-learning-driven approach is more comprehensive and gets to the root problem. This means that future incidents may be avoided altogether. This also means a potential end to the alert rule “hamster wheel.” The knee-jerk tendency to continually adjust alert rules and settings to enable better “early warning systems” is far less necessary. Instead of trying to gain an early indication of a similar failure in the future, the cause of such failures can be found and addressed proactively. Eliminating such problems in the first place is far better than trying to evolve alerts to catch unresolved causes. Alerts are still important, but machine learning can shift the basis for them to more root-level issues, and they can be constructed automatically by the system.

    Third, automated, machine-learning-based incident management can help proactively catch silent bugs that may not yet directly be part of an incident. It can also inform developers earlier in the cycle. Not terribly long ago, new releases were tested extensively before deploying to production, allowing for the creation of specific test plans, conducting stress tests and potentially catching bugs that might have potentially terrible consequences in the future. Now with faster, non-stop development cycles, testing mainly occurs during production. Machine learning can surface new or unusual errors, event patterns and patterns in metrics. The approach can proactively surface subtle bugs early, before they impact users or cause widespread failure.

    Changing the DevOps Life Cycle

    Each of these three results significantly changes not only the incident management life cycle, but also DevOps as a whole. Poring over logs and metrics is a perfect application for machine learning and offers the opportunity to fundamentally change incident management, transforming it from a scourge and necessary burden to a competency. An automated system of machine learning applied to incident management advances DevOps rather than encumbers it.

  • Unqork Extends Automated No-Code SDLC Platform

    Unqork Extends Automated No-Code SDLC Platform

    Unqork today announced it has extended a no-code platform for managing the software development life cycle (SDLC) to include the ability to automatically document changes to application programming interfaces (APIs) and data models in addition to adding a point-in-time rollback capability.

    Ken Gavranovic, head of strategy and engineering for Unqork, said Unqork 2021.5 also adds a range of dashboards for monitoring application dependencies, service logs, revisions, logs and metrics.

    Finally, Unqork is adding tools to analyze, test and debug configurations along with enabling workflows to subscribe to events and adding a search capability for release candidates.

    Unqork is designed to present IT teams with a set of visual tools through which they can manage SDLC processes without having to build and maintain a platform made up of disparate offerings that they need to then integrate, said Gavranovic. The goal is to reduce the overall size of the team required to maintain an application development environment to enable organizations to allocate more time and resources to building applications, he added.

    The auto documentation for APIs is being added at a time when IT organizations are starting to employ a larger number of APIs as they transition toward building and deploying microservices-based applications. In addition to making it easier to reuse APIs, Unqork also now makes sure documentation for those APIs is always current, said Gavranovic.

    At the same time, Unqork is now providing a means to automatically document changes to data models based on a data store that is integrated in the platform, noted Gavranovic. That capability enables organizations to implicitly add governance capabilities to workflows with a minimal amount of friction.

    As organizations look to accelerate the rate at which applications are being developed to enable multiple digital business transformation initiatives, Gavranovic said more of them are starting to realize their existing processes are too complex and cumbersome to achieve that goal. Unqork is based on a data store that is shared by all the modules that make up the platform, which, in addition to enabling reusability, makes Unqork easier to deploy and manage, added Gavranovic.

    In addition, Gavranovic also noted that, over time, complex processes only increase the overall burnout rate of the development team. It’s hard enough to hire and retain developers today without requiring them to navigate a complex application development environment, he added. Eventually, the best talent will migrate to organizations that make it as easy for them to write code as possible, said Gavranovic.

    It’s not clear to what degree IT organizations will be revisiting the way they build software in the months ahead but as more of them realize how dependent the business now is on the timely delivery of software it’s only a matter of time before pressure to automate as much of the software development process as possible starts to mount. The cost of replacing an application development environment is, of course, not insubstantial. However, continuing to do the same thing with the expectation of producing a different result is, by definition, insanity.

  • Implementing an On-Demand Feature Environment

    Implementing an On-Demand Feature Environment

    Not long ago, developers at LeanTaas implemented an on-demand feature environment. It came about as the result of a collaborative effort to support a faster go-to-market strategy. Moving to an on-demand feature environment resulted in greater agility, effectiveness, quality and a better bottom line for the organization. With careful implementation, any development team can benefit from this exercise.

    With an on-demand feature environment, you can easily test specific features without disrupting development activities that already are in process. Setting up the environment can offer several benefits and enhance the overall outcomes of your product release. Here, we’ll walk through the steps we took to get this implemented.

    feature implementation

    First, we decided to come up with some standards and changes in our development practices:

    Naming Conventions

    Every Git branch name should start with the associated Jira ticket and include details about what that branch is for. We updated the Jira ticket with environment URLs, automated QA test results and comments from product manager reviews.

    Syntax:

    <JIRA_TICKET>-<SHORT_TITLE>-<PRODUCT_NAME>.<DOMAIN_NAME>.com

    For example, LT-123-demo-product1.xxxx.com

    In this case, LT-123 is the Jira ticket, demo is the short title, product1 is the product name and xxxx is the domain name. So, our feature branch URL would be accessible at https://lt-123-demo.product1.xxxx.com, and the internal name would be dev-product1-lt-123-demo, which developers can use to ssh and debug issues (if any) and refer to when they check logs (if necessary).

    Also, following a set naming pattern helps us write a regular expression in a front-facing server environment (we use NginX) that helps proxy/route the requests to the respective feature-specific runtime environments deployed in an AWS EC2 instance.

    If you are using NginX, you can use following regex to achieve this:

    server_name ~^(?<featurebranch>.+)\-product1\.xxxx\.com$;

    set $featurebranch dev-product1-$featurebranch

    proxy_pass https://$featurebranch;

    Data and Microservice Dependencies

    For the environment to work in its own isolated state, it needs a data set stored in its own database. So our teams came up with an automation script for generating an anonymized sample dataset that’s required for this feature instance. We packaged this data, along with other required artifacts, into a golden Amazon Machine Image (AMI) for the specific product. For easy reference, we stored this custom AMI ID in the AWS systems manager (SSM) parameter store so that our Terraform scripts can use this reference while spawning an EC2 instance.

    Once the feature-specific instance came up, we realized it couldn’t play well with our other microservices such as authentication, authorization or notification. They couldn’t differentiate between a real product instance versus a short-lived, feature-specific instance. So, we had to add an additional header in our internal requests, and enhanced these other microservices to be aware of this additional header so that they could exactly respond back to a feature specific instance. When it comes to usage of message services, every feature branch has its own SQS queue, which followed the same naming conventions of the internal hostname. Platform services relied on this same standard to ensure these feature branches worked seamlessly.

    Automation/Manual Quality Checks and PM Reviews

    Now that the feature-specific instance is up and running in its own isolated environment and with its own dataset, it enables a fully functional playground for the QA team and PM team to extensively test new features in an isolated fashion. Having this playground is a game changer for our productivity. It helped parallelize the iteration cycles. Each feature started getting its own feedback and progressing towards the finish line; essentially swimming in their own lane.

    Cost Considerations

    So far, so good. Feature-specific application instances are up and running and development iterations are progressing. But what is the lifetime of these instances? We don’t want to let them run forever; we also want to consider the fact that not every new feature will end up getting released. So, how do we handle such cases? We want to hook up these instance termination actions seamlessly into the developer’s work stream. Here’s how we solved for this:

    • Delete the feature branches-related infrastructure as soon as the feature branch itself is deleted.
    • Stop the EC2 instances every night and start them every morning by using a combination of AWS Cloud Watch Events and Lambda.
    • Automatically delete the feature branches that are active for more than seven days. We later ended up providing an additional feature; skip flag, for some feature branches because sometimes we’d end up making changes that were complicated or revamping things which needed more time.

    Notifications

    We use Slack, so we decided to send Slack notifications every time a feature environment was created and attach test results, as a thread, to the same Slack message.

    feature

    We also decided to use AWS tags and maintain branch_owner (developer name), branch_status (synced with Jira to indicate In-Dev, In-QA, PM Review, Code Review etc.) and tag EC2 instances. We also sent a daily report with the number of active branches, which helped in our daily standup and also provided a quick, at-a-glance overview of features that were ready for release.

    For implementation of CI/CD pipelines, we created a new Jenkins pipeline that had the ability to perform some prereq checks, code quality checks, build applications into Docker containers, spin up infrastructure using Terraform and deploy the Docker container into newly created infrastructure using Ansible, run automation tests against the feature environment and send notifications in Slack as well as update Jira tickets with the build URL and test results.

    feature

    Sample screenshot of our pipeline

    feature

    Once our feature environment was certified, then a pull request is submitted to merge in Master, before merging code review is performed by other developers and engineering leads, and then, finally, merged into Master. Once the feature branch is merged into Master, it gets deleted via a webhook.

    feature

    Now, code is built against the master branch and deployed into the master environment to ensure integrity. We perform one more round of QA using automated and manual checks, regression testing, internal penetration testing and performance testing. Once these are passed, the Docker image is finally promoted to production.

    Following these steps to a seamless implementation of an on-demand environment will help any organization take the same steps towards a more efficient process. If you can apply these steps to your workflows, your metrics could improve exponentially.

  • Netlify Acquires FeaturePeek to Streamline App Feedback Process

    Netlify Acquires FeaturePeek to Streamline App Feedback Process

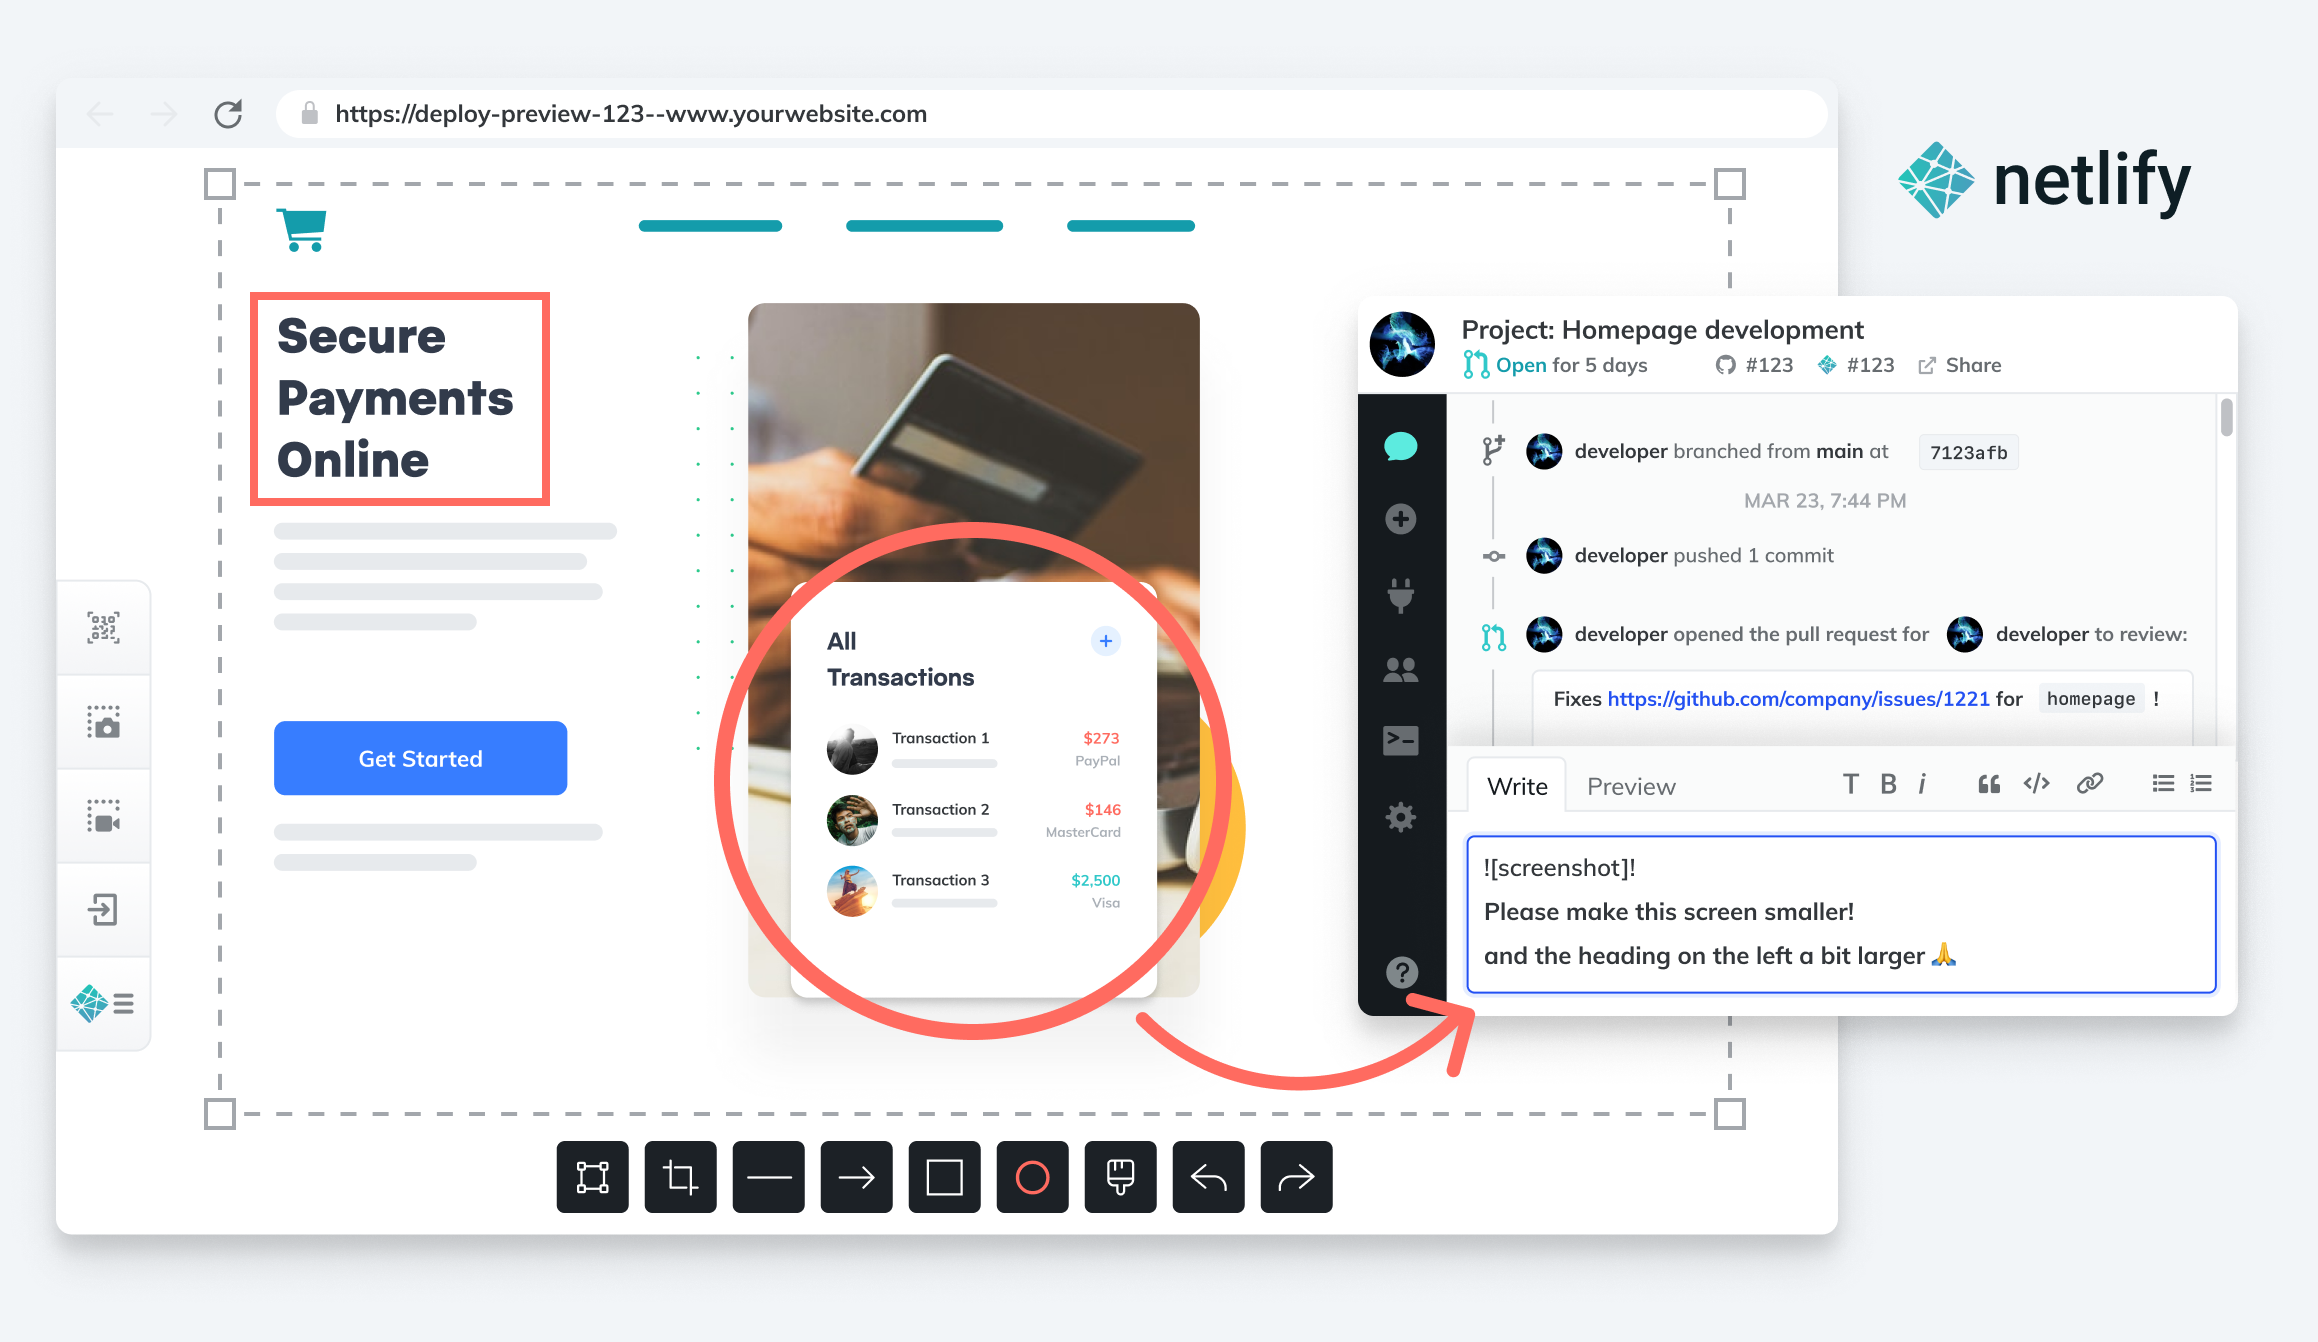
    Netlify announced today it has acquired FeaturePeek as part of an effort to make it simpler for DevOps teams to create a portal through which application stakeholders can both inspect a web application developed using JavaScript and leave comments for developers.

    Matt Biilmann, CEO of Netlify, said Netlify will embed that collaboration capability in the next iteration of its Netlify Deploy Previews. That tool makes it currently possible for a front end pull request from a Git repository to automatically generate a live preview of the site with a unique shareable URL.

    The current version simply shares URLs with application stakeholders, versus enabling DevOps teams to create a portal through which the review process can be centrally managed to make feedback more consistent, said Biilmann. Each piece of feedback from an application owner or stakeholder made via the portal will become a comment on the Git pull request, or can be shared via any collaboration tool a development team employs alongside a Netlify workflow, noted Biilmann.

    In the meantime, Netlify is also making available a free user role license for reviewers that want to make use of Netlify Deploy Previews to view recent updates to applications.

    Netlify has been driving adoption of a serverless computing framework based on a JAMstack architecture for building JavaScript applications faster. An application based on a JAMstack architecture isolates the front end and back end end of an application to make it possible to prebuild front ends that are highly optimized around static pages to make web applications faster. The name JAMstack is a mashup of JavaScript, application programming interface (API) and markup language.

    The need for more collaboration between developers and stakeholders has become more pronounced, in part, because organizations have significantly accelerated the rate at which they are investing in digital business transformation initiatives, noted Biilmann. With organization more dependent on software than ever, it’s critical for them to streamline the feedback cycle as the number of application stakeholders within organizations steadily increases, added Biilmann.

    As the relationship between DevOps teams and the rest of organization continues to evolve, the amount of feedback any team is likely to receive will continue to increase. Everyone from sales teams to the board of directors now realizes how dependent the business is on software. DevOps teams will need to way to organize and prioritize that feedback. They should also expect application owners and stakeholders to follow the progress of software development projects more closely than ever because, in many cases, financial projections are now based on assumptions being made about software delivery timetables.

    Many DevOps teams have been making the case to have a more central role in business planning for years. Now that many of them are getting a seat at the proverbial business planning table, however, they may soon realize they don’t really have the processes in place to absorb the overabundance of enthusiasm and anxiety that application stakeholders are likely to generate in equal measure.

  • ZenHub Brings More Science to Sprint Planning

    ZenHub Brings More Science to Sprint Planning

    ZenHub today revealed it has added a Planning Poker capability to its platform for managing software development projects that is designed to make it possible to prioritize sprints based on feedback collected from members of the application development team.

    That capability extends a sprint planning capability the company added this year to a project management application designed specifically for software development teams that employ the GitHub software repository. That sprint planning tool also automates routine tasks, such as automatically carrying over unfinished work to the next sprint.

    Aaron Upright, head of strategic accounts for ZenHub, said collectively, those capabilities will make it possible for development teams to prioritize their efforts in a way that is less biased using points that weight the opinions of team members based on how accurately they have made previous forecasts. For example, Planning Poker will assign a different weight to a developer that is consistently either overly optimistic or pessimistic about the length of time required to complete previous projects.

    Planning Poker is built right into GitHub, which Upright noted allows developers to make estimates without having to exit an environment where they already spend a good portion of their day.

    Thanks mainly to both an increase in and acceleration of the digital business transformation initiatives organizations have launched, DevOps teams are under increased time constraints.

    Many organizations’ entire business strategies now revolve around the rate at which software development projects can be completed. Many elements of those projects can’t go forward until a specific component upon which it depends is completed. Investors are holding business leaders more accountable for software delivery timetables that have direct implications on revenue generation.

    Not surprisingly, the type of end users that are now accessing project management applications to keep tabs on development progress has increased. Everyone from the sales team to the board of directors now wants more visibility into the rate at which software development projects are being completed. The challenge DevOps teams face is software development is an inexact science. Developers, based on individual personalities, exacting standards and willingness to work extra hours, are going to have widely divergent opinions on how long it may take to complete any given sprint.

    Nevertheless, Planning Poker presents organizations with an opportunity to rely on a more scientific approach than traditional guesswork, said Upright. The simple fact of the matter is that all estimates are wrong. The goal is to narrow the margin of error, he added.

    Regardless of how application development projects are managed, the relationship between DevOps teams and the rest of the organization has fundamentally changed. The entirety of some organizations is wholly dependent on the speed at which high-quality software is developed. In many cases, expectations are not realistically aligned with available development resources. A project management application that is widely employed across an organization should make that apparent to all interested stakeholders, which, in theory, at least, should result in either the hiring of additional developers or reassessment of the business strategy before the existing development team simply decides to abandon ship altogether.

  • Nobl9 Makes SLO Specification Open Source

    Nobl9 Makes SLO Specification Open Source

    During an online SLOconf event today, Nobl9 revealed that the platform it created to enable IT teams to achieve service level objectives (SLOs) is now available under an open source Apache license.

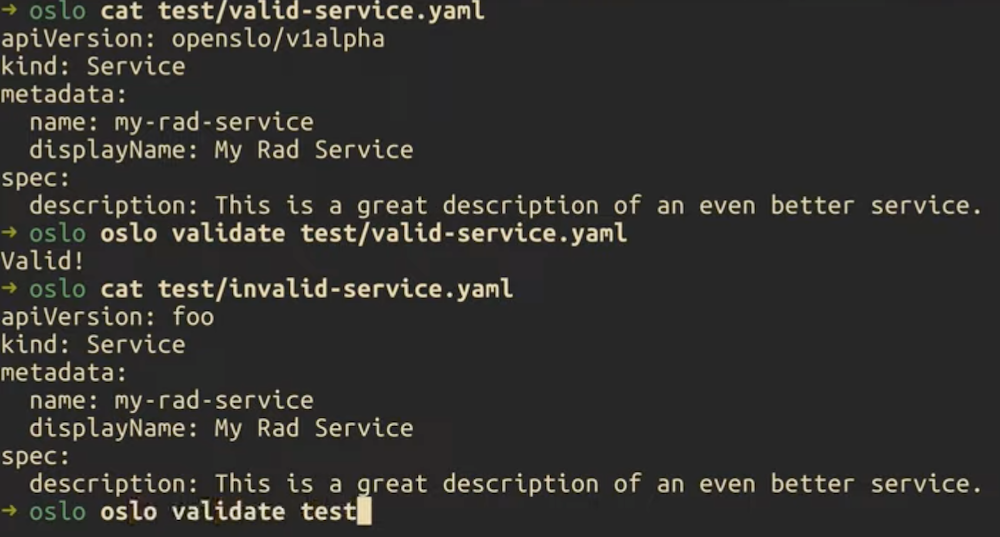
    Brian Singer, chief product officer for Nobl9, said the goal is to make a YAML specification format for defining SLOs that includes a parser and basic validation and testing capabilities more accessible via an OpenSLO project. Achieving that goal is critical at a time when organizations are deploying microservices-based applications that have dependencies that often adversely impact performance and availability.

    While the concept of an SLO and/or a service level agreement (SLA) has been around for a long time, IT teams that have embraced DevOps best practices by hiring site reliability engineers (SREs) are programmatically attempting to assure that SLOs are attained and, just as importantly, maintained, said Singer. Most SLAs have, historically, not been well-enforced. OpenSLO makes it possible to achieve that goal by embedding SLO objectives within a YAML file that become part of a Git-based workflow, he noted.

    SLOs

    Niall Richard Murphy, author of the book, Site Reliability Engineering, has signed on to be a core OpenSLO contributor working alongside committers from GitLab, Dynatrace and Nobl9. The ultimate goal is to make it simpler to share and migrate portable SLO specifications across multiple application development projects by constructing them using an object model, said Singer.

    Nobl9, meanwhile, will continue to operate a software-as-a-service (SaaS) platform for managing SLOs based on OpenSLO. Singer noted there will be an increased need for OpenSLO as it becomes more widely employed. The Nobl9 SLO platform is compatible with monitoring platforms such as Datadog, New Relic and Prometheus, and uses data collected from monitoring and observability platforms to calculate acceptable rates of error per service. It can be configured to trigger alerts and even workflows in anticipation of outages.

    Accessible via a CLI/GUI/API, the platform also enables DevOps teams to create business rules and define “facets” of users based on the application experiences required. DevOps teams can identify users who are being serviced poorly in addition to tracking groups of users. They also can associate contractual obligations to an SLO for a critical business period.

    The platform also makes it easier to determine how to make systems more reliable or lower reliability goals to reduce costs when possible. IT organizations will also spend much less time determining the root cause of any issue using a combination of real-time and historical data that is more accessible. Today, it’s not uncommon for IT teams to spend weeks looking for the source of an application degradation issue, only to discover the problem can be fixed in a matter of minutes.

    It’s still early days as far as adoption of SLO-as-code is concerned, but the days when SLAs or SLOs were, at best, aspirational statements of intent are coming to an end. The expectation is SLOs will soon be maintained via YAML files embedded within application code and distributed across a rapidly expanding enterprise with more interdependencies than any IT team can manually track.

  • Why QA and Monitoring Need to Merge

    Why QA and Monitoring Need to Merge

    Customer expectations for speed and reliability have upended the software development life cycle. Whereas developers used to develop a product and send it to quality assurance engineers for testing before widespread release, customers now demand new versions and features on a quicker timeline. In an era with little available time to run QA in the traditional development process, what’s the alternative?

    Fortunately, modern automated infrastructure provides a solution. Infrastructure-as-code (IaC) toolchains that deliver continuous observability with AIOps let SRE teams overlook the entire process, from the first piece of code through the software product’s public release.

    This merger of the traditional roles of QA and monitoring is enabling quicker speeds within the delivery cycle, a development that improves the customer experience but also ignites business innovation.

    The Benefits of Speed in the SDLC

    Observability delivers the data necessary to eliminate traditional QA, but teams still need help. With intelligent observability — where you apply AI to the data — teams can better focus their efforts and analyze information much more quickly.

    Finding and fixing software issues after deployment unnecessarily stresses SRE teams. But through observability with AIOps, DevOps practitioners and SREs monitor from early development through daily performance. QA is omnipresent. Teams can identify root causes of issues instantly, and AI surfaces the most actionable steps to quickly resolve impacts on the infrastructure.

    The DevOps team used to leave QA engineers with the tedious and time-consuming task of pinpointing issues amid a sea of data, creating a bottleneck within the development process. The continuous learning and intelligent collaboration approach, on the other hand, merges traditional QA and monitoring and yields a CI/CD pipeline that actually works.

    Integrating observability with AI into the development cycle allows teams to spot change almost instantly. If the platform starts acting oddly after its release, SREs and DevOps practitioners can jump in immediately without the need to wait for a QA team. If the issue is where a change in performance is expected, AI and machine learning often still can reduce what’s needed from your teams. If, for instance, you’re monitoring with an adaptive thresholding algorithm, you can let the algorithm retrain and learn the new behavior instead of relying on the DevOps team to communicate the expected change in performance to the QA team.

    As QA shifts left – as evidenced by the growth of software development engineers in test (SDET) – it’s natural that monitoring and assurance capabilities should shift left, too.

    A Principled Approach to QA

    The merger of quality assurance and monitoring throughout the software development cycle follows the three guiding principles behind DevOps practices.

    • Flow/system thinking. The approach eliminates workflow silos and instead creates a holistic view of the development process. The continuous oversight negates typical quality hazards, such as the handoff that can occur despite a known issue or the optimization for local efficiency only.
    • Amplifying feedback loops. A merging of QA and monitoring eliminates the need to loop feedback through multiple teams with various processes because teams are given consistent feedback throughout software development and delivery.
    • A culture of continual experimentation and learning. DevOps teams, no longer in a position to just pass software down the line to QA, will build constant improvement into their processes as they learn from bugs along the way. This also provides more opportunity to take risks and experiment. The approach is a more holistic product cycle versus quick development.

    Improving the Q in QA

    Removing QA as a singular step in the software development process initially may seem like removing quality assurance itself. But QA is actually heightened by integrating observability with AIOps into the development cycle.

    Observability with AIOps allows teams to see into systems as they are being built but also allows them to gain actionable insights to resolve issues on the overall structure. Actionable insights empower the merging of traditional QA and monitoring to drive a whole new speed of delivery, which yields better customer experiences and gives businesses the ability to quickly launch competitive, innovative services.

  • Empowering BizDevOps Teams With SLOs

    Empowering BizDevOps Teams With SLOs

    When BizDevOps teams are drowning in logs and false alerts and are spending more time on manual processes than on building and deploying new applications and features, the work suffers, morale suffers and the organization as a whole suffers. Releasing better and more secure software, faster and with real business impacts starts with a robust BizDevOps practice. A crucial step IT leaders can take to align the developer, operations and business teams is to create a shared language of service-level objectives (SLOs).

    SLOs are metrics for validating that software is meeting its technical and business objectives. Defining and implementing SLOs help align developer, operations and business teams, not only ensuring everyone is moving toward the same goals, but also providing a way to reliably measure how BizDevOps teams are progressing toward these goals.

    Here are three of the most impactful ways SLOs can empower your BizDevOps teams.

    1. Establish a Common Language Across the Delivery Cycle

    The best SLO gives you precise and actionable insight into your system. Take performance and resiliency engineering, for example. By defining SLOs for performance and error rates, teams can use common measurements to track progress toward meeting their quality criteria to ensure they are staying within their error budget.

    In this way, teams can use SLOs as a common language across the delivery cycle – something everyone from developers to operations to business teams can rally around, ensuring everyone is working toward the same outcomes. This aligns teams into a coordinated BizDevOps practice, where all sides have better insight into how each piece of the business feeds into the others. If an incident occurs, operations can use an AI-based observability platform to observe its trends and impacts across different product or service releases and automatically feed that information back to the developers, who can modify their builds accordingly. When everyone is using the same SLOs to speak the same language, BizDevOps teams can coordinate and communicate more easily and effectively.

    2. Creating a Culture of DevOps Resiliency by Shifting SLOs Left

    BizDevOps isn’t just a technical practice defined by tools and platforms. It’s also a culture change and a shift in mindset. SLOs can play a major part in this change. Shifting SLOs left into the delivery pipeline means giving developers feedback about the outcome of their work and real-time visibility into their business KPIs using consistent SLO measurements – ideally, on every code commit. This consistency gives them answers at their fingertips to make data-backed decisions that consistently deliver better business outcomes. Using SLOs for developer feedback is a fundamental building block of DevOps, but it’s also key to creating a culture and mindset of resiliency within BizDevOps.

    A resilient BizDevOps culture is more than just making changes to your technology stack; it’s about changing the mindsets of individual engineers and developers. Resiliency means strength and reliability; the trust that when something goes down, it’ll go right back up. It’s about building the processes and systems that guarantee flexibility for anything from managing crisis events to delivering service continuity. Shifting SLOs left helps facilitate this culture change by giving developers greater exposure to the impact their work has when it’s in production and when it’s deployed. It makes everyone feel they’re in the same boat, and recognizes developers, operations and the business teams as one cohesive unit.

    3. Integrating SLOs Into Remediation

    BizDevOps teams can use SLOs to enhance remediation and incident response efforts. With everyone working with the same metrics, BizDevOps knows with certainty when something is broken, can identify root causes more quickly and can develop agreed-upon incident responses to accelerate time to resolution. BizDevOps teams can then feed this incident response knowledge back into quality gates earlier in the development cycle to avoid future problems. This develops SLOs that have been “battle tested” and can be easily automated to make quality gate testing better on the development side, and incident response better and faster for the operations side.

    SLOs bridge the gaps between BizDevOps

    SLOs already serve a useful role in production, but they also can influence the ability to create a robust, resilient BizDevOps practice. Shifting SLOs closer to developers and using them as a shared language across the delivery cycle provides space for greater experimentation, more innovation and a culture of resiliency. SLOs can also be defined along business-relevant metrics, such as conversion rates, user experience or feature adoption. As a result, SLOs empower BizDevOps teams to respond more quickly to issues and deliver better digital experiences and business outcomes.

    SLOs aren’t just performance metrics – they’re a powerful tool for bridging the divides between the developer, operations, and business teams. SLOs can help cultivate a BizDevOps culture that delivers innovative, secure software faster and with tangible business value.