Author: Mike Vizard

  • New Relic Acquires CodeStream to Close Observability Gap

    New Relic Acquires CodeStream to Close Observability Gap

    New Relic today revealed it has acquired CodeStream as part of an effort to make observability data more accessible to developers.

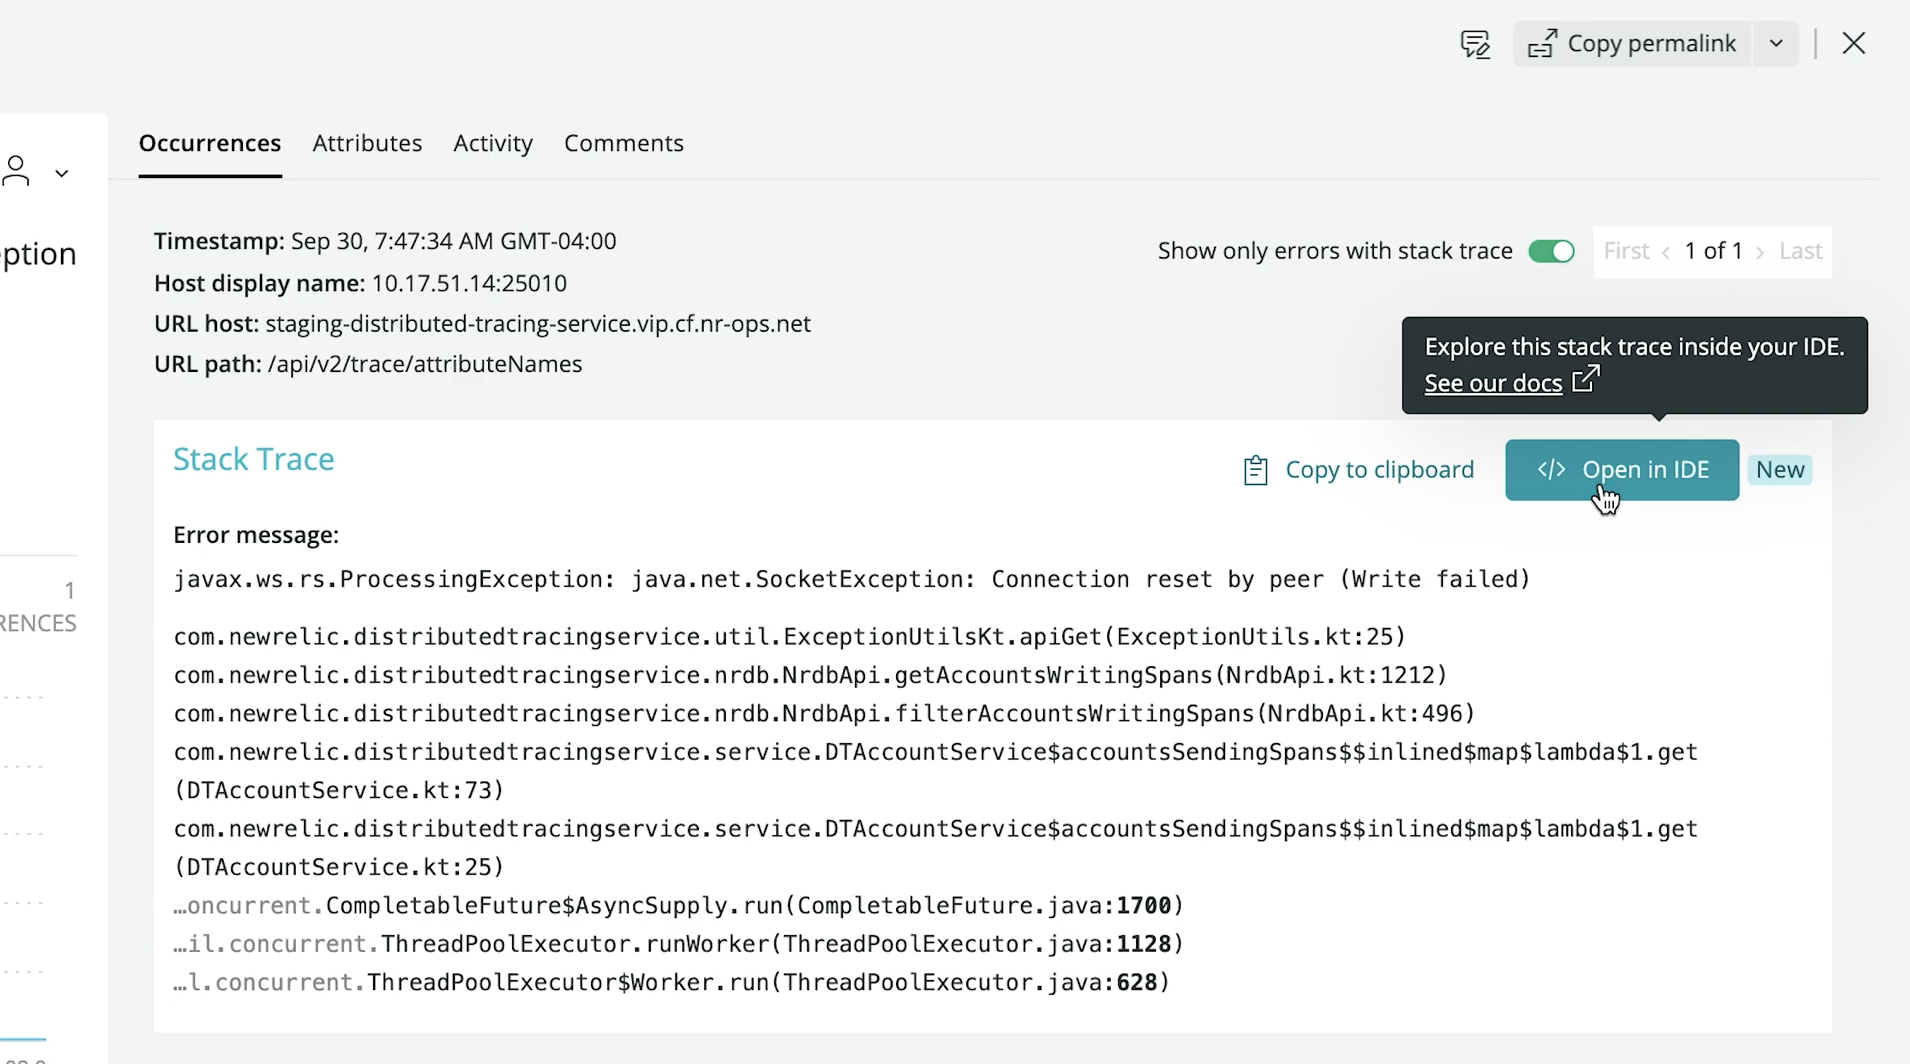
    Buddy Brewer, group vice president (GVP) and GM at New Relic said New Relic CodeStream makes application telemetry data collected via the New Relic One platform directly available within an integrated development environment (IDE), now including Microsoft VS Code. In addition, there are also integrations with Microsoft Teams and the GitHub repository.

    The goal is to close an observability gap that exists today between developers and IT operations teams that stems from a lack of developer visibility into production environments, he noted.

    Finally, New Relic is also announcing a core user pricing option for New Relic One that is aimed at developers. Starting at $49 per month, developers gain access to a core set of capabilities such as CodeStream integrations, errors inbox, logs, GraphQL application programming interfaces (APIs) and the ability to build and run custom applications on New Relic One.

    Peter Pezaris, CodeStream co-founder and CEO, now GVP and GM, strategy and developer tools at New Relic, said becoming part of New Relic will make it easier to bridge the divide that exists between most developers and IT operations teams by making it much easier for developers to see how their code is actually executing in a production environment. That capability will eliminate scenarios where code that runs just fine on a laptop executes poorly in a production environment, he added.

    Developers can also add inline code comments, trigger pull requests, request feedback and track issues directly from their IDE via integrations with a wide range of developer and communication tools. Developers also can switch from New Relic One into an IDE in a single click to navigate, triage and remediate production errors in the context of the code they wrote.
    New Relic is initially making New Relic CodeStream available for free—no credit card required—during a preview period that extends to January 12, 2022. Afterward, some of the more advanced features will require a paid user license once free tier limits are reached. Similarly, IT teams can also sign up for a free New Relic One account without entering a credit card to instrument their applications.

    As the responsibility for managing applications in production environments continues to shift left, Pezaris said it’s critical to give developers the tools they need to optimize code in a production environment.

    It’s not quite clear exactly how much responsibility for applications is shifting left toward developers; it differs from one organization to the next. Many are simply trying to reduce as much friction as possible between developers and their IT operations teams by providing more ‘connective tissue’ from New Relic that IT teams would have to otherwise write themselves, noted Pezaris.

    It may take some time to bridge the observability gap between developers and IT operations teams. Most IT operations teams are still coming to terms with what observability provides that existing IT monitoring tools don’t. Monitoring, at its core, focuses on predefined metrics to identify when a specific platform or application is performing within expectations. The metrics tracked generally focus on, for example, resource utilization. In contrast, observability combines metrics, logs and traces—a specialized form of logging—to instrument applications in a way that makes it simpler to troubleshot issues without having to rely solely on a limited set of metrics that have been pre-defined.

    In theory, at least, that level of observability should ultimately reduce the total number of incidents an IT operations team needs to fix by identifying issues long before they become an actual disruption.

  • Atlassian Survey Shows Lack of Collaboration in Software Development

    Atlassian Survey Shows Lack of Collaboration in Software Development

    A survey of 750 IT and engineering leaders found that while a full 83% of respondents agree that interdepartmental communication is critical for successful software development, only 41% of respondents view cross-collaboration to be a priority.

    The survey gathered responses from within organizations that generated more than $50 million in annual revenue and was conducted by Forrester Consulting on behalf of Atlassian.

    Overall, more than two-thirds of respondents (68%) said more departments than ever are involved with software development. Overall, 80% said they need to improve collaboration with other departments, but 82% don’t feel particularly confident about their ability to accomplish that goal. Three quarters (75%) also noted the need to improve collaboration within their own department.

    Well under half of the respondents (42%) said their culture, processes and tools enable the real-time teamwork and free-flowing information that help leaders make sound decisions.

    Among the subset of respondents that are highly collaborative, however, more than (53%) said they see greater customer satisfaction, with 59% reporting increased revenue because of that increased customer satisfaction.

    Suzie Prince, head of product for DevOps at Atlassian, said the challenge organizations face is finding a way to successfully employ a mix of synchronous versus asynchronous communication mediums to better enable collaboration. In fact, collaboration as part of any DevOps culture needs to be a C-level discussion to consistently accelerate the rate at which software can be developed and deployed, she added. The core issue is that not every management team is equally comfortable with open communications between the various departments that make up an organization, said Prince.

    It’s critical for C-level executives to set that tone and lead by example; DevOps best practices can’t only be adhered to by development teams. The entire business needs to embrace DevOps best practices as an operating model for the business to really attain the maximum benefit.

    Unfortunately, DevOps practices within development teams have been unevenly adopted, so it’s often very difficult to get the rest of the business to embrace DevOps principles. Organizations that do embrace DevOps, however, tend to be much further down the path toward becoming a digital business and can more adroitly take advantage of business opportunities as they arise or shift strategy as changing business conditions may warrant. In fact, organizations that embraced DevOps best practices arguably fared better during the economic decline that followed the onset of the global COVID-19 pandemic that took every business and IT leader by surprise.

    It’s not clear from the Atlassian survey results if a DevOps divide is starting to emerge that makes some organizations more competitive than their rivals. In theory, at least, if every organization is now a software company that happens to build something or deliver a service, then the faster they can reliably build and deliver applications the greater the competitive advantage they can attain and sustain.

    There are, of course, a whole host of factors that determine how competitive any organization might be. However, in the age of digital business transformation, it’s clear that being able to build and deploy software at a fairly regular cadence is the new table stakes required for simple survival.

  • HashiCorp Previews Updates to Consul Service Mesh

    HashiCorp Previews Updates to Consul Service Mesh

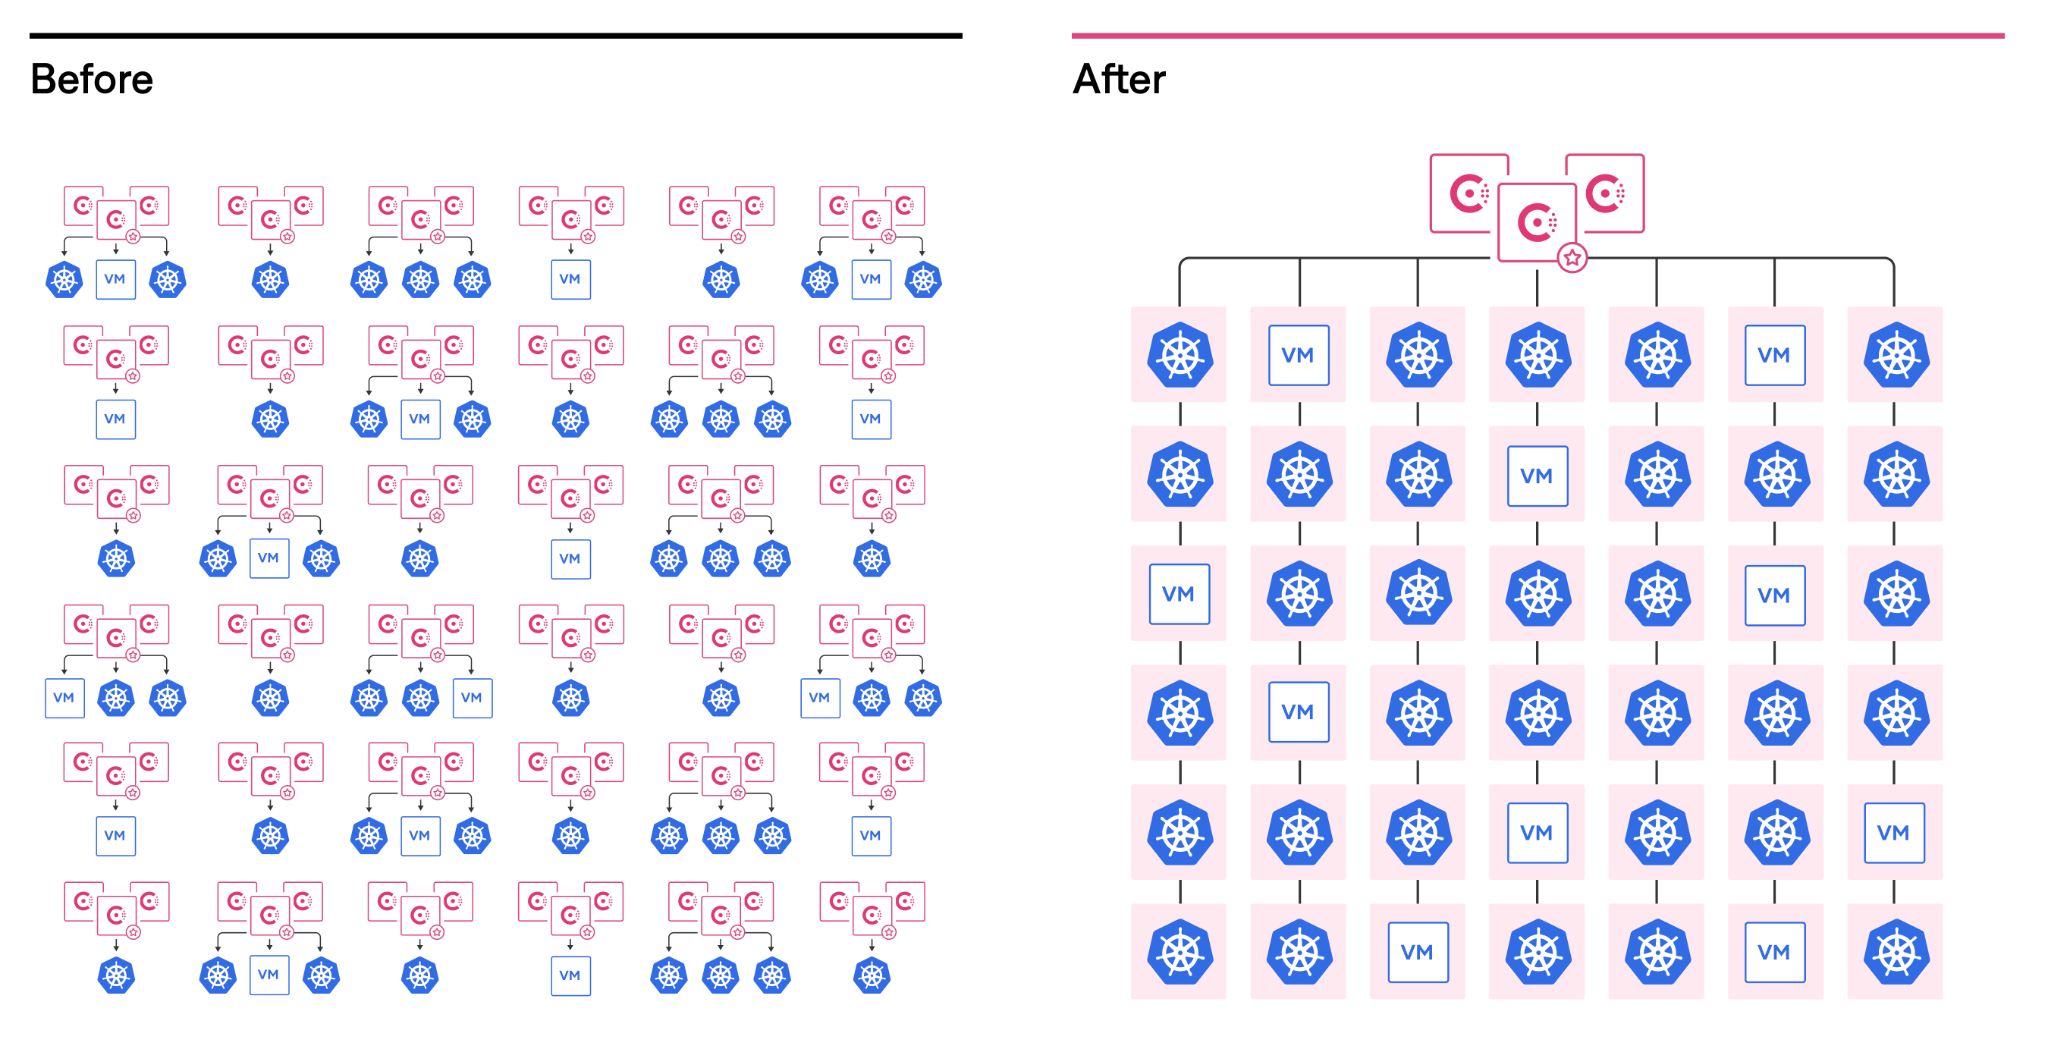
    During an online HashiConf Global conference, HashiCorp today made available a beta of an update to its open source Consul service mesh for virtual machines and Kubernetes clusters that makes it possible for multiple administrators to share the same instance of a multitenant service mesh.

    Version 1.11 of Consul will also add support for a command line interface (CLI) for Kubernetes that will provide an alternative to Helm charts for installing Consul on those clusters.

    Raymond Austin, director of product marketing for HashiCorp, said it’s become apparent that there is a need for a higher level of abstraction for managing application programming interfaces (APIs) that is easy to deploy across both legacy IT environments based on virtual machines and cloud-native environments based on Kubernetes clusters.

    Of course, in many cases, those Kubernetes clusters are deployed on top of virtual machines. However, there are also now more instances of Kubernetes being deployed on bare metal platforms at, for example, the network edge.

    As IT environments become more complex, a service mesh makes it simpler to discover, access and secure APIs that are now rapidly proliferating across the enterprise. That transition requires a more dynamic approach to not only managing APIs but also the network services those APIs depend on, added Austin.

    HashiCorp is betting that many IT organizations will prefer to rely on a lightweight open source platform supported by a single vendor rather than relying on more complex open source service mesh offerings being developed under the auspices of a consortium.

    It’s still not quite clear who within an IT organization is assuming responsibility for deploying a service mesh. Most often, it’s a development team that makes the initial decision. However, as IT operations teams become more aware that service meshes represent a capability that needs to be horizontally made available across multiple applications, it may be only a matter of time before some organizations decide to standardize on a single service mesh to reduce operational overhead, noted Austin.

    Service meshes will also play a critical role in simplifying management of networking and security services at a higher level of abstraction within a larger DevOps workflow.

    It’s still early days as far as service mesh adoption in the enterprise is concerned, but there are already a large number of service mesh options. In fact, there may never be a single dominant service mesh platform. Interoperability standards still need to be ratified that enable organizations that have standardized on different service meshes to apply policies to microservices spanning hybrid cloud computing environments.

    Of course, not every IT organization requires a service mesh yet, either. Many IT teams can still get by using a traditional proxy server or an API gateway until the number of microservices-based applications deployed starts to achieve critical mass. One way or another, however, the more APIs there are to manage, the more inevitable it becomes that an IT team will deploy a service mesh.

  • Pulumi Adds Registry to Share Secure IaC Code

    Pulumi Adds Registry to Share Secure IaC Code

    Pulumi this week added a public registry to its portfolio that makes it easier to discover packages that have been created using its tools to manage infrastructure-as-code (IaC).

    Joe Duffy, Pulumi CEO, said the Pulumi Registry will make it simpler for DevOps teams to share and reuse IaC tools that have been vetted versus always requiring each development team to write new code each time they want to programmatically provision infrastructure. Pulumi Packages provide modern cloud reference architectures in the form of software development kits (SDKs), code samples and how-to guides.

    One of the primary reasons that security has become a major cloud issue is that developers often misconfigure infrastructure. The registry provides a way to reduce those configuration errors by making it easier for developers to reuse code written in TypeScript/JavaScript, Python, Go and .NET that they have stored in repositories such as npm.

    In addition to the major cloud service providers, there are also Pulumi Provider Packages for Auth0, CloudFlare, Confluent Cloud, Datadog, DigitalOcean, Docker, GitHub, Kong, MinIO, MongoDB Atlas, PagerDuty, Snowflake, Spot by NetApp and others.

    There are also Pulumi Component Packages for deploying container applications on instances of Kubernetes and other related platforms in addition to deploying applications on serverless computing frameworks.

    Duffy said in addition to providing a “golden image” of their configurations the registry reduces the overall level of friction that often exists between developers, IT operations teams and cybersecurity professionals.

    The latest Pulumi offering is part of an ongoing effort to democratize cloud computing in a way that is repeatable and reliable, noted Duffy. Pulumi, for example, just added support for a set of AWS Cloud Control application programming interfaces (APIs) that reduce the number of APIs that developers would otherwise have to master. The more APIs there are, the more likely it is a developer will make a mistake.

    IT teams should expect that other cloud service providers will similarly streamline the APIs they present developers as part of an effort to make their services both more accessible and secure. In the meantime, frameworks provided by Pulumi provide a means to invoke those lower-level APIs at a higher level of abstraction for both developers and internal IT operations teams alike.

    It’s not clear today how many developers routinely employ IaC tools, but as the number of workloads deployed in the cloud steadily increases, so too does the percentage of developers that employ these tools. While that shift represents a major boon in productivity for developers, it brings with it additional security risks that many organizations fail to appreciate until it’s too late.

    The only way to really solve that issue is for organizations to adopt DevSecOps best practices that require a level of collaboration between DevOps and security teams that is still relatively rare. However, as the tooling provided continues to improve, the technical challenges associated with achieving that goal continue to decline. The next big issue, as always, is bringing together all the diverse cultures within an IT organization to actually implement those tools and define a set of best practices that work for all concerned.

  • Splunk Expands Scope of Observability While Lowering Costs

    Splunk Expands Scope of Observability While Lowering Costs

    During its online .conf21 conference Splunk Inc. today revealed a bevy of updates that advance observability while at the same time reducing the total cost of deploying its platforms.

    As part of that effort, Splunk also announced it will now make workload-based pricing available to all customers.
    Previously, a select number of small customers had access to workload-based pricing while other customers licensed Splunk platforms based on how much data was loaded into the platform. That approach, however, tends to discourage IT teams from loading as much of their data as possible.

    CEO Doug Merritt said workload pricing was created to enable a value-oriented pricing model that customers could employ instead of a data-centric model that can discourage IT teams from analyzing as much data as possible to improve IT operations.

    To further lower total costs, the company is also previewing a Flex Index option for customers that choose workload-based pricing to enable longer retention for lower-value data at a lower cost. Splunk is also expanding its cloud storage to include a preview of SmartStore, which allows larger volumes of data to be stored more cost-effectively on Microsoft Azure Cloud initially with support for Amazon Web Services (AWS) and Google Cloud Platform (GCP) forthcoming.

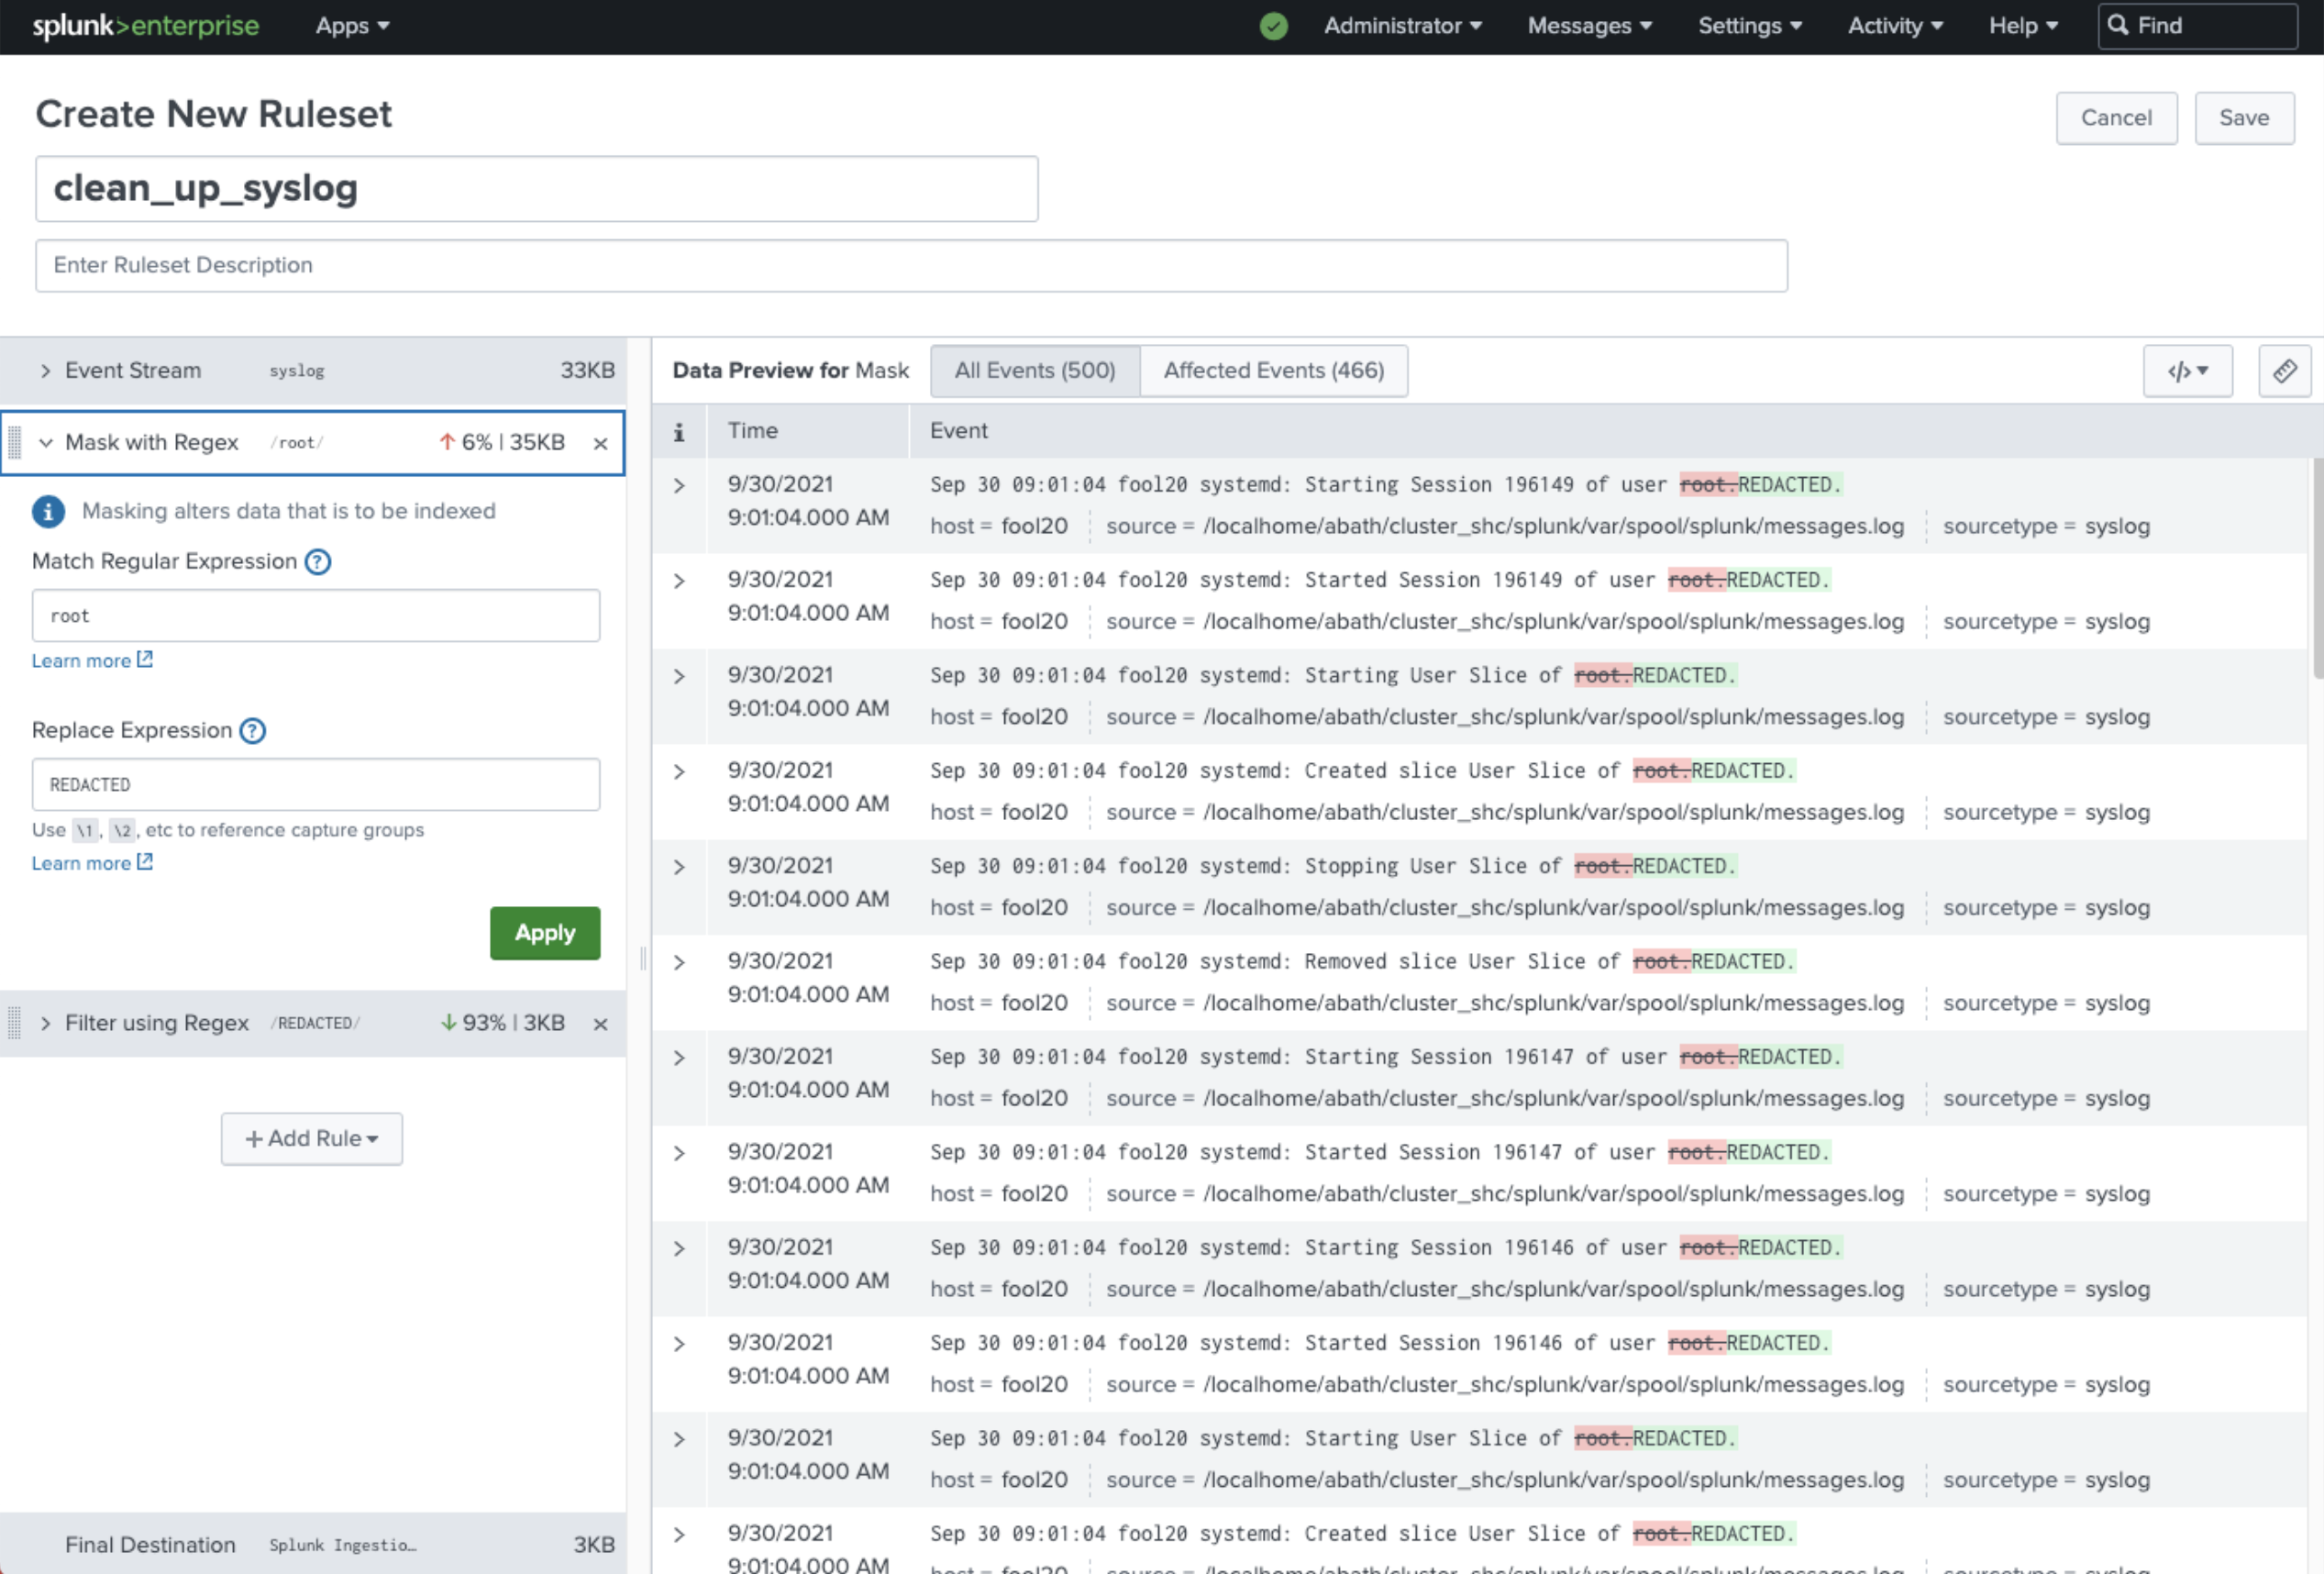
    Other enhancements to the portfolio include a preview of a data manager, a revamped onboarding tool for data stored in Amazon Web Services (AWS) and Microsoft Office 365, and Ingest Actions, which enables IT teams to act on data in motion in addition to data at rest stored in Splunk or the S3 cloud service from AWS.

    The company is also now making it easier to find and explore data via a federated search tool and a Splunk Dashboard Studio offering, available via Splunk Mobile, that makes it easier to create dashboards.

    At the same time, the company is also making available Splunk Operator for Kubernetes to make it easier to install its platforms in cloud-native environments. There is also now Splunkbase, a curated catalog that makes it simpler to find or develop a Splunk application.

    In terms of observability, the company is providing a preview of AlwaysOn Profiling for its application performance management (APM) platform, dubbed Splunk APM. AlwaysOn Profiling extends existing tracing capabilities to provide continuous code-level visibility and analysis.

    In addition, there is now a preview of an enhanced version of Database Visibility for Splunk APM, which automatically uncovers slow queries that are causing transaction latency without having to instrument a database.

    The company also announced that its real user monitoring (RUM) for mobile applications, which makes use of open source, now is generally available alongside the Splunk Observability Cloud for Mobile platform. The company also revealed there are previews of integration between Splunk Log Observer and Splunk Enterprise and Splunk Infrastructure Monitoring AutoDetect, a tool that automatically discovers infrastructure anomalies. There are also now additional Content Packs for managing Microsoft365, third-party APM tools and synthetic monitoring.

    Finally, Splunk has expanded its security portfolio to include Splunk SOAR App Editor, which provides a way to edit, test and create security orchestration, automation and remediation (SOAR) applications. There are now more than 350 SOAR apps now available on Splunkbase. The company also launched Splunk Intelligence Management based on a platform it gained with the acquisition of TruSTAR earlier this year and that it is making available security services via a team of experts dubbed SURGe.

    It’s not clear to what degree these additions will enable Splunk to fend off what has become a larger number of rival providers of observability platforms. However, as one of the most widely used IT operations management platforms in the enterprise, it’s clear Splunk enjoys an incumbent leader status it is determined to maintain.

  • Splunk Donates eBPF Telemetry Data Collector to CNCF

    Splunk Donates eBPF Telemetry Data Collector to CNCF

    Splunk Inc. announced during the KubeCon + CloudNativeCon North America conference that it donated a data collector to the OpenTelemetry project run by the Cloud Native Computing Foundation (CNCF).

    Splunk’s data collector runs as a sandbox-level program at the kernel of a Linux operating system and takes advantage of extended Berkeley Packet Filter (eBPF) technology to make it simpler to collect networking telemetry.

    The OpenTelemetry initiative itself spans a range of open source tools, application programming interfaces (APIs) and software development kits (SDKs) that are used to instrument applications. Previously, Splunk contributed the SignalFx Smart Agent and Smart Gateway to the OpenTelemetry project along with more than 64,000 code contributions.

    Morgan McLean, a director of product management for Splunk, said that while OpenTelemetry is officially in beta, some elements of the project are more mature than others. For example, tools for capturing metrics and traces are already being employed, while another set of tools for capturing log data will be ready sometime next year, he said.

    The data collector contributed by Splunk is among the first that operate at the kernel level to collect data, added McLean. That approach makes it possible for some types of data to be captured by default rather than requiring developers to always instrument their applications using agents to enable an observability platform. It will also contribute toward the eventual convergence of network operations and DevOps processes.

    Going forward, DevOps teams should expect to employ a mix of open source data collectors that operate at both the eBPF and application level, said McLean. The eventual goal is to instrument every application by default by making it much simpler to collect data. Today, most DevOps teams are employing a mix of proprietary and open source agent software to collect data that then must be deployed and then integrated with all the applications they build. Given the cost and level of effort required, the percentage of applications that are actually instrumented is, not surprisingly, fairly low.

    However, as agent software becomes more readily accessible, the percentage of applications that are instrumented should increase considerably in the years ahead. For DevOps teams that depend on that data to optimize application performance, that capability should prove to be a boon for improving overall observability in IT environments.

    Observability, in one form or another, has always been a core tenet of any DevOps best practice. Initially, DevOps teams focused on continuous monitoring as the most effective way to proactively manage application environments. However, it can still take days, sometimes weeks, to discover the root cause of an issue.

    Monitoring focuses on predefined metrics to identify when a specific platform or application is performing within expectations. The metrics tracked generally focus on, for example, resource utilization. Observability platforms combine metrics, logs and traces—a specialized form of logging—to instrument applications in a way that makes it simpler to troubleshoot issues without relying on a limited set of predefined metrics focused on a specific process or function.

    Those observability platforms then make it possible to correlate events so that it is easier to identify anomalous behavior indicative of an issue’s root cause. Armed with these insights, it becomes a lot simpler for IT teams to resolve issues faster.

    It’s unclear when OpenTelemetry tools will become more widely employed, but as more tools for collecting data become available, the impact on DevOps will be nothing short of profound.

  • CNCF Adopts Meshery to Advance Service Mesh Management

    CNCF Adopts Meshery to Advance Service Mesh Management

    The Cloud Native Computing Foundation (CNCF) announced this week during the ServiceMeshCon/KubeCon + CloudNativeCon conference that Meshery, a service mesh management plane created by Layer5, has become a sandbox-level project.

    In addition, Layer5 has also donated Service Mesh Performance (SMP), a set of tools for measuring the efficiency of a service mesh, to the CNCF. SMP provides an open source framework to define standardized benchmarking practices, performance test configurations and measurements as part of an effort to create a MeshMark index for rating a service mesh. A set of service mesh performance methodologies will also be published by the IEEE later this month, developed in collaboration with engineers from Layer5, Intel, Red Hat and HashiCorp.

    Layer5 CEO Lee Calcote said the goal is to make it simpler for IT teams to determine which service mesh to employ based on their specific use case requirements.

    Several service mesh platforms are starting to gain traction as a means to both manage application programming interfaces (APIs) and provide a layer of abstraction between lower-level networking and security APIs that makes those services more programmatically accessible to developers.

    Meshery itself is an implementation of SMP and the conformance tool created for the Service Mesh Interface (SMI), a separate CNCF project to promote interoperability between service meshes. Meshery is based on a set of microservices that are designed to make the platform easily extensible.

    That approach makes it possible to manage multiple instances of service meshes that might be deployed on virtual machines as well as Kubernetes clusters using a range of management tools that are part of the Meshery project.

    Meshery supports AWS App Mesh, Citrix Service Mesh, HashiCorp Consul, Istio, Kuma, Linkerd, Network Service Mesh, NGINX Service Mesh, Open Service Mesh and Traefik Mesh. Meshery also provides IT teams with more than 60+ best practices in the form of templates that can be used to deploy a service mesh.

    It’s still early days as far as adoption of service mesh in the enterprise is concerned. Most IT teams still rely on either proxy software or a gateway to manage APIs. However, as the number of APIs that need to be managed steadily increases, it won’t be long before many IT teams start to at least evaluate a service mesh.

    In the longer term, the impact those service meshes are likely to have on the management of IT could be profound. It is becoming apparent that a service mesh also provides a higher level of abstraction for invoking networking and security services. In fact, the service mesh may wind up playing a key role in driving the convergence of network and security operations with DevOps best practices.

    In the meantime, IT teams will need to decide to what degree they may want to standardize on a single service mesh versus letting individual teams implement their own preferred platform that could one day be centrally managed via Mashery. One way or another, the way APIs are managed and invoked will soon fundamentally change forever.

  • New Relic I/O Aims to Simplify Instrumentation

    New Relic I/O Aims to Simplify Instrumentation

    New Relic today at the KubeCon + CloudNativeCon North America conference launched a New Relic Instant Observability (I/O) initiative through which it is making available open source tools to simplify application instrumentation.

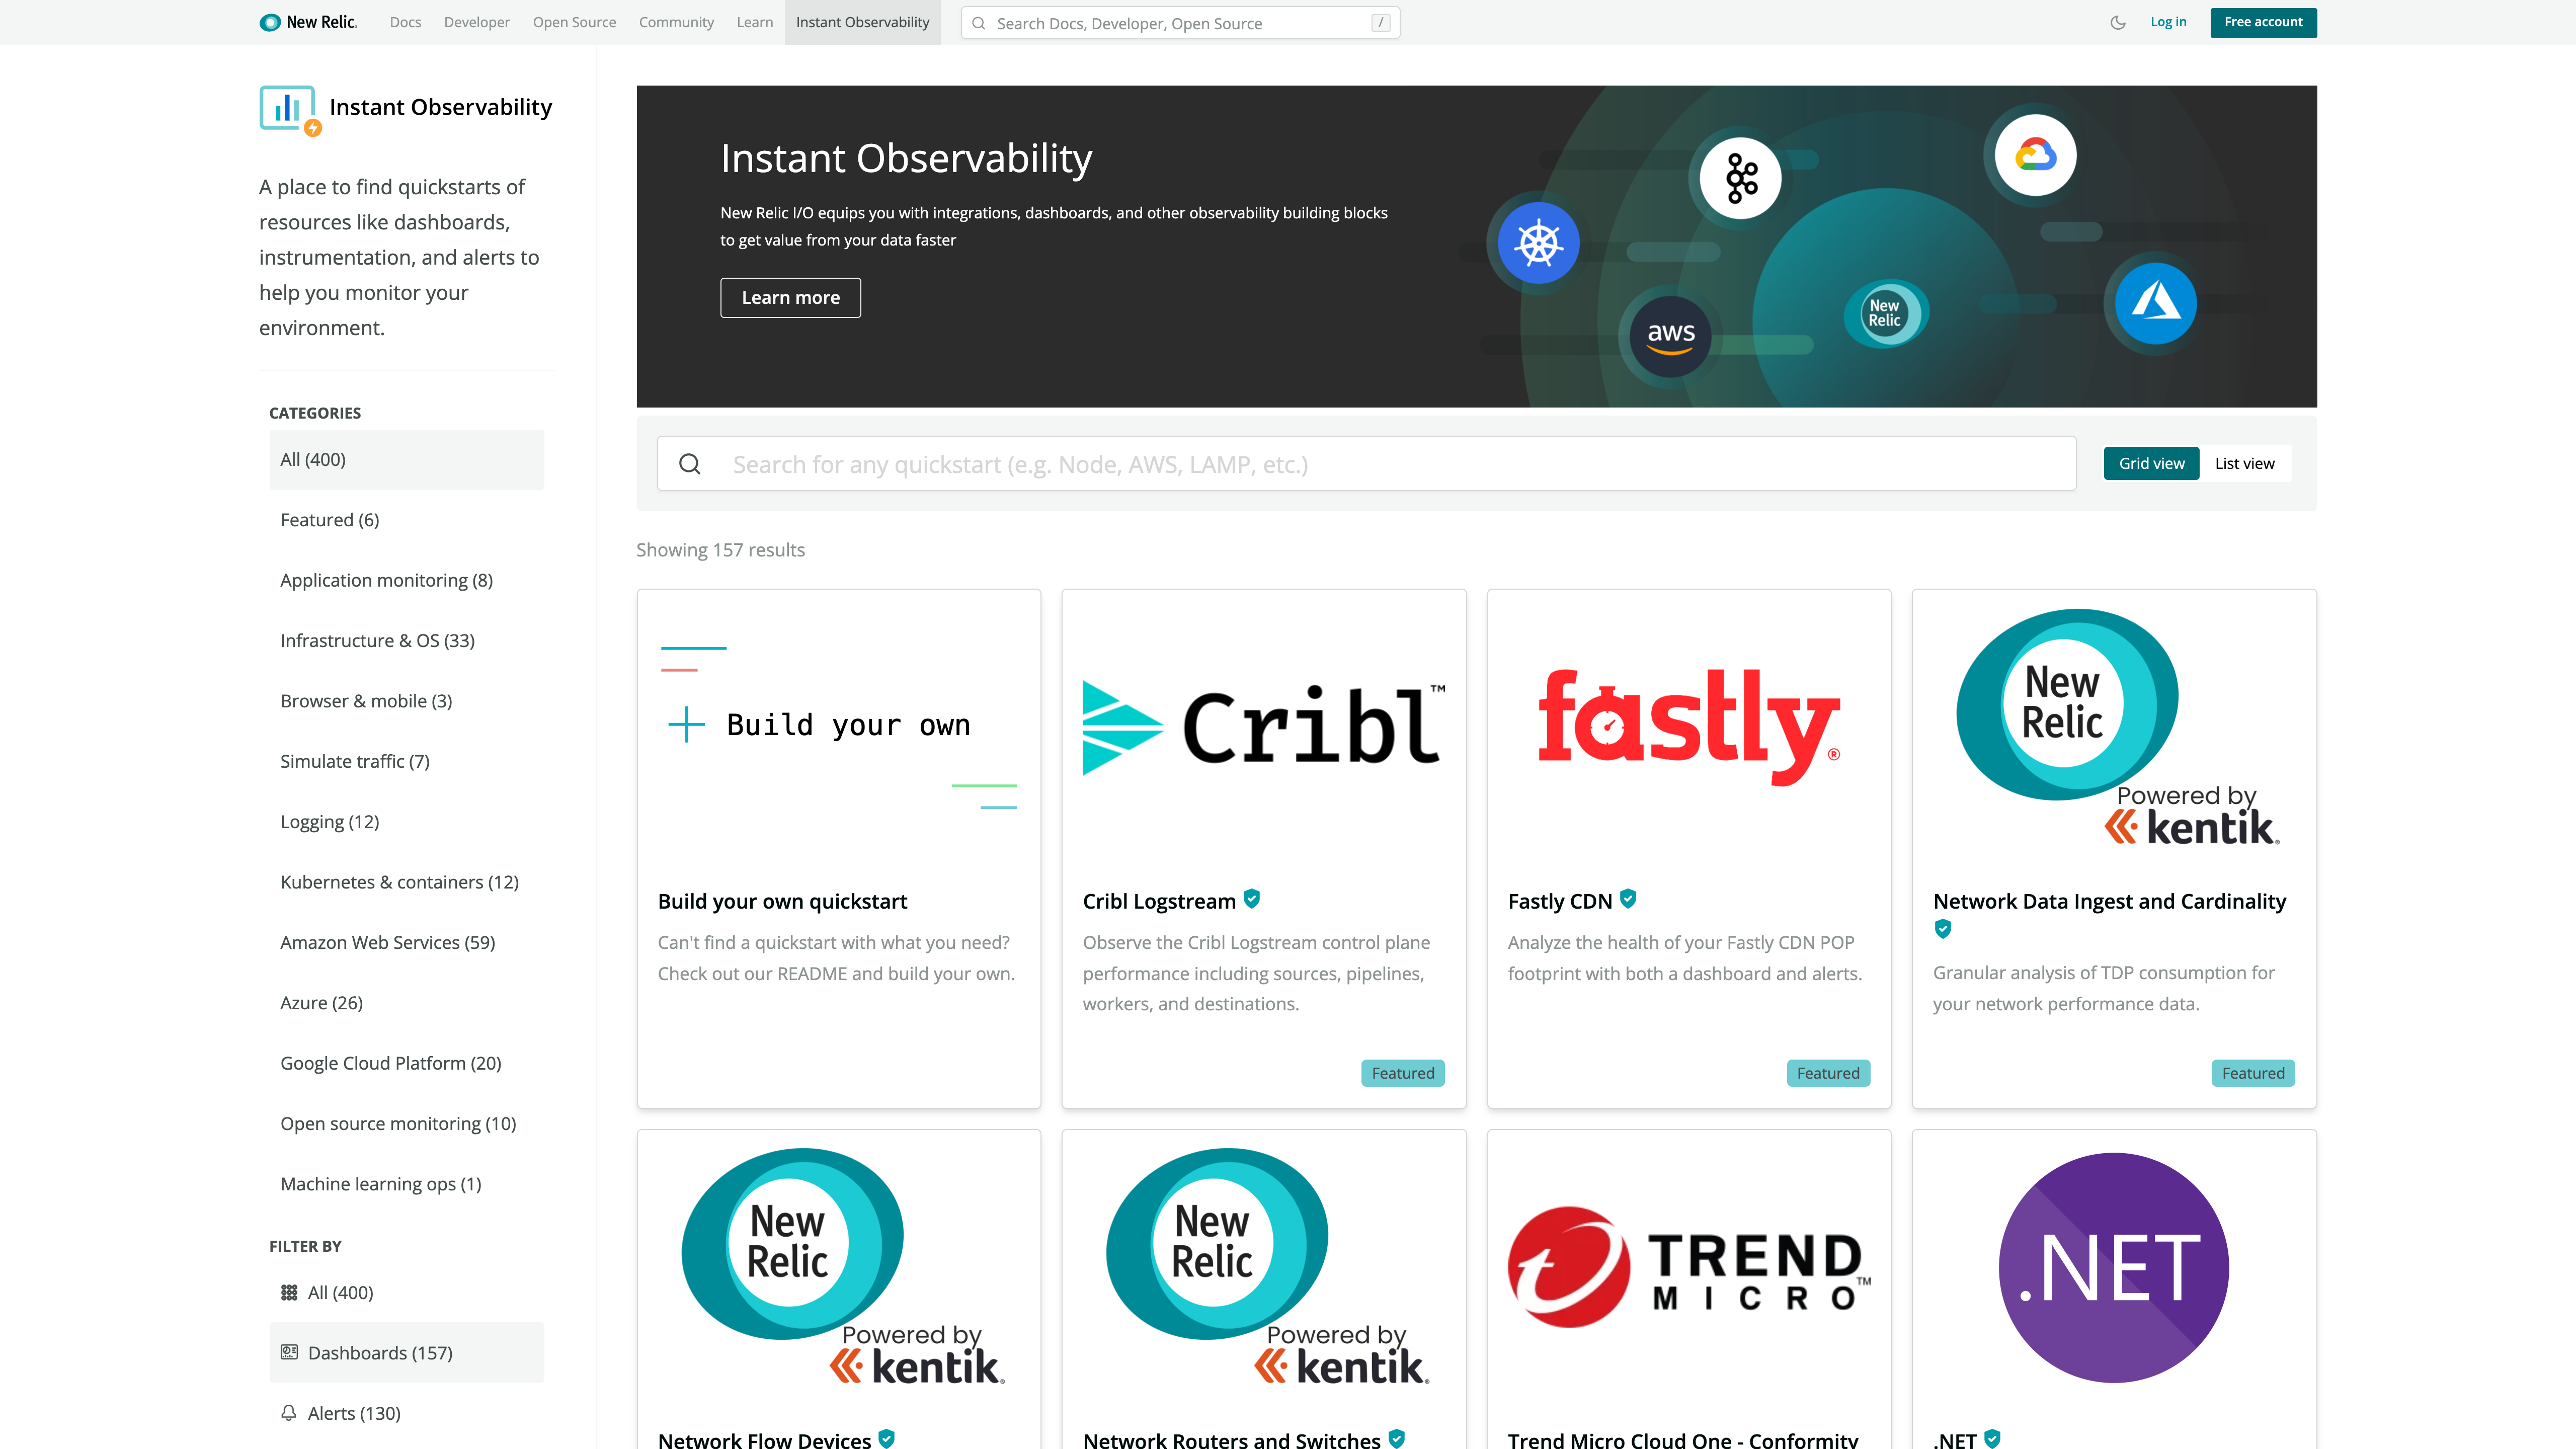
    Marck Robinson, senior vice president for engineering at New Relic, said the catalog of tools will help DevOps teams instrument a much wider range of applications. New Relic will make those tools available as part of the free tier of its observability platform delivered via the cloud. DevOps teams will be able to use more than 400 pre-configured quickstarts to both instrument applications and create dashboards, Robinson said.

    New Relic itself is contributing quickstarts for cloud services, open source tools and platforms such as Kubernetes, Istio and Cassandra. Third-party vendors that have already contributed to the catalog include Cribl, Fastly, Gigamon, Kentik, Lacework and Trend Micro. Each contribution is being vetted by New Relic as part of an effort to foster the development of a larger open source observability ecosystem, noted Robinson.

    Robinson said overall, New Relic is trying to make it easier for DevOps teams to close an instrumentation gap that is impeding IT organizations from moving beyond monitoring to embrace true observability of their IT environments. The recent New Relic 2021 Observability Forecast report notes only a quarter of respondents (26%) have a mature observability practice, with the most commonly cited barriers to observability being a lack of resources (38%) and skills gaps (29%).

    As a result, DevOps teams often encounter a last-mile observability challenge when it comes to both instrumenting applications and then building their dashboards, said Robinson.

    As part of a larger effort to make it easier to instrument applications, New Relic has open sourced agent software, standardized on the OpenTelemetry tools being advanced under the auspices of the Cloud Native Computing Foundation (CNCF) and contributed the Pixie observability platform for Kubernetes environments to the CNCF.

    Observability in one some or another has always been a core tenet of any DevOps best practice. Initially, DevOps teams focused on continuous monitoring as the most effective way to proactively manage application environments. However, it can still take days, sometimes weeks, to discover the root cause of an issue. However, observability platforms are emerging that correlate events in a way that makes it easier for analytics tools to identify anomalous behavior indicative of a root cause of an IT issue. Armed with these insights, it becomes a lot simpler for IT teams to resolve issues faster.

    In contrast, monitoring focuses on predefined metrics to identify when a specific platform or application is performing within expectations. The metrics tracked generally focus on, for example, resource utilization. Observability, on the other hand, combines metrics, logs and traces—a specialized form of logging—to instrument applications in a way that makes it simpler to troubleshot issues without having to rely solely on a limited set of metrics that have been pre-defined to monitor a specific process.

    With the rise of microservices-based applications, the shift to the cloud and more end users than ever working remotely, the need for observability has never been more critical. The issue now is finding a way to make it much simpler to achieve.

  • LF Networking (LFN) Adds to Open Source Portfolio

    LF Networking (LFN) Adds to Open Source Portfolio

    At the online Open Networking & Edge Summit + Kubernetes on Edge Day event LF Networking (LFN), an arm of the Linux Foundation focused on networking, today added several projects that promise to make it simpler to programmatically manage networking services based on open source software.

    Walmart is contributing a L3AF project for managing network applications that make use of an extended Berkeley Packet Filter (eBPF) capability that allows applications to run in a sandbox at the microkernel level of an operating system. Intel and Aarna Networks, meanwhile, are donating the seed code from an EMCO project that provides a universal control plane to securely connect and deploy workloads across distributed computing environments that span everything from the edge to the cloud.

    Arpit Joshipura, general manager for networking, edge and internet of things (IoT) for the Linux Foundation, said the L3AF project adds a control plane for managing those applications to the LFN portfolio that addresses load balancing, rate limiting, traffic mirroring, flow exporter, packet manipulation, performance tuning and other management tasks. Earlier this year, the Linux Foundation set up a separate eBPF Foundation to further advance development and adoption of eBPF across multiple operating systems.

    At the same time, LFN also revealed today that Project Alvarium, a tool for measuring how well data is being delivered to devices that was originally created by Dell, and eKuiper, an existing open source lightweight IoT data analytics and streaming platform, are now part of the LF EDGE portfolio of projects.

    Finally, an open source mobile edge computing project, dubbed Edge Gallery, that was originally created by Huawei has been contributed to the Linux Foundation.

    Joshipura said the LFN continues to gain momentum as more vendors contribute core technologies that, ultimately, don’t provide them with enough differentiated value to continue to develop on their own. The LFN today also revealed that VMware and F5 Networks have joined the LF EDGE consortium as premier members, while mimik and Veena, Inc. have become general members of LFN and the Eclipse Foundation has become an associate member.

    The LFN also provides a mechanism that promotes adoption of those technologies more widely than any one vendor can achieve on its own. The total cost of delivering next-generation edge computing platforms based on wireless 5G networks will also be sharply reduced as LFN projects continue to mature, said Joshipura.

    In general, the rate at which various LFN projects are updated continues to accelerate, said Joshipura. The Akraino project for creating blueprints for edge computing platforms recently delivered its fifth update to address use cases involving smart cities, cloud-native multi-tenant environments and vehicular networks. An EdgeX Foundry project for IoT platforms, meanwhile, recently revamped its application programming interfaces (APIs) to make them more secure and enable more message-based communications. The Home Edge project will also soon issue a Drewberries update that will address code stabilization, scripting, APIs, data synchronization and security.

    It’s now only a matter of time before these LFN projects become more integrated with DevOps workflows as IT teams seek to give developers more programmatic control over network services. The issue now is deciding not so much whether to integrate network operations and DevOps teams but rather determining to what degree those teams will need to fold into each other.

  • Snyk Extends Tools Portfolio to Drive DevSecOps Adoption

    Snyk Extends Tools Portfolio to Drive DevSecOps Adoption

    During its online SnykCon 2021 conference this week, Snyk extended Snyk Code, a static application security testing (SAST) tool that already supports the Java, JavaScript and Python programming languages to include support for C#, Ruby, PHP and Go.

    At the same time, Snyk Open Source, a platform for remediating open source vulnerabilities, has been extended to provide native integration with Atlassian BitBucket and AWS CodePipeline platforms for driving DevOps workflows. Snyk has also tightened integrations with platforms from DigitalOcean and HashiCorp.

    Snyk also added support for the Elixir programming language and package managers Yarn 2 and Poetry alongside integration with a C++ scanning tool from FossilID, a provider of a software composition analysis (SCA) tool for open source code that Snyk acquired earlier this year.

    The Snyk Container platform is now integrated with the open source Trivy container scanning tools and with Snyk’s vulnerability database in addition to adding support for container registries such as Quay, GitHub Container Registry, GitLab, Google Artifact Registry and Harbor.

    The Snyk infrastructure-as-code platform now also makes it possible to detect configuration issues in Kubernetes manifests in Terraform code in a way that is compatible with cloud platforms from Amazon Web Services (AWS), Microsoft Azure and Google Cloud Platform (GCP).

    Snyk also is adding support for version 3 of OpenAPI, which the company reports is three times faster than the previous version. That API is also the foundation for Snyk Apps that the company will continue to roll out.

    Finally, Snyk launched both a new free developer security education program, dubbed Snyk Learn, through which developers can attain and measure their level of DevSecOps expertise and Snyk Impact, an effort to foster collaboration among developers involving a wide range of socio-economic issues.

    Company president Guy Podjamy said as DevsecOps continues to evolve, the primary focus remains on developers and DevOps teams. However, as an issue, DevSecOps is also becoming more important at both the C-level within organizations as well as individual security operations teams. As such, and in the wake of recent high-profile security breaches, the sense of urgency surrounding DevSecOps is now a lot higher. The fundamental challenge organizations are trying to address is finding a way to improve overall application security without slowing down the pace at which applications are built, noted Podjamy.

    Snyk itself revealed it has secured an additional $530 million round of funding to address those issues. The company has now raised a total of $775 million to date with a valuation of $8.5 billion. Snyk also revealed it has increased annual recurring revenue (ARR) by 154% year-over-year from a customer base that now spans more than 1,200 organizations, including Asurion, Google, Intuit, MongoDB, New Relic, Revolut and Salesforce. Snyk customers and users collectively have run more than 300 million tests in the last 12 months to fix more than 30 million vulnerabilities in a 90-day period of time, the company claims.

    It may be a while before most organizations have embedded security tools within every DevOps workflow. However, given the resources being poured into DevSecOps, it may be more a question when DevSecOps will be finally achieved rather than if.