Tag: OpenTelemetry

  • Splunk Unveils Unified Observability Platform

    Splunk Unveils Unified Observability Platform

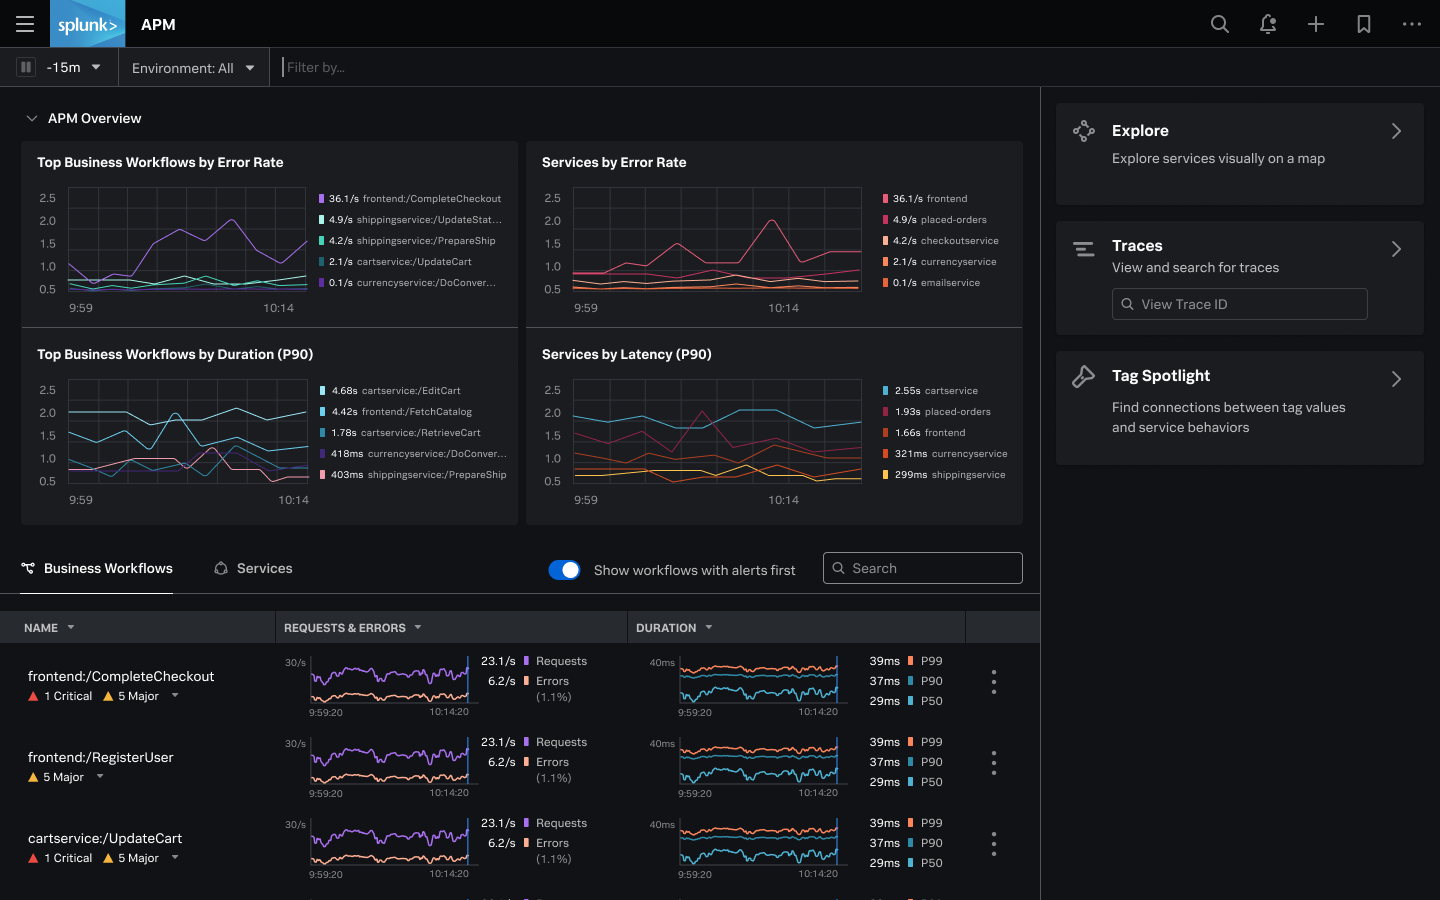
    Splunk today unveiled an observability platform delivered as a cloud service that captures all metrics, traces and logs in real-time without relying on sampling.

    Spiros Xanthos, vice president of product management for observability and IT Ops at Splunk, said Splunk Observability Cloud collects all that data via a single agent based on open source OpenTelemetry software to instrument an application.

    Historically, application performance management platforms (APMs) have only analyzed samples of data to identify a potential anomaly. Splunk Observability Cloud analyzes all the streaming data captured by its agent software to enable IT teams to pinpoint the root cause of an issue faster, said Xanthos.

    As a result, Xanthos said the signal-to-noise ratio dramatically improves compared to legacy monitoring platforms. It will then be up to each IT team to decide how much of that data they want to store after it’s been analyzed, added Xanthos. Pricing for Splunk Observability Cloud is based on the number of hosts employed rather than the amount of data collected.

    The Splunk Observability Cloud unifies a Splunk analytics portfolio by including capabilities provided via Splunk Log Observer, Splunk Real User Monitoring (RUM), Splunk Synthetic Monitoring, Splunk Infrastructure Monitoring, Splunk APM and Splunk On-Call. Splunk Synthetics Monitoring is based on technology Splunk gained with the acquisition of Rigor last year.
    Splunk

    The Splunk Observability Cloud is one of the first such platforms to rely solely on OpenTelemetry agent software being developed under the auspices of the Cloud Native Computing Foundation (CNCF) to collect data. That project not only reduces the cost of instrumenting applications, it also reduces the number of agents an IT team might have to deploy to collect metrics, traces and log data.

    Many rival observability platforms can collect data from OpenTelemetry agent software, but also tend to encourage DevOps teams to deploy proprietary agent software that they claim is easier to install and collects data at a more granular level. Splunk has decided OpenTelemetry has matured to the point where those proprietary agents are no longer required, said Xanthos.

    The rise of observability platforms presents an opportunity for IT teams to rationalize a raft of monitoring tools that often surface conflicting analyses. IT teams today spend an inordinate amount of time convening so-called “war room” meetings to determine the actual source of an issue. Those meetings can go on for hours, only to eventually discover an issue that only takes a few minutes to fix.

    While observability has always been a core DevOps principle, the level of visibility most IT teams have into their application environments is limited. There is no shortage of monitoring tools, but because there is no unified approach to observing an IT environment, there simply isn’t enough context being provided. As IT environments become more complex – thanks primarily to the rise of microservices-based applications that have lots of dependencies – that lack of context is rapidly becoming a major issue. A microservices-based application is designed to degrade gracefully if one microservice suddenly become unavailable. The issue is that it can take a very long time to discover the root cause of performance degradation.

    It may be a while before most IT teams achieve true observability, but once they do, many will wonder how they previously managed IT without it.

  • The Value of OpenTelemetry in Observability

    The Value of OpenTelemetry in Observability

    As infrastructure becomes more complex, the quest for better observability continues. With increased containerization, third-party applications and generally increased network complexity, it becomes difficult for organizations to track issues of stability and performance. But OpenTelemetry can be used to improve upon observability throughout a network by enhancing and consolidating reporting throughout all applications and services.

    So, what is OpenTelemetry and how can it help your organization’s processes? Here’s what you need to know.

    What is OpenTelemetry?

    OpenTelemetry is a Cloud-Native Computing Foundation (CNCF)-curated open source set of libraries, agents and components designed to increase the visibility of services. Through OpenTelemetry, organizations are able to better collect telemetric data for the purposes of debugging and management. A scalable, flexible solution, OpenTelemetry is able to adjust to organizations as they continue to grow.

    With OpenTelemetry, data is collected through:

    • Metrics
    • Distributed Traces
    • Resource Metadata
    • Logs

    The data is then sent to back-end platforms such as Jaeger or Prometheus for processing. All of this together enhances observability for the organization, making it easier for an organization to collect the data it needs to observe and mitigate issues appropriately.

    Greater levels of observability improve an organization’s reliability and reduce downtime. With better reliability, organizations are able to track down and resolve incidents much faster. Before the OpenTelemetry solution, developers might have used OpenCensus, OpenTracing or other similar products. While these products are excellent on their own, they don’t necessarily meet all the needs of modern networks.

    How Does it Work?

    OpenTelemetry works on three major observability systems: tracing, metrics and logging. For tracing, OpenTelemetry makes it easier to identify failures and performance issues by tracking requests within the system. For metrics, processes running within the system are closely tracked and reported on, with histograms, gauges and other easy-to-read graphical reporting. For logging, application-specific messages can be analyzed.

    Observability throughout a system has always relied upon tracing, metrics and logging. But it’s more difficult to complete tracing today because each action needs to go through so many layers of application and resources. When paired with vague log data, the process of tracking down a single incident can take hours, because the information isn’t always consistently siloed. OpenTelemetry (and other similar products) work to correct this by creating a consolidated system by which metrics, tracing and logging can be brought together.

    As an open source project, OpenTelemetry is available on GitHub for those who want to be a part of the community to influence and improve it. Of course, OpenCensus and OpenTracing are also open source solutions.

    So what’s the difference between OpenTelemetry, OpenCensus and OpenTracing? When should one be used over the other? And can they be used together?

    OpenTelemetry vs. OpenCensus

    Let’s take a look at OpenTelemetry versus OpenCensus. Both are used to boost observability, but they are generally mutually exclusive platforms because they each tackle the issue of observability from different angles. OpenCensus provides distributed tracing and time-series metrics from applications via a collection of libraries. Applications need to download a metrics exporter, and which one is used depends on the application microservices involved. OpenCensus will collect trace data, but OpenCensus will also collect time-series metrics. OpenTelemetry is used to connect OpenCensus and OpenTracing, providing the benefits of both. This creates a far more robust observability solution.

    OpenTelemetry vs. OpenTracing

    OpenTelemetry versus OpenTracing is similar to OpenTelemetry versus OpenCensus. OpenTracing also solves the same problems as OpenCensus but is usually mutually exclusive. OpenTracing is a specification for tracing APIs rather than library. Developers are able to either create their own tracer or use the OpenTracing version. OpenTracing is often faster and easier to deploy and use, but may not provide as robust analytics or metrics as OpenCensus. But again, OpenTelemetry makes it possible to use both OpenTracing and OpenCensus at the same time, through its consolidated libraries and support.

    OpenTelemetry is an ideal technology for organizations that want to increase their observability. Through OpenTracing, developers are able to achieve greater levels of visibility throughout the network; track metrics and performance; and react to issues within the organization swiftly and more accurately.

    While in the past developers may have been limited to either OpenTracing or OpenCensus, today developers are able to use OpenTelemetry for both function sets. Even better, since it remains an open source solution, developers are able to contribute to the OpenTelemetry community.

  • OpenTelemetry and the Future of Monitoring Instrumentation

    OpenTelemetry and the Future of Monitoring Instrumentation

    OpenTelemetry is an open source project to provide a de facto standard trace API and a metric and log agent to end vendor lock-in

    It’s no surprise that understanding the internal health of applications and systems is a high priority for developers and SREs. It’s a well-understood problem with dozens of vendors focused on helping companies diagnose application performance in real-time.

    While the actual platform doing the metric, log or trace analysis tends to see most of the focus, a critical component of the data pipeline is, and has always been, the actual instrumentation. That includes APIs and SDKs for application traces as well as installable agents to gather metrics and logs. In the past, this has been a highly fragmented space with both open source and proprietary agents and SDKs. Most APM vendors have provided their own proprietary instrumentation libraries that, intentionally or not, create a vendor lock-in at a code-level that isn’t ideal for most organizations.

    To address this challenge, an open source project was created with a highly aspirational goal of providing a de facto standard trace API along with a metric and log agent that would eliminate this fragmentation, create a unified standard and effectively end vendor lock-in.

    The project, OpenTelemetry, was officially started in May 2019. It is a Cloud Native Computing Foundation sandbox project and came out of the merger of the OpenCensus and OpenTracing projects. They’ve since expanded their goal to include not only application tracing and code instrumentation, but also metric and log collection. They are essentially covering all the critical telemetry points in a system or application.

    Imagine if, regardless of the platform you ultimately sent the data to, you could instrument your code with the same libraries, the same agents and a single set of binaries and libraries. It would dramatically simplify the deployment process, internal training and make it trivial to change or add analytics platforms as needed. This is the promise of the OpenTelemetry project.

    A project like this doesn’t get far without significant support. This is where OpenTelemetry shows incredible promise to realize widespread adoption quickly. Nearly all the largest monitoring and cloud vendors including AWS, Google, Microsoft, Splunk, New Relic and many more have thrown their weight behind OpenTelemetry. They’re actively contributing and supporting the project. One by one, these organizations have come to the agreement that the telemetry component is not the differentiating feature. Instead, they are working together to provide a best-of-breed experience at the telemetry layer.

    The project is in beta, and the potential is huge. OpenTelemetry modernizes every aspect of the telemetry system. It eliminates vendor lock-in. It will outperform the vast majority of existing agents. It simplifies installation and training by reducing dozens of agents and libraries to just one.

    So where to get started?

    It’s still early, but depending on your platform of choice, it may already support OpenTelemetry. If so, look into the existing libraries and test them out in your internal sandbox environments. You’re likely to find improvements over your existing telemetry tools, although there will certainly be gaps in things such as development language support and metric/log integrations. It should give you a sense of the scope, potential and maturity of the project and help to determine whether this is a viable solution for your next deployments.

    The big question mark is whether this will live up to its potential. With the high-quality team assembled, the support of the community and industry and with a truly impactful mission, it will. Ideally, within a few years, this will be how we instrument and gather data from our applications regardless of where we send that data.

  • OpenTelemetry Announces First Wave of Beta Releases for Java, Go, JavaScript, Python, and .Net Components

    SAN FRANCISCO—OpenTelemetry, an open source project created to provide a complete toolkit for cloud-native software observability, today announced the beta release of the first wave of supported languages, – including Java, JavaScript, Python, Go, and .Net – as well as the OpenTelemetry Collector.

    “To address the challenges around performance and root cause analysis introduced by emerging technologies like microservices, we teamed up with experts in telemetry to standardize observability – making it much more accessible for development teams working in complex environments.”

    By integrating tracing and metrics into a single system, OpenTelemetry provides a framework for building next generation observability platforms. OpenTelemetry simplifies the instrumentation of cloud-native software. Rich correlations between tracing and metrics help developers effectively conduct root cause analysis in distributed systems.

    By qualifying for the beta launch, each component meets the following requirements:

    • The implementation of all features contained in the OpenTelemetry Specification, v0.3 or higher. This includes implementation of all API features, including traces, metrics, context propagation, and semantic conventions.
    • Support for exporting to OTLP, Jaeger, and Prometheus.
    • Instrumentation for at least one HTTP, gRPC, SQL, and web framework per language.
    • API, SDK, and getting started documentation.
    • Implementation of OTLP (an OpenTelemetry-native data format) in the OpenTelemetry Collector.

    “At LightStep, we conducted research that found that 91 percent of developers are using or plan to use microservices, and almost all developers reported challenges in using microservices,” said Ben Sigelman, a member of the governance committee of OpenTelemetry and CEO of LightStep. “To address the challenges around performance and root cause analysis introduced by emerging technologies like microservices, we teamed up with experts in telemetry to standardize observability – making it much more accessible for development teams working in complex environments.”

    “We’ve made significant progress on OpenTelemetry in the last few weeks as we’ve successfully added more languages for inclusion in the beta launch. We’ll continue to add more language-specific components to the project as we move forward, bringing us closer to our mission of instrumenting the world,” said Morgan McLean, co-founder of OpenCensus and OpenTelemetry and product manager at Google.

    About OpenTelemetry

    A CNCF Sandbox member, OpenTelemetry is an open source project that aims to make observability more accessible for all. Formed through the merger of Google’s OpenCensus and the CNCF’s OpenTracing, the project is currently comprised of 82 companies, including LightStep, Google, Microsoft, Splunk, Postmates, and Uber. For more information, please visit opentelemetry.io.


    About LightStep

    LightStep’s mission is to deliver confidence at scale for those who develop, operate and rely on today’s powerful software applications. Its products leverage distributed tracing technology – initially developed by a LightStep co-founder at Google – to offer best-of-breed observability to organizations adopting microservices or serverless at scale. LightStep is backed by Redpoint, Sequoia, Altimeter Capital, Cowboy Ventures, and Harrison Metal and is headquartered in San Francisco, CA. For more information, visit https://lightstep.com or follow @LightStepHQ.