Tag: OpenTelemetry

  • Cisco Bets on OpenTelemetry to Advance Observability

    Cisco Bets on OpenTelemetry to Advance Observability

    Cisco today announced a technology preview of a Cisco Full-Stack Observability Platform based on instances of open source OpenTelemetry agent software being advanced by the Cloud Native Computing Foundation (CNCF) to collect metrics, event, logs and distributed traces. The Cisco Full-Stack Observability platform will be available in June 2023.

    The platform, announced at a Cisco Live EMEA event in Amsterdam, Netherlands, will combine the capabilities of multiple Cisco platforms and technologies into a single offering.

    At the same time, the company also announced the bidirectional integration between its existing Cisco AppDynamics application life cycle management (ALM) tool and the Cisco ThousandEyes network monitoring platform beginning in April.

    Finally, Cisco is making available a Business Risk Observability offering to provide business risk scoring. Business Risk Observability combines capabilities of its Kenna Risk Meter tool—gained when Cisco acquired Kenna Security in 2021—with the ability to monitor business transactions through Cisco AppDynamics to provide better visibility into application security. In addition, Cisco has integrated its Panoptica application programming interface (API) management security tool and the Talos threat intelligence platform within the Business Risk Observability Platform.

    Carlos Pereira, a Cisco fellow and chief architect for strategy, incubation and applications at Cisco, said Cisco is moving to narrow the historic divide between application development and cybersecurity teams to enable organizations to adopt DevSecOps best practices and make it simpler to prioritize the remediation of vulnerabilities that are likely to have the most impact on the business.

    Like most providers of observability platforms, Cisco is betting that more applications will be instrumented as OpenTelemetry software continues to mature. Cisco is now the single largest contributor to this project, noted Pereira.

    OpenTelemetry will also play a critical role in improving application security as more applications become instrumented, he noted. In fact, a recent Cisco AppDynamics survey found more than three-quarters of respondents (76%) believed that DevSecOps is essential for organizations to effectively protect against a multi-stage security attack. However, only 43% reported their organization had started implementing DevSecOps workflows.

    Observability, of course, has always been a core DevOps tenet, but achieving and maintaining it is challenging. Most DevOps teams today aspire to maintain some level of continuous monitoring. However, as it becomes easier and less costly to instrument applications, interest is rising in observability platforms that make it simple to investigate anomalies indicative of an issue that could disrupt an application environment. Most of those observability platforms are infusing those platforms with machine learning algorithms to surface those anomalies as part of an effort to augment the capabilities of a DevOps team.

    Regardless of the approach to observability, many organizations will soon be trying to determine whether to rely on existing monitoring tools that make it possible to track pre-defined metrics. In some cases, there may still be a need for that legacy approach to managing IT. Still, in other instances, it may be possible to rationalize some of those platforms in favor of a more advanced approach that relies on a more advanced approach to achieving observability.

  • Open Standards Are Key For Realizing Observability

    Open Standards Are Key For Realizing Observability

    Observability has quickly become a major focus of enterprise DevOps. Yet tool sprawl and complexity can hold some observability initiatives back. The 2022 CNCF Microsurvey on observability trends found that 23% of organizations use between 10 and 15 tools for monitoring, metrics and gathering logging and tracing data. A full 50% also noted that engineers and teams using multiple tools presented a top challenge to observability.

    I recently met with Dotan Horovits, principal developer advocate for Logz.io, to get his take on improving how modern development teams handle observability. According to Horovits, open standards and open source projects are the principal drivers to realizing interoperable observability industry-wide. Below, we’ll consider the issues facing observability and introduce OpenTelemetry, a CNCF project quickly gaining traction to unify telemetry data from various sources.

    Open Standards For The Win

    Although proprietary monitoring agents have a lot of intelligence, they inherently use tight coupling between telemetry generation and the backend storage analytics, said Horovits. This can cause vendor lock-in and lead to formatting variations in telemetry data between toolsets. “The open standards have the power to converge our industry to prevent vendor lock-in, even the playing field, and allow us to get any telemetry for any source,” said Horovits.

    Without an open standard, supporting the evolving suite of technologies at the heart of modern polyglot software stacks is challenging. Organizations constantly add to their tech stack, from SQL to NoSQL, Kafka, API gateways and serverless cloud services, and these modules produce varying data formatted in unique styles. What’s more, companies are typically using more than one cloud vendor, further necessitating the need for a decoupled method to represent multi-cloud metrics. “As soon as your IT stack becomes this complex, there is a need to aggregate all telemetry into one unified observability standard,” explained Horovits.

    Introducing OpenTelemetry

    OpenTelemetry is described as a “high-quality, ubiquitous and portable telemetry to enable effective observability.” Using OpenTelemetry (sometimes abbreviated as OTel), engineers can generate, collect and export metrics, logs and traces. OpenTelemetry works with many popular libraries and is completely vendor-neutral and supported by a rising number of tools in the space. OpenTelemetry was accepted to CNCF on May 17, 2019, and is an incubating project.

    The OpenTelemetry registry boasts hundreds of libraries and plugins to export and transform telemetry data from many different environments, from legacy to contemporary sources. By decoupling the data collection and export process, OpenTelemetry is “one agent to rule them all,” Horovits explained. Of course, he added, vendors who adopt OpenTelemetry may still provide their own logic behind it.

    The Benefits of More Open Telemetry Data

    At the time of writing, live public repository data shows OpenTelemetry is the second-most active CNCF project, behind Kubernetes. So, why is the observability community so excited about OpenTelemetry? Well, for one, the interoperability it affords could equate to efficiency and time savings. “OpenTelemetry gives you the freedom to integrate throughout the stack,” stated Horovits. Part of this is because its open source roots make it a force multiplier. “You can never achieve such vast coverage with closed source as you would with a wide-open community,” Horovits said.

    Arguably, an open telemetry toolset has also become necessary due to the sheer complexity of cloud-native architectures. Most organizations are shifting to a distributed microservices architecture supported by a dynamic, elastic container-based infrastructure. In this world, a single service might span multiple clusters. Therefore, engineers might need to consider clusters, pods, nodes and namespaces when filtering for data.

    In this complex reality, there are many dimensions, multiplying what needs to be monitored. And in general, traditional monitoring systems become ineffective at this level. Tool sprawl and lack of consolidation are problems that arise when trying to cater to many environments simultaneously. Thus, a unified, decoupled observability platform makes a lot of sense.

    Future of OpenTelemetry

    We’ve seen vast adoption from cloud vendors and solution providers around OpenTelemetry. And, the project has been moving swiftly—OpenTelemetry has had a distributed tracing specification released for about a year. The project almost has a release candidate for metrics and one for logs is in the works, said Horovits.

    Beyond that, one feature that Horovits is excited about is continuous profiling, which could help users continuously analyze a function and track usage trends across instances. Another exciting potential development is eBPF. Since it’s language-independent and runs at the kernel level, eBPF could extract observability signals without requiring application-specific hooks or integrations. This could increase support for more environments.

    For more information, you can visit the OpenTelemetry site to peruse the documentation or read up on the feature roadmap for OpenTelemetry. Horovits also gave this helpful presentation on OpenTelemetry at KubeCon 2022.

  • Datadog Adds Support for OpenTelemetry Protocol

    Datadog Adds Support for OpenTelemetry Protocol

    At the KubeCon + CloudNativeCon Europe 2022 event, Datadog announced it made support for the OpenTelemetry Protocol (OTLP) generally available in the agent software it provides to instrument applications.

    Ilan Rabinovitch, senior vice president of product and community at Datadog, said that capability eliminates the need to install a separate OpenTelemetry collector to aggregate metrics, logs and traces from applications instrumented using the open source OpenTelemetry libraries being advanced under the auspices of the Cloud Native Computing Foundation (CNCF).

    The Datadog Agent can already collect application profiles, network data and infrastructure metrics via more than 500 integrations provided by Datadog. OpenTelemetry extends that capability with a set of application programming interfaces (APIs) and a wire protocol for instrumenting applications.

    Datadog is the latest in a series of providers of observability platforms that added support for the OpenTelemetry project that continues to gain momentum. The goal is to make it less costly to instrument applications using open source agent software that surfaces a consistent set of interfaces. Previously, each observability platform provider developed their own agent software that DevOps teams would need to install. Datadog is making a case for agent software that, in addition to collecting data from existing applications, is now compatible with the OLTP protocol created by contributors to the OpenTelemetry project.

    The issue that DevOps teams will need to come to terms with is that while OpenTelemetry agent software is free, many of them have already installed proprietary agent software to instrument applications. That agent software can often provide additional context that is not yet available in OpenTelemetry. History, however, shows that, in time, open source projects with larger numbers of contributors will outpace the ability of any single vendor to innovate.

    One way or another, DevOps teams will be instrumenting more applications as more microservices-based applications are deployed. The dependencies that exist between microservices make it too difficult to manage an application environment without additional instrumentation. The goal within many DevOps teams is to eventually replace the hodgepodge of monitoring tools that track a limited set of pre-defined metrics with an observability platform that not only aggregates metrics but enables DevOps teams to launch queries and surface IT issues before they become a major issue. In some instances, the rationalization of monitoring tools will help justify the acquisition of an observability platform.

    Observability, of course, is one of the core tenets of any set of DevOps best practices. Achieving it, however, has always been a challenge. Rabinovitch said an observability platform that regularly surfaces critical IT issues without requiring DevOps teams to launch queries to search for anomalies will eventually win the battle for observability supremacy.

    In the meantime, there is already no shortage of observability platforms. The challenge will be determining which one enables the highest level of instrumentation at the most reasonable cost.

  • Ingest OpenTelemetry Traces and Metrics with the Datadog Agent

    OpenTelemetry is a Cloud Native Computing Foundation (CNCF) initiative that provides open, vendor-neutral standards and tools for instrumenting services and applications. Many organizations use OpenTelemetry’s collection of APIs, SDKs, and tools to collect and export observability data from their environment to their preferred backend.

    As part of our ongoing commitment to OpenTelemetry, we are proud to have contributed our distributed tracing libraries to the CNCF community. We also offer multiple solutions to ensure that OpenTelemetry users have the flexibility to easily send their observability data to Datadog support for OpenTelemetry Protocol (OTLP) in the Datadog Agent, enabling you to reliably ingest traces and metrics from applications that have been instrumented with OpenTelemetry libraries. OTLP is a specification for encoding and transmitting telemetry data between sources, intermediaries (e.g., collectors), and backends. With native support for OTLP, the Datadog Agent now enables you to get deep visibility into your OpenTelemetry-instrumented applications without updating your code or migrating away from your existing workflows.

    Send OpenTelemetry traces directly to the Datadog Agent

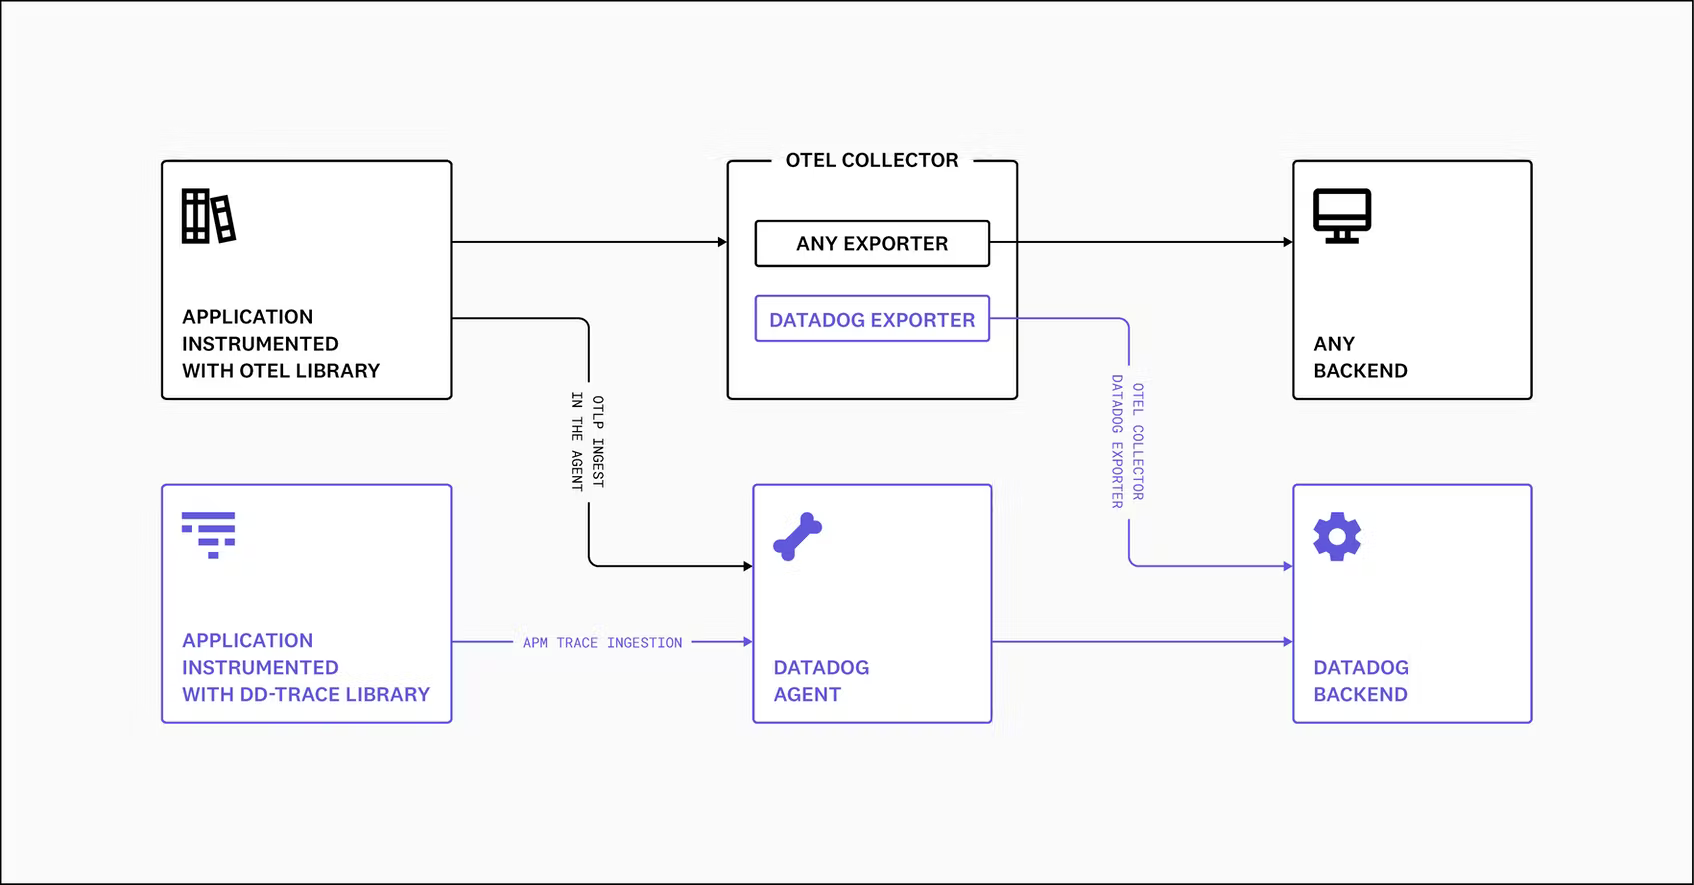
    If you’ve instrumented your applications with OpenTelemetry libraries, you can export OTLP traces directly to the Datadog Agent (version 7.35+) through gRPC or HTTP, without installing a separate OpenTelemetry Collector. The snippet below shows how you can update your Datadog Agent configuration file (datadog.yaml) to enable the Agent to ingest OpenTelemetry traces over gRPC:

    datadog.yaml

    otlp_config:
    receiver:
    protocols:
    grpc:

    You can also configure trace ingestion by setting environment variables. See our documentation for Kubernetes (including Helm) and other configuration examples.

    Once you’re collecting your OTLP traces, you can start visualizing and monitoring that data with Datadog APM. You can also use this method to collect OTLP-formatted metrics.

    Because the Datadog Agent can also collect application profiles, network data, infrastructure metrics from 500+ integrations, and other telemetry from your environment, you can get rich context around your OTLP traces and gain a better understanding of your systems and applications. You can also connect traces with logs to get a more complete picture of your stack.

    Alternatively, you can export OTLP traces and metrics to our platform by using the Datadog exporter and the OpenTelemetry Collector. This option helps streamline your workflows, for backends.

    Observability with Datadog APM and OpenTelemetry

    Whether you ingest OpenTelemetry data with the Datadog Agent or the Datadog exporter, Datadog APM will enable you to get deep visibility into your applications by:

    – Querying all your traces in real time to troubleshoot business-critical application performance issues.

    – Visualizing dependencies to understand how data flows through your architecture by inspecting the Request Flow Map and Service Map.

    – Understanding key insights from each service with the APM Service Page, which provides a centralized view of telemetry, SLOs, relevant incidents, deployment-tracking data, and more.

    – Automatically detecting performance anomalies, faulty deployments, outliers, and root causes of critical failures with Watchdog, Datadog’s AI engine

    Opening more paths to observability

    Datadog is dedicated to ensuring that our users get deep visibility into their services and applications, regardless of whether they’re using our open source APM libraries, OpenTelementry SDKs, or other OpenTelemetry-compatible instrumentation methods. We are excited to continue instrumentation by providing flexible, extensible solutions for collecting telemetry data from services and applications.

    Read our documentation to learn more about the Datadog Agent’s support for OpenTelemetry. Or, if you’re new to Datadog, get started with a 14-day free trial.

  • Timescale Announces OpenTelemetry Tracing Support For Promscale

    Following its recent $110 million Series C investment, Timescale announces general availability of OpenTelemetry tracing support in Promscale, its unified observability backend for metrics and traces powered by SQL. With today’s announcements, Timescale furthers its mission to enable developers worldwide to analyze their time-series data effectively; enabling them to know what is happening, why it is happening, and how to fix it.

    New York, NY, May 16, 2022 – Today, Timescale – the creators of TimescaleDB, the industry-leading relational database for time-series built in PostgreSQL – announced the full availability of OpenTelemetry support in Promscale. Promscale is the unified observability backend for Prometheus metrics and OpenTelemetry traces powered by SQL built on TimescaleDB and PostgreSQL. It provides users of cloud-native applications the power and flexibility to interrogate their observability data using a query language they already know and gain unprecedented insight about their distributed systems to troubleshoot problems faster and build better software. With traces now generally available, Promscale provides a single database and unified query language for metrics, traces, and business data.

    In 2021, Timescale announced the beta release for OpenTelemetry traces in Promscale. With today’s announcement, support for OpenTelemetry traces is now fully available, making tracing data more accessible and valuable to developers so they can better monitor, maintain, and troubleshoot their distributed systems.

    What this means for developers

    OpenTelemetry is an open source observability framework for cloud-native service and infrastructure instrumentation hosted by the Cloud Native Computing Foundation (CNCF). Second only to Kubernetes as the project with the most activity and contributors, It focuses on solving the challenges of operating distributed systems by making telemetry data very easy to collect and universally available.

    Today’s cloud native architectures generally experience a debugging problem due to the numerous components, interactions, autoscaling and frequent deployments that occur within them. This makes it hard to identify the troubled zones within these systems. Observability addresses this by providing insight into where and why it is happening. It does this through the collection of comprehensive telemetry from modern software systems in the form of three signals (metrics, logs, and traces) and through the ability to flexibly analyze that telemetry in real-time. Observability is essentially an analytics problem.

    Metrics and logs are well known and have been widely adopted for many years through tools like Nagios, Prometheus, or the ELK stack. They are however disjointed and do not provide the level of detail required to identify anomalous behaviors in distributed systems. Traces, on the other hand, capture a connected view of how the entire system works together to process requests. This makes it possible for users to figure out the full scope of a problem as well as the real-time behavior and interaction of the different system components.

    With tracing support, Promscale equips every developer with observability powered by SQL. Observability is a data analytics problem, and SQL is a powerful language for data analytics: by using SQL to analyze tracing data, developers can get unprecedented insights about their distributed systems, identifying production problems faster and reducing mean time to recovery.

    What’s new

    OpenTelemetry tracing support in Promscale includes the following features:

    • A fully customizable out-of-the-box experience within Grafana to help users understand the performance of their distributed systems, enabling a deep dive into the behavior of microservices.
    • A native ingest endpoint for OpenTelemetry traces that understands the OpenTelemetry Protocol (OTLP) to easily ingest OpenTelemetry data.
    • Trace data compression and configurable retention to manage disk usage.
    • Seamless integrations to visualize distributed traces stored in Promscale using Jaeger and Grafana so users don’t have to learn new tools or change existing workflows.
    • Support for ingesting traces in Jaeger and Zipkin formats via the OpenTelemetry Collector so users can also benefit from the new capabilities.

    “Observability is an analytics problem; SQL is the lingua franca of observability. By combining SQL with OpenTelemetry traces, you can get new insights not possible with existing observability query languages. Promscale is the only observability solution that makes this possible, thanks to its full SQL support and its support for OpenTelemetry traces” said Ramon Guiu, VP, Observability at Timescale. “With this feature launch, users have access to out-of-the-box dashboards that will help them understand the behavior of their applications, so they can start troubleshooting immediately.”

    Looking Ahead

    With the release of full OpenTelemetry support, Promscale is now even more robust and suited for simple and enterprise-grade deployments; offering unified storage for Prometheus Metrics and OpenTelemetry traces, full SQL and PromQL support, providing users the ability to create unique dashboards, and ask questions aimed at better understanding the systems being monitored. This is an important step towards the goal of enabling every engineer to store all observability data (metrics, logs, traces, metadata, and other future data types) in a single mature and scalable store, and analyze it through a unified and complete SQL interface. More details here

    Get started by deploying Promscale today in your environment or install the lightweight OpenTelemetry demo which includes a microservices application and a complete OpenTelemetry observability stack running on Promscale. 

    ABOUT TIMESCALE

    Timescale is the creator of TimescaleDB, the industry-leading relational database for time-series and Promscale, the observability backend powered by SQL. Tens of thousands of organizations trust TimescaleDB today with their mission-critical time-series applications, and Promscale builds on TimescaleDB to deliver a full observability stack for cloud-native applications. Timescale is a remote-first company with a global workforce and is backed by Tiger Global, Benchmark Capital, New Enterprise Associates, Redpoint Ventures, Icon Ventures, Two Sigma Ventures, and other leading investors. For more information, visit www.timescale.com or follow @TimescaleDB.

    Contact
    Kelvin Steve
    Senior Communications Manager
    press@timescale.com

  • Datadog Announces OpenTelemetry Protocol Support

    Datadog expands its existing support for OpenTelemetry by enabling native OpenTelemetry Protocol ingestion in the Datadog Agent

    NEW YORK, NY, May 16, 2022 – Datadog, Inc. (NASDAQ: DDOG), the monitoring and security platform for cloud applications, announced today the general availability of OpenTelemetry Protocol (OTLP) support in the Datadog agent. This new capability brings the full monitoring capabilities of the Datadog platform to OpenTelemetry-instrumented applications, without the need to install a separate OpenTelemetry collector.

    OpenTelemetry is a Cloud Native Computing Foundation (CNCF) initiative that provides open, vendor-neutral standards and tools for instrumenting services and applications. Many organizations use OpenTelemetry’s collection of APIs, SDKs, and tools to collect and export observability data from their environment to their preferred backend system.

    The Datadog Agent now provides native support for OTLP, making it easy to receive metrics and traces from applications instrumented with OpenTelemetry libraries. In addition, because the Datadog Agent can also collect other telemetry – such as application profiles, network data and infrastructure metrics from 500+ integrations – Datadog customers can now access richer context around their OTLP traces and gain a deeper understanding of their systems and applications. Datadog customers can also connect OpenTelemetry traces with logs to get a more complete picture of their stack.

    “OpenTelemetry provides application developers, system reliability engineers, and middleware providers with a consistent API and wire protocol for instrumenting applications and collecting metrics and traces in a vendor agnostic manner,” said Ilan Rabinovitch, Senior Vice President of Product and Community at Datadog. “With this release we’re adding another option that enables customers to use OpenTelemetry with Datadog without having to go through the time consuming exercise of changing the instrumentation of their applications.”

    For more information about Datadog’s support for OpenTelemetry, please visit: https://www.datadoghq.com/blog/ingest-opentelemetry-traces-metrics-with-datadog-agent.

    To learn more about Datadog’s Application Performance Monitoring capabilities, please visit Modern Application Performance Monitoring (APM).

    About Datadog

    Datadog is the monitoring and security platform for cloud applications. Our SaaS platform integrates and automates infrastructure monitoring, application performance monitoring and log management to provide unified, real-time observability of our customers’ entire technology stack. Datadog is used by organizations of all sizes and across a wide range of industries to enable digital transformation and cloud migration, drive collaboration among development, operations, security and business teams, accelerate time to market for applications, reduce time to problem resolution, secure applications and infrastructure, understand user behavior and track key business metrics.

    Forward-Looking Statements

    This press release may include certain “forward-looking statements” within the meaning of Section 27A of the Securities Act of 1933, as amended, or the Securities Act, and Section 21E of the Securities Exchange Act of 1934, as amended including statements on the

    benefits of new products and features. These forward-looking statements reflect our current views about our plans, intentions, expectations, strategies and prospects, which are based on the information currently available to us and on assumptions we have made. Actual results may differ materially from those described in the forward-looking statements and are subject to a variety of assumptions, uncertainties, risks and factors that are beyond our control, including those risks detailed under the caption “Risk Factors” and elsewhere in our Securities and Exchange Commission filings and reports, including the Quarterly Report on Form 10-Q filed with the Securities and Exchange Commission on May 6, 2022, as well as future filings and reports by us. Except as required by law, we undertake no duty or obligation to update any forward-looking statements contained in this release as a result of new information, future events, changes in expectations or otherwise.

    Contact
    Dan Haggerty
    press@datadoghq.com

  • Observe, Inc. Dives Deeper Into Observability

    Observe, Inc. Dives Deeper Into Observability

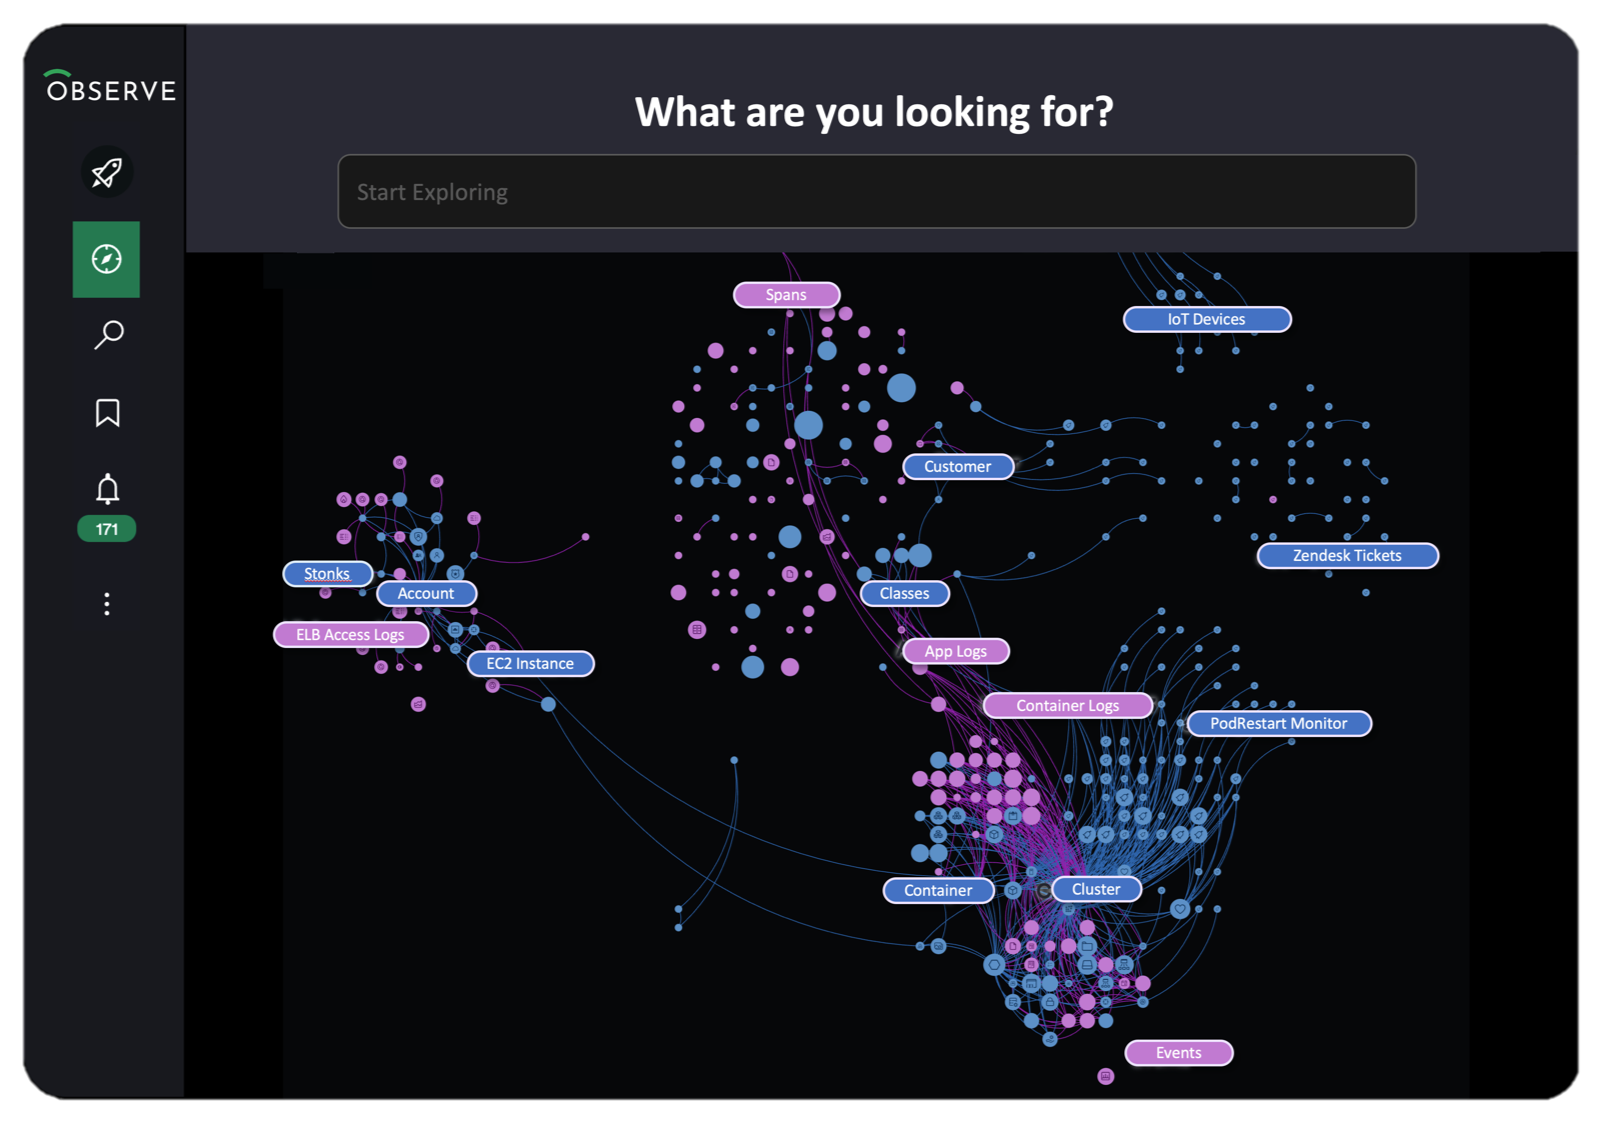
    Fresh from picking up an additional $70 million in funding, Observe, Inc. announced this week it has added multiple tools, dubbed Data Universe Maps, to its observability platform to visualize all datasets and surface underlying event data.

    The company also added pre-built applications for Kubernetes, Amazon Web Services (AWS) and Jenkins environments with editions for Google Cloud Platform (GCP) and Microsoft Azure planned for later this year. Observe Apps are intended to make it easy for IT teams to ingest data that is surfaced via pre-built dashboards that will generate alerts when issues arise.

    Finally, Observe, Inc. has added dashboards that provide transparency into its usage-based pricing model. IT teams can now more easily determine how many credits are consumed by both users and specific datasets to help contain costs.

    Observe, Inc. CEO Jeremy Burton said those tools are crucial because in the absence of tools to control data costs, most organizations will soon discover that observability is unsustainable.

    Of course, it’s not clear yet how many organizations are moving beyond monitoring metrics to embrace observability and launch queries to discover the root cause of performance issues. Many organizations don’t have the level of expertise required to structure such queries. However, as more organizations struggle to investigate and remediate issues impacting customer experience, interest in observability platforms is rising, noted Burton.

    Burton said thus far, as a startup, Observe, Inc. has expanded its customer base by a factor of three to now include 50 organizations, which has resulted in a five-fold increase in the number of monthly active users of the platform. The platform is now ingesting more than 40TB of data each day, with more than 25 million queries each day launched across nearly one trillion rows of more than 10 petabytes of data. Capital One is included among the investors in Observe, Inc.

    At the core of the Observe platform is a graph engine that makes it simpler to uncover the relationships between machine data that is ingested into the platform.

    Going forward, Burton said Observe intends to add support for distributed tracing using the open source agent software created by the OpenTelemetry project that operates under the auspices of the Cloud Native Computing Foundation (CNCF).

    Change within enterprise IT organizations happens slowly. Many will be using legacy monitoring tools alongside observability platforms for years to come. However, there is an opportunity to rationalize monitoring tools as the capabilities of observability platforms continue to expand.

    In the meantime, IT environments will continue to become more complex as more modern applications based on microservices and constructed using containers are deployed. These applications, over time, are generally more resilient than monolithic applications; given all the dependencies between microservices, determining the root cause of a performance issue can be a major challenge. As a result, it may be just a matter of time before this new class of applications ultimately forces the observability issue in the enterprise.

  • The Future of OpenTelemetry for Observability

    The Future of OpenTelemetry for Observability

    The observability landscape is changing. Today’s digital transformation journey has highlighted the need for observability as organizations look to capture, analyze and correlate all data across every level of the application stack including logs, metrics, traces and events. With the rampant rise of data, collecting these signals is imperative to both business insights and system optimization.

    Over the last several years, open source data collection has given software and engineering teams the freedom to decide which technologies they want to standardize on for data collection and which vendors they would like data sent to. While open source data collection brought a lot of freedom and advantages, it also created some new problems. The lack of a single, comprehensive framework for all the critical signals observability tracked created a lot of friction for developers. As we move into the new year, businesses are taking the opportunity to reflect on how they can better use their data and apply intelligence to help customers make decisions and sift through all the noise. Enter OpenTelemetry. 

    What is OpenTelemetry?

    OpenTelemetry is a collection of tools, APIs and SDKs that instrument, generate, collect and export all machine data; it was born from the need to develop an industry-wide standard for software instrumentation. By leveraging a single cloud-native framework to complete observability, OpenTelemetry is becoming the gold standard for collecting machine data. 

    OpenTelemetry consists of three primary components: Specification, collector and instrumentation. The specification uses an API, SDK and the semantic conventions and protocol of OpenTelemetry to determine the cross-language requirements for all implementations. The collector removes the need for multiple data collection agents. It is a vendor-neutral method for receiving, processing, transforming and exporting data. The instrumentation libraries allow users to integrate their applications with OpenTelemetry using auto-instrumentation and support from multiple frameworks and languages. Together they provide a robust framework for companies to disrupt their existing observability practices and amplify them even further. 

    It’s All About the Customers

    Most modern enterprises have complex distributed microservices consisting of tens, hundreds or thousands of components that are all working together to deliver on customer experience. If organizations can’t correlate between those components or the different signals easily, it will slow down a business’s ability to effectively monitor, diagnose and troubleshoot issues. 

    For years, organizations have leaned into observability by relying on multiple infrastructure vendors to gather, enrich and ship data to vendors. Still, many still do not maximize observability’s most pronounced ability: Correlating complex systems and signals. 

    As end users desire deep insight into their data, they also expect vendors to offer the best experience to identify and resolve issues within their systems with the help of observability. With true observability, organizations can give customers back their time to focus on what matters, which is managing the digital experiences for their customers and empowering them to meet their customers’ needs. 

    A Similar Road to Adoption

    Much like Kubernetes has been essential for the growing adoption of software containers, the industry is already witnessing the same adoption approach around OpenTelemetry for observability. Kubernetes won the war for becoming the standard for container orchestration. Now, OpenTelemetry will bring the same standards needed for observability with comprehensive visibility into the health and performance of every layer of the stack. 

    OpenTelemetry has become widely adopted by the software development community, but it’s still at the beginning of its journey. The developer community made Kubernetes a success, and we will see the same with OpenTelemetry as customers demand better integration and less lock-in. For vendors involved around applications and software—from more traditional approaches like application performance management to software development pipelines and management tools and through to cloud-native services—supporting OpenTelemetry will be table stakes in the future. 

    With extensive portability, greater developer control and strong vendor and cloud provider support, OpenTelemetry has opened a new world to customers by helping to improve achievable results across the application infrastructure, from the software development process to areas like security.

    How can businesses continue to move the needle on observability while balancing growing customer demands? Quite simply: If organizations aren’t thinking about OpenTelemetry now, they are losing competitive advantage by lacking the proper visibility to deliver on the service level objectives that customers expect in this day and age. 

  • Splunk Donates eBPF Telemetry Data Collector to CNCF

    Splunk Donates eBPF Telemetry Data Collector to CNCF

    Splunk Inc. announced during the KubeCon + CloudNativeCon North America conference that it donated a data collector to the OpenTelemetry project run by the Cloud Native Computing Foundation (CNCF).

    Splunk’s data collector runs as a sandbox-level program at the kernel of a Linux operating system and takes advantage of extended Berkeley Packet Filter (eBPF) technology to make it simpler to collect networking telemetry.

    The OpenTelemetry initiative itself spans a range of open source tools, application programming interfaces (APIs) and software development kits (SDKs) that are used to instrument applications. Previously, Splunk contributed the SignalFx Smart Agent and Smart Gateway to the OpenTelemetry project along with more than 64,000 code contributions.

    Morgan McLean, a director of product management for Splunk, said that while OpenTelemetry is officially in beta, some elements of the project are more mature than others. For example, tools for capturing metrics and traces are already being employed, while another set of tools for capturing log data will be ready sometime next year, he said.

    The data collector contributed by Splunk is among the first that operate at the kernel level to collect data, added McLean. That approach makes it possible for some types of data to be captured by default rather than requiring developers to always instrument their applications using agents to enable an observability platform. It will also contribute toward the eventual convergence of network operations and DevOps processes.

    Going forward, DevOps teams should expect to employ a mix of open source data collectors that operate at both the eBPF and application level, said McLean. The eventual goal is to instrument every application by default by making it much simpler to collect data. Today, most DevOps teams are employing a mix of proprietary and open source agent software to collect data that then must be deployed and then integrated with all the applications they build. Given the cost and level of effort required, the percentage of applications that are actually instrumented is, not surprisingly, fairly low.

    However, as agent software becomes more readily accessible, the percentage of applications that are instrumented should increase considerably in the years ahead. For DevOps teams that depend on that data to optimize application performance, that capability should prove to be a boon for improving overall observability in IT environments.

    Observability, in one form or another, has always been a core tenet of any DevOps best practice. Initially, DevOps teams focused on continuous monitoring as the most effective way to proactively manage application environments. However, it can still take days, sometimes weeks, to discover the root cause of an issue.

    Monitoring focuses on predefined metrics to identify when a specific platform or application is performing within expectations. The metrics tracked generally focus on, for example, resource utilization. Observability platforms combine metrics, logs and traces—a specialized form of logging—to instrument applications in a way that makes it simpler to troubleshoot issues without relying on a limited set of predefined metrics focused on a specific process or function.

    Those observability platforms then make it possible to correlate events so that it is easier to identify anomalous behavior indicative of an issue’s root cause. Armed with these insights, it becomes a lot simpler for IT teams to resolve issues faster.

    It’s unclear when OpenTelemetry tools will become more widely employed, but as more tools for collecting data become available, the impact on DevOps will be nothing short of profound.

  • Google Donates Sqlcommenter to OpenTelemetry Project

    Google Donates Sqlcommenter to OpenTelemetry Project

    Google announced today that Sqlcommenter, an open source project that provides access to an object-relational mapping (ORM) auto-instrumentation library, is being merged with OpenTelemetry, an open source project for building agent software to instrument applications.

    Nimesh Bhagat, a product manager for Google, said Sqlcommenter is designed to make it simpler to correlate application and database telemetry. OpenTelemetry provides a mechanism for collecting logs, metrics and traces that is being advanced under the auspices of the Cloud Native Computing Foundation (CNCF).

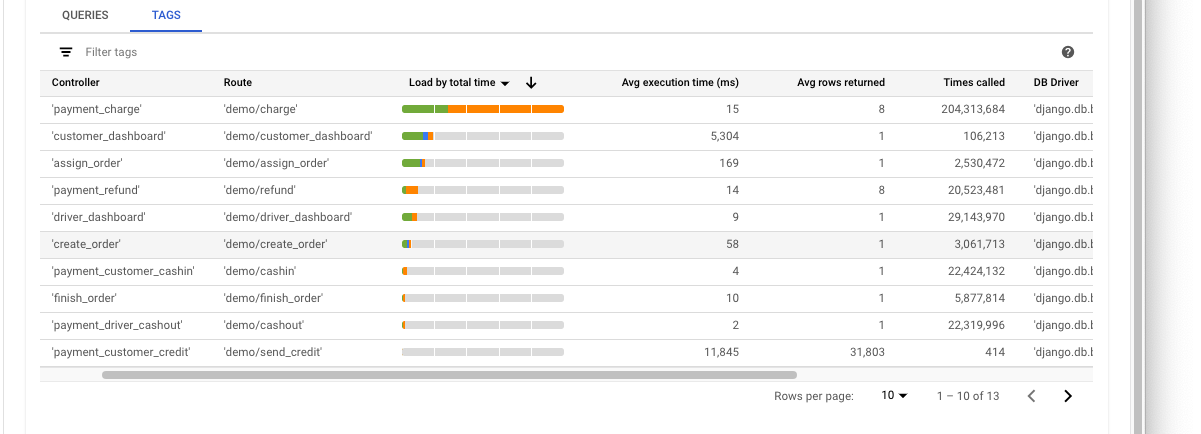
    The challenge organizations using OpenTelemetry to collect that data will face is the need for tools to query that data in whatever platform it ultimately resides, noted Bhagat. OpenTelemetry previously lacked a common standard by which application tags and traces can be sent to databases and correlated with an application stack. Google envisions that IT teams will either employ Sqlcommenter to explore data or access via platforms such as Cloud SQL Insights or a third-party application performance management (APM) platform.

    Google made Sqlcommenter available as open source software earlier this year. It is designed to enable object–relational mappings (ORMs) to augment SQL statements before execution by, among other things, providing access to comments containing information about the application code that caused its execution.

    Sqlcommenter also allows OpenTelemetry trace context information to be propagated to the database, enabling correlation between application traces and database query plans that ultimately should make it easier to, for example, determine the root cause of a performance issue involving a microservices-based application making calls to a database. Sqlcommenter is primarily designed to be employed by full-stack developers that have some familiarity with how to use SQL to query data residing in an observability platform, noted Bhagat.

    Specifically, Sqlcommenter is designed to provide deeper insights into the performance of backend databases by simplifying the process of correlating slow queries with source code. It currently supports Python, Java, Node.js and Ruby languages along with ORMs such as Django, Sqlalchemy, Hibernate, Knex, Sequelize and Rails.

    As the number of applications that are instrumented using open source software continues to steadily increase, the amount of data that a DevOps team could potentially query also will steadily increase. Cloud storage platforms have made it easier to store that data at an affordable cost but the next challenge is clearly going to be finding a way to surface meaningful insights from all that data. Undoubtedly, achieving that goal will require everything from query tools to machine learning algorithms capable of identifying patterns at a level of scale that would not otherwise be possible.

    In the meantime, DevOps teams can look forward to being able to attain a level of observability that previously could only be achieved at a cost that tended to limit the number of applications organizations would instrument. At a time when the dependencies between applications increases with each passing day, that level of observability will soon prove indispensable.