Tag: observability

  • New Relic Taps Generative AI to Simplify Observability

    New Relic Taps Generative AI to Simplify Observability

    New Relic has added a tool that takes advantage of generative artificial intelligence (AI) to make it simpler to query the telemetry data collected by its observability platform via a natural language interface (NLI).

    Jemiah Sius, director of developer relations for New Relic, said New Relic Grok will make the New Relic One platform more accessible to a wider range of IT professionals, especially those that haven’t mastered New Relic’s proprietary programming language that enables DevOps teams to identify the root cause of an issue.

    New Relic Grok automatically pinpoints code-level errors in integrated development environments (IDEs) in addition to analyzing code, stack traces and production telemetry to suggest fixes. New Relic is providing this capability via integration with the large language models (LLMs) created by OpenAI, which is providing the foundation for a broad range of generative AI capabilities through Microsoft. New Relic has a long-standing alliance with Microsoft, added Sius.

    Using plain language, anyone can generate a system or app health report complete with anomalies, issues and recent deployments in a way anyone can understand without having to create and filter dashboards, he noted.

    New Relic Grok also makes it simpler to identify instrumentation gaps that can then be addressed using the instructions it provides. It can also set up missing alerts and automate alerts using the open source Terraform infrastructure-as-code (IaC) tool.

    Finally, IT teams can also use New Relic Grok to manage accounts, users and user access, data retention rules, usage, billing and other administrative tasks.

    New Relic previously invested in machine learning algorithms to automate observability tasks. These AI extensions to the New Relic platform are part of a larger effort to extend the reach of the New Relic One observability platform further left toward developers and IT administrators rather than just site reliability engineers (SREs), said Sius.

    However, New Relic doesn’t anticipate that generative AI will eliminate the need for SREs to use its programming tool to solve more complex problems, he added.

    The overall goal is to provide development teams with frictionless access to observability data at every stage of the software development life cycle to reduce mean-time-to-detection (MTTD) and mean-time-to-resolution (MTTR) of issues.

    In general, most organizations are still in the early stages of achieving full-stack observability. A recent New Relic survey found only 27% of respondents have achieved full-stack observability and only 5% claimed they have a mature observability practice in place. A third (33%) of respondents also said they still primarily detect outages manually or based on complaints, the survey found. On the plus side, the survey also found nearly three-quarters of respondents said C-suite executives in their organization are advocates of observability, and more than three-quarters of respondents (78%) saw observability as a key enabler for achieving core business goals. However, more than half (52%) of respondents said they experienced high-business-impact outages once per week or more and 29% said they take more than an hour to resolve those outages.

    AI, of course, promises to improve reliability. At the very least, it could make it easier to identify issues long before a major disruption occurs.

  • Grafana Labs Reins in Cost of Storing Observability Data

    Grafana Labs Reins in Cost of Storing Observability Data

    Grafana Labs today made available an ability to customize what observability data is collected via its managed cloud service. This capability can help reduce storage costs in addition to enhancing the dashboard Grafana provides to make it simpler to track metrics usage.

    Wayne Jin, vice president of product marketing for Grafana Labs, said both capabilities would make it easier for DevOps teams to track and ultimately reduce the cost of storing the time-series data collected via its cloud platform.

    As more DevOps teams use an observability platform to continuously collect metrics like traces and log data, they are discovering that the cost of storing all that high-cardinality data can easily spin out of control.

    Grafana Labs is now making available an Adaptive Metrics capability that enables DevOps teams to fine-tune what data is collected and stored. However, in the event of an issue, DevOps teams can also turn back on all data the platform can collect to aid an investigation of the root cause of disruption, noted Jin.

    The Cardinality Management dashboards Grafana Labs made available last year for paid tiers of its cloud service are now being made available to users of the free tier of service as well, Jin said. This will further help reduce storage costs by making it easier to identify metrics that are being collected but not used by anyone on the DevOps team, he added.

    The Adaptive Metrics aggregation engine can then be applied to transform these metrics at ingestion into lower cardinality versions. Unused or partially used labels are stripped from incoming metrics, reducing the total count of time-series data collected. Adaptive Metrics also recommends aggregations based on an organization’s historic usage patterns, and DevOps teams can choose which aggregation rules to apply. Dashboards, alerts and historic queries are guaranteed to continue to work as they did before aggregation, with no rewrites needed.

    Based on results reported by early users, Grafana Labs reported that Grafana Cloud Adaptive Metrics could eliminate an estimated 20-50% of the time-series data collected with no perceived impact on observability.

    The Grafana Cloud service relies on an instance of open source Grafana Mimir to store data collected in a format originally defined for the open source Prometheus monitoring tool. While Prometheus is widely employed in Kubernetes environments, it’s also starting to gain traction as a monitoring platform in legacy monolithic environments. The amount of data being collected via that platform over time is steadily increasing. The Grafana Labs approach makes it possible for DevOps teams to reduce that data whenever there is no usage that needs to be investigated, for example.

    It’s still early days as far as adoption of observability is concerned, but in uncertain economic times, there’s generally a lot more sensitivity to the total cost of IT. Many organizations are especially focused on reducing the cost of storing data in the cloud to rein in monthly spending on cloud services. Regardless of the motivation, collecting and storing data that isn’t needed is never the best use of cloud storage resources that, from a cost perspective, are just as finite in the cloud.

  • Observability Costs are too Damn High

    Observability Costs are too Damn High

    Today, any business that deploys software faces an obscene amount of expenses. It has to pay for cloud hosting, assuming of course that it’s among the 92% of companies that use the cloud. It needs trustworthy networks to connect its apps to its employees and customers. It probably pays for a suite of cybersecurity software in a bid to stay ahead of the ever-growing list of cybersecurity threats. All of these costs, which are unavoidable for any company that wants to host modern software, add up to higher overall IT bills.

    But there’s a source of excess spending that has grown tremendously in recent years: Observability. If a company deploys software, they also need to monitor and observe that software to ensure that it meets performance and availability requirements. In recent years, the cost of observability has skyrocketed.

    In fact, according to Charity Majors of Honeycomb, the total cost of observability at an organization today is equivalent to up to 30% of total infrastructure spending. That’s a truly astounding figure, if you think about it. For every dollar spent on the infrastructure that powers applications, 30 cents ends up paying just for the tools and services needed to make sure the apps running on that infrastructure are doing what they’re supposed to.

    On top of this, spending on observability tools has become very unpredictable, meaning companies have no idea what they are going to be paying next week, next month or next year to get the insights they need to manage their applications and infrastructure. In this sense, observability is worse than taxes. With taxes, at least you know ahead of time what you’re going to have to pay in most cases.

    Getting Observability Spending Under Control

    Observability costs won’t go down on their own,  but there are practical steps that organizations can take to get observability spending under control–and they can do it without sacrificing the critical visibility they need to manage complex systems.

    To prove the point, we’ll discuss the reasons why observability has become so expensive. It’s partly about technology, but it also has to do with who gets to make decisions about adopting observability tools and how cultural inertia inside organizations impedes the ability of practitioners to migrate to more cost-efficient observability solutions.

    Then, we’ll talk about actionable strategies for getting observability costs under control. By taking advantage of some new tools and strategies, observability spending can be reined in while also–and this is the best part–actually increasing the organization’s ability to observe and manage complex systems.

    Why Observability Costs so Much

    There’s no one simple reason why observability costs for the typical organization today have increased. Instead, several factors have conspired to bloat observability bills.

    Drowning in Data

    One issue is the sheer volume of observability data that organizations have to collect.

    That’s partly because businesses deploy so many individual applications–207 on average, according to Okta–each of which generates observability data, to say nothing of the infrastructure on which the apps are hosted. But it’s even more so because of the fact that cloud-native architectures have vastly increased the number of application components and services that we need to observe.

    Instead of having one monolithic app and one host server to monitor, today, companies might have two dozen microservices, a Kubernetes orchestration plane, a bunch of nodes and perhaps an underlying IaaS platform, all of which they have to observe just to keep a single app running healthily. That adds up to tremendously more observability data than businesses had to manage in the past.

    Viewed from one perspective, having more observability data is a good thing. The more data there is, and the more granularity that can be associated with particular parts of the stack, the more insights DevOps teams can glean, at least in theory. But the problem is that, in many cases, only a small fraction–perhaps as little as 1%–of the data that is collected and ingested into observability tools is actually ever used to detect or troubleshoot performance issues.

    Granted, part of the reason we collect so much data but use so little is that it’s impossible to know ahead of time which observability data we’ll actually need. But that’s not an excuse for paying for data that never serves a useful purpose. If we’re going to spend so much on observability data, we might as well use more of it while also finding ways to pay less for it.

    Inefficient Data Collection

    The problem of ever-growing data volumes is compounded by the challenge of inefficient data collectors, which translate to higher infrastructure costs.

    Here’s why: The traditional way to deploy observability tools is to rely on agent-based data collectors that run essentially as standalone applications alongside the applications they are monitoring. As a result, the observability agents suck up a non-insignificant amount of CPU and memory, which require more infrastructure resources to support them and, thus, higher costs.

    Hence, one of the grand ironies of our times: To figure out whether their applications are consuming resources efficiently, businesses deploy observability software that actually decreases resource efficiency, while also bloating costs.

    Complex Pricing Models

    The pricing models of the typical observability tool are, in a word, complex. Most vendors charge in part based on how much observability data is ingested into their tools (this is usually the biggest contributor to overall cost), but they might also charge based on how many agents are deployed, how many users the tool has within the organization, and which features are wanted to access. The costs might also vary depending on where the data is chosen to be stored, how long of a retention period, how often it needs to be accessed  and so on.

    Complex pricing makes it hard in many cases for organizations to cost-optimize their observability spending. Determining exactly which features and usage tiers are needed can be a tough job, and companies might easily end up overspending as a result (after all, who wants to risk underspending and ending up with observability gaps that lead to critical failures?). Plus, unlike, public cloud services, there are no cost-optimization tools designed to help businesses “rightsize” their observability tool deployments or architectures.

    Organizational Inertia

    Historically, most observability and APM solutions were designed first and foremost for developers. To use them, developers had to instrument observability into applications. Then, it fell on the operations or DevOps team to connect the apps to APM tools and figure out what to do with the observability data they generated.

    There’s nothing wrong with involving developers in the observability process. However, the pitfall of the developer-centric approach to APM and observability that organizations have tended to follow is that developers typically don’t actually know very much about what the operations team needs to observe. After all, developers build apps; they don’t monitor or troubleshoot them. The result of this is that developers design apps to generate all sorts of observability data that may or may not be useful (which is why, again, organizations end up paying for a whole bunch of data they don’t actually use).

    This might not be much of an issue if it were easy for the operations team to come in and say, “Hey, we’re collecting all this data and it’s dumb. Let’s be more strategic.” But sadly, it’s not. Organizations being organizations, effecting change is not easy, especially if the change means getting people to adopt new tools or practices. So, businesses end up stuck with observability solutions that may have worked well in the past, but that are not efficient by modern standards, due simply to organizational inertia.

    Cost Unpredictability

    As mentioned, the problem with observability costs today is not only that they’re too damn high. It’s also that they’re too damn unpredictable.

    Observability vendors don’t hide their costs, so those are easy enough to predict. But those costs, again, are based largely on how much data is ingested into the observability tool. And how many engineers do you know who can predict with any kind of accuracy how many logs and metrics their applications will generate from one day to the next?

    Most can’t because data volume is tied to application demand, and that’s inherently unpredictable. After all, if we knew exactly how many requests our applications were going to receive from one moment to the next, we probably wouldn’t really need observability at all. But we don’t, and part of the core purpose of observability tools is to ensure that we can detect the issues that arise due to unexpected software usage patterns.

    I am not exactly criticizing observability vendors here, but rather pointing out that their pricing models capitalize on a fundamental limitation of modern applications: The amount of observability data they’ll produce is unpredictable in most cases, which can lead to wild fluctuations in observability spending.

    Keeping Observability Costs in Check

    Just as there’s no one single cause of high or unpredictable observability costs, there’s no one trick that can rein the spending in. But there are several strategies that, used in unison, will bring observability costs under control:

    Analyze Data at the Source

    The more data is moved in order to observe it, the more it will end up costing. By the same token, the more data analyzed at its source, the lower the cost will be.

    This is why, for instance, Kubernetes observability will cost much less if the data is collected and analyzed right inside nodes, instead of shipping it out to an observability platform first. Not only will the results be faster (because there is no need to wait for the data to move) but data that isn’t critical will be able to be ignored , which reduces how much data is ingested into the observability tools and cuts down on overall costs.

    Keep Data at the Source

    In a similar vein, not all data needs to leave its source at all. There might be datathat needs to be kept handy in case it is needed later, but  can not be analyzed right now. Instead of moving it into external storage, which will cost more, it should be kept right where it originated – inside the nodes. It’s there if needed, but there is no need to  payi extra for it.

    Add Efficiency With eBPF

    I mentioned before the grand irony in which organizations end up wasting infrastructure resources to deploy observability tools: There’s a pretty simple solution for that. It’s called eBPF, and it’s an ultra-efficient way to collect observability data. Unlike conventional observability and APM software, eBPF data collectors run directly inside the operating system kernel instead of running as user space applications. That leads to much lower levels of CPU and memory consumption. With eBPF, there is  all the observability needed, without sacrificing resources in the process.

    Affordable Observability

    The cost of deploying software these days is going up overall, but observability costs can actually go in the opposite direction. Thanks to new observability tools and techniques, it’s possible to collect all of the data neeeded, without allocating a tremendous portion of the overall IT budget to it.

    So, say goodbye to bloated budgets, and say hello to affordable observability.

  • Honeycomb Taps ChatGPT to Simplify Observability

    Honeycomb Taps ChatGPT to Simplify Observability

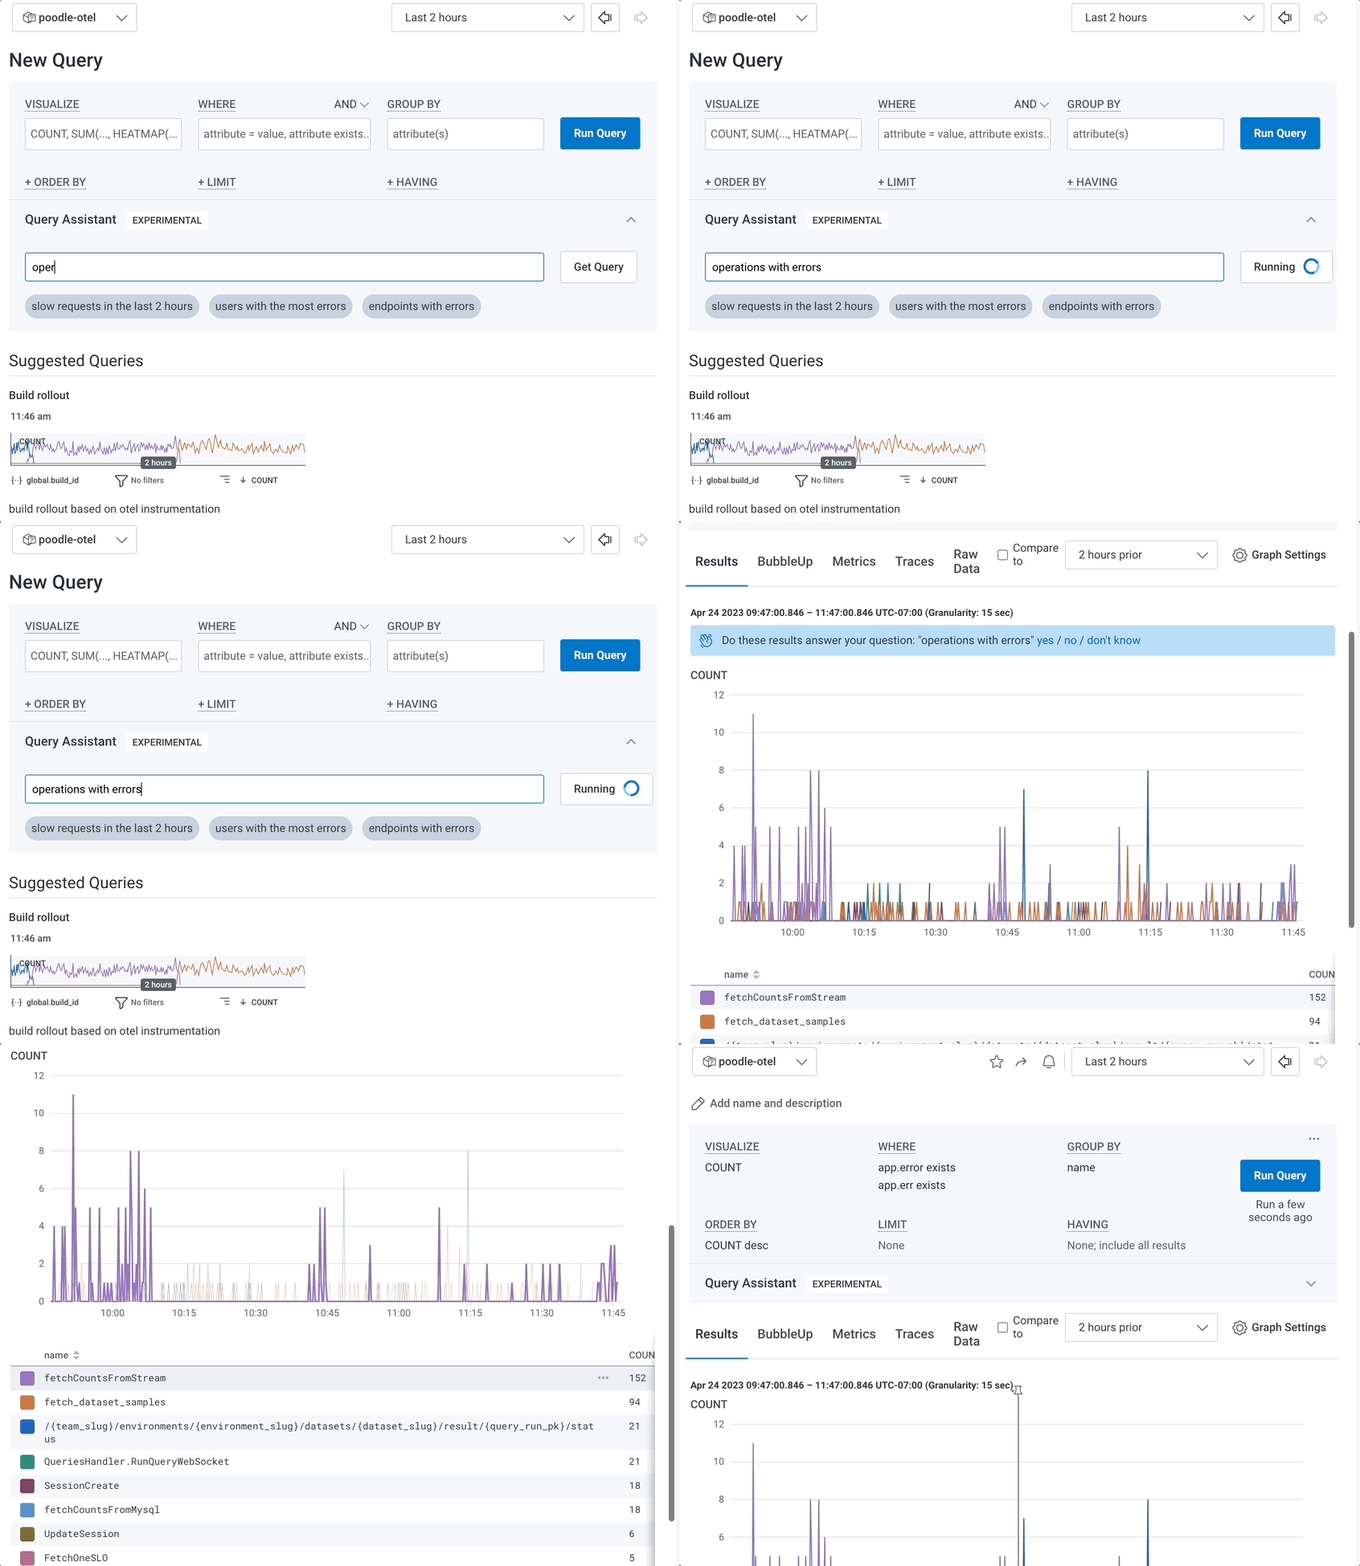
    Honeycomb today added a Query Assistant to its observability platform that uses OpenAI’s ChatGPT generative artificial intelligence (AI) platform to launch queries via a natural language interface rather than having to master a query language.

    That capability complements an existing tool based on machine learning algorithms, dubbed BubbleUP, that DevOps teams already use to debug code.

    Honeycomb CTO Charity Majors said both tools make the Honeycomb observability platform more accessible to IT teams that are tasked with managing complex application environments. Those teams are not going to be able to accomplish that goal without relying more heavily on AI to determine the root causes of an issue.

    Generative AI augments DevOps teams by making it possible to build a relevant, modifiable query that they can continuously iterate as IT staff investigate an issue. This approach means teams don’t necessarily need a deep understanding of code behavior and the underlying infrastructure it depends on, noted Majors.

    That’s critical, because not every IT professional immediately knows what query to launch. One of the challenges with adopting any observability platform is they require a a DevOps team member to frame a query to generate a result. If multiple queries are required, coding them in a query language becomes a cumbersome task.

    As AI continues to improve, algorithms should be able to automatically surface more issues. But given all the dependencies that exist in modern application environments, there will still be a need for a DevOps specialist to ensure application availability and optimize performance, at least for the foreseeable future.

    In general, generative AI represents a significant leap forward compared to AI for IT operations (AIOps) platforms that, in comparison, are not nearly as useful, noted Majors.

    It’s still early days as far as measuring the impact AI will have on DevOps workflows. But the AI genie is already out of the proverbial bottle. Many of the low-level tasks that tend to make DevOps jobs tedious will soon be automated. As a result, job roles within DevOps teams will need to evolve.

    Less clear is what impact the rise of generative AI might have on the adoption of observability platforms. While there is no shortage of observability platforms, adoption has been limited by the number of DevOps professionals that could master a specific query language created for that observability platform. The ability to rely on a natural language interface instead reduces the need to use a proprietary query tool.

    In the longer term, the simpler it becomes to use DevOps best practices, the more widely they will be adopted. AI platforms should enable more organizations to embrace DevOps in a way that reduces the level of cognitive load currently required.

    In the meantime, there’s no doubt that current DevOps professionals are cautiously watching the rise of generative AI, much like everyone else. The difference is that most DevOps professionals are not going to want to work for organizations that don’t provide access to AI-infused tools and platforms that make their jobs easier.

  • Mezmo Adds Free Community Plan for Managing Observability Data

    Mezmo Adds Free Community Plan for Managing Observability Data

    Mezmo this week added a free trial and a community plan for the Mezmo Telemetry Pipeline service to make it simpler for DevOps teams to store and manage the large amounts of telemetry data they are collecting.

    Mezmo CEO Tucker Callaway said as more DevOps teams embrace observability to minimize disruptions to application environments, they are struggling to manage the explosion of data being created. The Mezmo platform makes it possible to apply data engineering best practices to manage that data using a set of drag-and-drop visual tools, he added. A set of data transformation tools also makes it simpler to extract metrics embedded in the logs, summarize events and metrics and then forward those metrics to downstream platforms for analysis.

    The free edition of the platform makes it possible for organizations to begin to apply those capabilities without any upfront costs required, noted Callaway.

    It’s not clear to what degree DevOps teams may need to add data engineering to manage all the telemetry data being collected. It’s already apparent that the cost of storing and managing all that data is becoming a significant issue as more applications are instrumented. In fact, it’s nearly impossible to manage cloud-native applications without being able to observe interactions between the microservices used to construct them.

    Log management has always been a challenge, but with the addition of traces, the amount of telemetry data being collected to surface metrics has increased. The Mezmo platform makes it possible to set a daily or monthly hard limit on the volume of logs stored or, alternatively, set soft daily or monthly quotas that can apply throttling logic to ensure mission-critical log data will continue to flow.

    DevOps teams can also make use of soft limits to reallocate storage resources from one team to another based on how much log data might be generated for a specific amount of time.

    Reducing storage costs has naturally become a higher priority during challenging economic times, so there’s a lot more pressure for DevOps teams to be more efficient. Finance teams are reducing costs by, for example, applying quotas to the amount of storage resources being made available to individual DevOps teams. The days when cloud storage resources were made available indiscriminately are over.

    It’s not clear how quickly DevOps teams are embracing observability, but it is certain that relying on predefined metrics to monitor IT environments is no longer sufficient. DevOps teams need to be able to query telemetry data to, for example, identify bottlenecks that are often created by dependencies between microservices. The issue is striking a balance between the amount of data being collected and the cost of storing it all.

    Regardless of approach, observability is rapidly becoming a requirement for DevOps teams to succeed. In fact, there is already no shortage of observability platforms to choose from. The issue is that not every observability platform provider is equally concerned about the cost of storing all the data being collected.

  • InfluxData Makes Processing Observability Data at Scale More Efficient

    InfluxData Makes Processing Observability Data at Scale More Efficient

    InfluxData today made available an update to its open source time series database that can now analyze metric, event and trace data in a single datastore with unlimited cardinality in terms of how they are aggregated.

    The company is now making available a single-tenant instance of InfluxDB as a managed service alongside its already-existing multi-tenant cloud service that is based on a serverless architecture.

    Finally, InfluxData also announced that later this year it will make available InfluxDB 3.0 Clustered and InfluxDB 3.0 Edge to provide a curated version of the database that organizations can deploy themselves where they best see fit.

    InfluxData CEO Evan Kaplan said InfluxDB has been developed to support a wide range of emerging applications that require access to time series data, including the observability platforms core to DevOps workflows that require visibility into metrics, events and trace data.

    Over the past three years, InfluxDB has been revamped to run on a columnar engine, dubbed IOx, that leverages the open source Apache Arrow memory format and written in the Rust programming language. Kaplan said that approach makes it possible to continuously ingest, transform and analyze hundreds of millions of time series data points per second without limitations.

    At the same time, InfluxDB takes advantage of high compression object storage to reduce the total cost of storing all that data. It also provides interoperability with Open Data Architecture (ODA) to integrate with data lakes based on open source platforms such as DataFusion, Flight SQL and Parquet that are being advanced by the Apache Software Foundation.

    The arrival of version 3.0 of InfluxDB comes as many DevOps teams are starting to struggle with the amount of observability data being generated. DevOps teams want to be able to move beyond monitoring a set of pre-defined metrics and query data in a way that enables them to surface anomalies indicative of a potential issue before there is a major disruption to an application service.

    One of the major challenges today is the tradeoff between how much data is collected and analyzed versus the cost of processing and storing it. InfluxDB provides a mechanism for analyzing high cardinality data involving metrics, events and traces cost-effectively.

    Observability is, of course, only one of several use cases for a time series database capable of processing data in near-real-time. As organizations embrace digital business transformation initiatives, they need to be able to process data in near-real-time at the point where it is being created and consumed. Those applications won’t necessarily replace existing applications based on batch-oriented processing but, over time, they create two distinct classes of applications that process data in fundamentally different ways. The challenge, as always, will be defining the DevOps workflows required to manage applications running on multiple distinct types of architectures.

  • The Best (and Worst) Reasons to Adopt OpenTelemetry

    The Best (and Worst) Reasons to Adopt OpenTelemetry

    It was a rainy day in Seattle at KubeCon + CloudNativeCon North America in December 2018 when I first encountered the term ‘OpenTelemetry.’ At that time, I was an active member of a working group focused on developing W3C Trace Context, a standard now extensively employed for context propagation in distributed systems. It is likely no coincidence that some key individuals in this working group also played a pivotal role in orchestrating the merger between two prominent open source telemetry products: OpenCensus and OpenTracing. I never would’ve guessed that, in 2023, OpenTelemetry would become the second-largest project in the CNCF, sitting just behind Kubernetes.

    As is the case with any popular new technology like OpenTelemetry, the hype can make it difficult to discern signal from noise. During my years working in observability, I’ve had the chance to chat with many organizations that were thinking about using OpenTelemetry or already actively use it. Through those conversations, I’ve heard many reasons for adopting OpenTelemetry, some good and some bad. In this post, I will share examples of the best and worst reasons to adopt OpenTelemetry to help you cut through the noise.

    Poor Reason One: Following the Crowd

    It’s never a good idea to adopt something solely because others are doing it. Just because you saw a conference talk praising a new technology as the greatest innovation since sliced bread doesn’t necessarily mean that technology is suitable for your specific use case.

    Speaking of which, have you clearly defined your use case? To start, ask yourself the following three questions:

    1. Are you able to determine at any given moment whether your systems are performing as expected, such as meeting their service level objectives (SLOs)?
    2. When something goes wrong, can you easily pinpoint the root cause?
    3. Are you able to drill into previously unidentified problems, also known as “unknown unknowns”?
    If you answered these questions with “no,” you certainly have observability gaps worth tackling, and OpenTelemetry may help close some of them.

    Poor Reason Two: Building Your Own Observability Product

    Gathering telemetry data can be a challenge, and with OpenTelemetry now handling essential signals like metrics, traces and logs, you might feel the urge to save your company some cash by building your own system. As a developer myself, I totally get that feeling, but I also know how easy it is to underestimate the effort involved by just focusing on the fun parts when kicking off the project. No joke, I’ve actually seen organizations assign teams of 50 engineers to work on their observability stack, even though the company’s core business is something else entirely.

    Keep in mind that data collection is just a small part of what observability tools do these days. The real challenge lies in data ingestion, retention, storage and, ultimately, delivering valuable insights from your data at scale. Chances are, a homegrown solution won’t give you a return on investment that your company would appreciate.

    However, whether you build your own system or use an existing product, OpenTelemetry may be a good fit for your observability stack.

    Poor Reason Three: ‘Vendor Neutrality’

    People I chat with often cite vendor neutrality as a major reason for their interest in OpenTelemetry. While there’s some truth to this, which I’ll touch on shortly, it’s important to take this argument with a grain of salt to avoid over-promising your management.

    If you’re a developer, you’ve likely worked with database abstraction libraries and have probably mentioned to someone that they allow you to swap out the database at any time–using MySQL today and Oracle tomorrow, for instance. While that’s the promise, I’ve never seen this happen in my career. There’s more to consider other than the SQL dialect when switching a database backend.

    In the same vein, the idea of vendor neutrality suggests that you can easily switch your observability backend. While this might be true in theory, in practice, vendor lock-in often occurs on the backend, where people and processes become closely tied to the tool currently in use.

    So, if you believe you’ve achieved vendor neutrality by going all-in with OpenTelemetry, I’d encourage you to think twice and consider building a stronger case. Vendor neutrality should not be your only reason.

    With all that said, it’s time to focus on the good reasons to use OpenTelemetry today. Trust me, there are plenty, and they’re definitely worth considering.

    Good Reason One: Bridging Gaps With Manual Instrumentation

    Nearly every observability tool out there today relies on some degree of auto-instrumentation. This means once you’ve added their respective language SDK to your code, the library will utilize a technique called “monkey patching” to insert observability code that runs automatically.

    At the very least, auto-instrumentation will search for recognized libraries and APIs and then add some code to indicate the start and end of well-known function calls. Additionally, auto-instrumentation takes care of capturing the current context from incoming requests and forwarding it to downstream requests.

    However, auto-instrumentation falls short when it comes to pure userland code, particularly for dynamic languages like JavaScript. It won’t catch your blocking Fibonacci function that’s slowing down all your requests by 50%. In some cases, you might also have to add your own context-propagation logic to RPC calls not captured by the auto-instrumentation.

    That’s where manual instrumentation comes in. In the past, vendors provided an API for their SDK, allowing developers to manually add instrumentation code to segments that weren’t auto-instrumented. This often resulted in code being littered with vendor-specific instructions. This brings us back to the topic of vendor neutrality. While adding a dependency to your project is usually no big deal, it becomes cumbersome when 20% of your codebase is made up of vendor-specific observability instrumentation.

    OpenTelemetry addresses this issue by offering both auto-instrumentation and a vendor-neutral API for manual instrumentation. This allows observability vendors to access the data while maintaining vendor neutrality within your codebase.

    Good Reason Two: Sending Data to Multiple Vendors

    I’ve yet to come across a large organization that relies on just one observability tool. Different parts of the organization have unique needs and perspectives when it comes to data, and it’s rare that a tool designed for SREs satisfies all use cases developers have and vice versa.

    At the same time, it’s not practical to instrument code specifically for each vendor. Doing so would lead to performance issues and other problems, such as double-tracing. For example, if multiple vendors modify an outbound HTTP request to add context, which one takes precedence?

    OpenTelemetry addresses this by offering a unified way to instrument code and multiple integration points where vendors can capture the collected data and send it to their respective backends. As a result, a single application can send data to multiple observability backends with a minimal added performance impact.

    Good Reason Three: Gaining Insight Into Third-Party Libraries and Services

    In an era where many applications depend on third-party libraries and services, gaining insight into all your application dependencies has become increasingly difficult. It’s also challenging for observability vendors to keep up with every new library and service that’s released.

    Traditionally, vendors would try to reverse-engineer these services and apply the aforementioned monkey patching to add in their code. However, since every vendor must do this for each service, it ends up being a lot of redundant work. A key goal of the OpenTelemetry project is to make it easy for infrastructure and library vendors to add instrumentation hooks to their code. This way, their offerings can be monitored without the need for reverse engineering. The observability community is gradually making progress on this goal. One successful example is Istio, which emits OpenTelemetry data that can be easily consumed by observability backends to understand what’s happening inside the service mesh.

    Unsurprisingly, cloud vendors like AWS, Microsoft and Google are among the founding members of the OpenTelemetry project. They share a strong interest in defining a format that allows observability vendors to seamlessly consume data from cloud services. OpenTelemetry Protocol, or OTLP, is set to become the standard for emitting observability data from these services that would otherwise be black boxes.

    Wrapping it Up

    “If all you have is a hammer, every problem looks like a nail.” This statement holds especially true when selecting tools in the tech industry. While there are many good reasons to adopt OpenTelemetry, it’s crucial to approach technology choices pragmatically.

    Avoid jumping on the bandwagon for its own sake; instead, carefully evaluate your use case and assess the available tools. OpenTelemetry is undoubtedly here to stay, and if you’re new to the topic, taking a closer look at the project and adding it to your toolbelt makes perfect sense.

    And don’t forget: OpenTelemetry is open source. Your contribution is always appreciated.

  • Fiberplane Adds Open Source Libraries to Automatically Collect Metrics

    Fiberplane Adds Open Source Libraries to Automatically Collect Metrics

    Fiberplane today added an ability to automatically collect metrics in real-time and make them accessible either via its namesake notebook software for debugging infrastructure or an open source Grafana dashboard.

    Fiberplane CEO Micha Hernandez van Leuffen said Autometrics is an open source set of libraries the company created to make it simpler for developers to see platform performance metrics using a set of tools embedded within their integrated development environment (IDE).

    The goal is to reduce the cognitive load on developers; today, developers need to first determine what metrics to track, find a way to collect the appropriate data and then launch queries against those metrics to determine the root cause of an issue, said Hernandez van Leuffen.

    Autometrics, in contrast, provides access to a set of common queries using the Prometheus programming language (PromQL) against data that has been collected using open source OpenTelemetry agent software, he noted.

    That approach, for example, makes it simpler to track error rates, response time and latency of any function. Links to live charts based on real-time data can also be inserted into the comments section of any document a development team creates.

    The Fiberplane notebook uses the same operational transformation algorithm embedded within Google Docs to enable teams to easily collaborate around a document or spreadsheet. The core platform itself is built in Rust and WebAssembly (Wasm) to make it simpler to integrate Fiberplane as a plug-in into an existing DevOps workflow.

    Autometrics extends that capability in a way that enables DevOps teams to provide developers with instant access to observability data. They can then see how their code is performing on any given platform, which is critical as more responsibility for running applications continues to shift left, said Hernandez van Leuffen. Today, many developers need to wait for an IT operations team to share data collected via an observability platform that was designed to be used by ITOps rather than a developer, he added.

    As observability capabilities become more federated across the entire software development life cycle, it’s critical to make sure developers and IT operations teams can see metrics being generated in real-time. Otherwise, confusion arises because teams are not looking at the same set of metrics.

    Fiberplane address that issue by taking the concept of notebooks—often used by data science teams to collaborate—and applying it to DevOps workflows to reduce the amount of time it takes to resolve any issue. As IT environments become more distributed in the age of the cloud and microservices, troubleshooting issues invariably spans the responsibilities of multiple members of an IT team. In effect, a notebook makes it possible to spin up a virtual war room on demand that enables the members of an IT organization to collaborate—regardless of where they are physically located or which organization they may be employed by.

  • New Relic Bets on AI to Advance Observability

    New Relic Bets on AI to Advance Observability

    New Relic is preparing to extend the capabilities of its observability platform by making use of both additional machine learning algorithms and the ChatGPT generative artificial intelligence (AI) platform.

    Peter Pezaris, senior vice president for strategy and experience at New Relic, said during an interview on an episode of TechStrong TV that a prototype of an AI model created using machine learning algorithms will automatically notify developers when code in a production environment is not performing well—right within their integrated development environment (IDE). The notification will then take developers to the precise line of code identified as the root cause of the issue, he said.

    DevOps teams will need to add two lines of code to applications running in production environments to take advantage of this capability. New Relic also plans to use a similar approach to integrate with generative AI platforms such as ChatGPT to create suggestions for fixing code, he added. ChatGPT now makes it possible to create entire programs in ways that output HTML and JavaScript code, so DevOps teams should expect to be able to use the platform to create natural language queries that invoke the proprietary query language New Relic makes available for its observability platform, he noted. Conversely, ChatGPT will make it possible to explain how a piece of code functions in plain language, Pezaris added.

    Previously, New Relic employed a similar approach to integrate its observability platform with machine learning operations (MLOps) platforms used to build and deploy AI models. This was part of a larger effort to integrate MLOps and DevOps workflows, added Pezaris.

    These AI extensions to the New Relic platform are part of a larger effort to extend the reach of the New Relic One observability platform further left toward developers. Most recently, New Relic added a free CodeStream module to its observability platform to give developers access to metrics and telemetry data that will enable them to write higher-quality code faster.

    That approach eliminates the need to wait for IT operations teams to surface issues that usually don’t manifest until long after the code in question was originally developed. The overall goal is to provide development teams with frictionless access to observability data at every stage of the software development life cycle to reduce mean-time-to-detection (MTTD) and mean-time-to-resolution (MTTR) of issues.

    Organizations should also be able to reduce technical debt faster by making it easier to identify issues that, for example, adversely impact application performance.

    In general, most organizations are still in the early stages of achieving full-stack observability. A recent New Relic survey found only 27% of respondents have achieved full-stack observability, and only 5% claimed they have a mature observability practice in place. A third (33%) of respondents also said they still primarily detect outages manually or based on complaints, the survey found.

    On the plus side, the survey also found nearly three-quarters of respondents said C-suite executives in their organization are advocates of observability, and more than three-quarters of respondents (78%) saw observability as a key enabler for achieving core business goals. However, more than half (52%) of respondents said they experienced high-business-impact outages once per week or more and 29% said they take more than an hour to resolve those outages.

    The hope is, of course, that by augmenting DevOps teams with AI capabilities, the number of those outages will be dramatically reduced in the months and years ahead.

  • The Power of Observability: Performance and Reliability

    The Power of Observability: Performance and Reliability

    Observability has become an essential aspect of modern IT, and its importance is only expected to increase in the years to come. The ability to monitor and understand the behavior of systems in real-time provides organizations with a wealth of information that can help them improve the performance, reliability, and overall health of their networks and applications.

    By collecting and analyzing data from a variety of sources, observability enables organizations to proactively address issues before they escalate into major problems. This proactive approach to problem-solving can help businesses avoid costly downtime and lost productivity, ultimately leading to increased customer satisfaction and business growth.

    Current Challenges Facing Today’s Organizations

    Despite its many benefits, achieving proper observability can be challenging, particularly in today’s complex and highly dispersed technology landscape. The sheer volume of data generated by siloed networks and applications can overwhelm even the most sophisticated monitoring tools. However, with the right approach, tools and processes, organizations can overcome these challenges and fully realize the potential that observability has to offer.

    One of the biggest obstacles to achieving comprehensive network observability is the fragmentation of data sources. Logs, metrics, events and other types of data all require different tools to collect and store them, making it difficult to get a complete picture of network performance. To overcome this challenge, organizations must adopt a holistic approach that integrates the right tools and processes to collect and analyze all relevant data.

    This holistic approach involves the use of advanced monitoring tools that can collect and analyze data from multiple sources, as well as the implementation of best practices for data management and analysis. By taking a comprehensive approach to observability, organizations can gain a deeper understanding of their networks and applications, identify potential issues before they become major problems, and ultimately drive business growth and success.

    Best Practices for Performance and Reliability

    First, proper tooling is crucial for organizations to perform a comprehensive analysis of data. This enables cross-domain correlation to achieve meaningful insights. A data-centric approach relying on contextual information can help organizations “connect the dots” and make informed decisions. In addition, organizations must also prioritize data quality to ensure that they are analyzing accurate and reliable data. Poor data quality can lead to incorrect conclusions and poor decision-making, which can have negative impacts on network performance and business outcomes. To ensure data quality, organizations must invest in proper tooling and processes that can validate and verify data accuracy, consistency and completeness.

    Second, having a network data source of truth is crucial for organizations to effectively analyze and make informed decisions based on their data. The ability to extract metadata from existing sources to provide contextual information is also vital to “connecting the dots” across multiple domains to uncover valuable insights. The metadata serves as the ultimate enabler in this process, allowing organizations to gain a comprehensive understanding of their data to make informed decisions. By establishing a network data source of truth and extracting the necessary metadata, organizations can effectively analyze and use their data for more meaningful insights.

    Third, it is important to ensure that observability is incorporated into the entire development lifecycle to support end-to-end visibility. This means accounting for instrumentation as part of the design and planning phases, as well as testing, deployment and ongoing maintenance. By making observability a central part of the development process, organizations can identify and resolve issues before they become major problems. Additionally, incorporating observability into the development lifecycle can also improve the overall performance of the system by identifying bottlenecks and areas for optimization. It can also help to improve the overall security of the system by detecting anomalous behavior and potential vulnerabilities. Moreover, having observability throughout the development process can enable teams to make informed decisions based on real-time data and analytics, leading to more efficient and effective development practices.

    The fourth best practice is to use a centralized observability platform that allows for the collection and analysis of data from all systems and infrastructure. This platform should be able to collect data from all parts of the organization’s technology stack, including databases, servers and applications. Additionally, the platform should be able to correlate data from multiple sources to provide a comprehensive view of the organization’s operations. This centralized approach ensures that all stakeholders have access to the same information, reducing the likelihood of miscommunications and ensuring that everyone is working towards the same goals.

    Last is the democratization of data. This is crucial for organizations as it empowers teams from multiple functions to access and use data effectively. This leads to increased transparency and collaboration, allowing organizations to make data-driven decisions and drive innovation. Democratization also helps to break down silos, increase visibility and facilitate faster problem-solving for improved decision-making. The key to achieving comprehensive network observability is collaboration between teams. Siloed teams and processes can lead to gaps in data collection and analysis, as well as delays in issue resolution. Therefore, organizations must encourage cross-functional collaboration between teams responsible for network infrastructure, application development and operations to promote a shared understanding of network performance and enable faster problem resolution.

    Observability is a Key Discipline

    In conclusion, observability is a key discipline that can help organizations achieve superior performance and reliability in their systems. By following the best practices suggested above and embracing a comprehensive approach, organizations can overcome the challenges of data fragmentation and unlock the full potential of observability. As technology continues to evolve and become more complex, observability will only become more important, making it essential for businesses to prioritize this aspect of their IT strategy.