Tag: observability

  • Apica Acquires LOGIQ.AI to Unify Observability

    Apica Acquires LOGIQ.AI to Unify Observability

    Apica, a provider of a synthetic monitoring and observability platform, has just raised an additional $10 million in funding and has agreed to acquire LOGIQ.AI. LOGIQ.AI is a provider of a data fabric infused with machine learning algorithms.

    Jason Haworth, chief product officer for Apica, said the data fabric developed by LOGIQ.AI will be incorporated into the Apica Ascent platform in the third quarter. The LOGIQ.AI addition will apply artificial intelligence (AI) in a way that both optimizes and enriches data collected by the company’s observability platform.

    At the core of the Apica Ascent platform is an indexing engine built on top of a Kubernetes platform that aggregates data such as logs, traces and network packets from multiple sources. As part of that process, the platform reduces storage costs by trimming excess data that can be stored in a data lake it provides or a third-party data lake a customer prefers.

    At the same time, Apica also enables DevOps teams to both normalize data collected from multiple sources and enrich it to add additional context, said Haworth.

    The overall goal is to provide a unified view of all IT data to accelerate faster root cause analysis and reduce the total cost of collecting the data required, he added.

    Apica is making a case for an observability platform that goes beyond collecting data from DevOps platforms. As IT environments become more complex, IT teams need to be able to correlate data collected from a wide range of data sources to accurately determine the root cause of an issue, said Haworth.

    The challenge is managing the massive amount of data that needs to be continuously collected, stored and analyzed to achieve that goal, he added. The acquisition of LOGIQ.AI will enable Apica to embed a data fabric that employs machine learning algorithms and other data science techniques to make it feasible to observe complex IT environments at scale, noted Haworth.

    It’s still early days as far as observability is concerned, but it’s clear that IT teams need to move beyond monitoring a pre-determined set of metrics to manage complex and dynamic application environments. The rate of change to application environments as updates are made requires an ability to query data to determine the root cause of issues that could be caused by any number of dependencies.

    The issue is that even when IT teams have access to an observability platform, they may not have the knowledge and expertise required to craft the queries needed to determine the root cause of an issue. Machine learning algorithms will play a major role in enabling IT teams to proactively discover issues that they can investigate using the suggested queries.

    It’s only a matter of time before most IT organizations unify observability data within a single platform. That will make it simpler for them to collaborate across teams and should result in fewer disruptions as IT issues are discovered more quickly. After all, the best kind of IT incident is the one that never happened or that was too trivial for anyone outside of IT to even notice.

  • New Relic Extends AI to Identify Alert Coverage Gaps

    New Relic Extends AI to Identify Alert Coverage Gaps

    New Relic this week added additional artificial intelligence (AI) capabilities to its observability platform that make it possible to detect and resolve alert coverage gaps.

    Camden Swita, a senior product manager for New Relic, said it’s not uncommon for DevOps teams to discover an issue that the existing alerts they put in place were not designed to address. New Relic is adding machine learning algorithms at no additional cost that are designed to identify anomalies indicative of those potential issues. The platform then surfaces recommended alerts that DevOps teams can apply or further customize as they see fit, he added.

    Those machine learning algorithms ensure DevOps teams are tracking the right thresholds to ensure there are no blind spots that could adversely affect application performance, noted Swita.

    New Relic is employing both predictive and generative AI to enable DevOps team to detect and resolve issues faster. The company has been using machine learning algorithms for predictive AI for several years and, more recently, started providing early access to a generative AI tool dubbed Grok.

    The overall goal is to make the capabilities of an observability platform more accessible, Swita said. This is accomplished by surfacing issues without requiring a software engineer to craft intricate queries to interrogate metrics, logs and traces, he noted.

    The AI capabilities also serve to reduce the amount of alert noise; it’s now possible to more easily understand the root cause of an issue and reduce the total number of alerts that might otherwise be sent, he added.

    While there’s no doubt AI will help democratize DevOps by making it possible to write scripts and better manage workflows, it might be a while before DevOps teams trust the recommendations made. AI models typically require some time before they understand how an IT environment functions, and not every initial recommendation may be valid. In time, however, DevOps teams will find themselves increasingly supervising processes that AI models are executing.

    In addition, there are competing approaches to building large language models (LLMs) that drive generative AI. For example, it’s not clear whether chaining LLMs together will be more efficient than creating a single large ‘parent’ LLM that has ‘child’ relationships with smaller LLMs, noted Swita.

    In the meantime, DevOps teams would be well-advised to list tasks that are likely to be automated by AI models. Many of them will tend to be manual tasks that most software engineers don’t especially relish, so in that regard, there’s naturally a lot of interest in AI. It remains to be seen, however, whether various forms of AI might one day automate an entire DevOps workflow. In fact, most DevOps engineers are going to set a high bar for AI models that, at the very least, will be expected to perform a task as well as humans before it’s trusted completely.

  • How Observability and Explainability Benefit the SDLC

    How Observability and Explainability Benefit the SDLC

    Software systems require continual modification to meet changing requirements, address errors, improve performance and enhance reliability. Yet, maintaining and modifying complex and distributed software systems as they change and grow can present challenges. When systems are designed with observability and explainability in mind, adapting, expanding and troubleshooting software becomes easier and more effective. Observability refers to the ability to discern and monitor software systems’ real-time behavior and performance. This allows developers to identify and fix issues before they become critical. Explainability articulates how and why the software system operates.

    Both observability and explainability can contribute to the health of the software development life cycle by improving visibility and transparency, helping developers better understand the system’s overall behavior, and allowing the easy identification of errors, all of which contribute to the software system’s overall stability.

    Overview and Benefits of Observability

    Observability combines data from various sources, including application performance management (APM) monitoring, infrastructure monitoring, distributed tracing, third-party integrations and machine-language data. The data is then structured and presented in an accessible way. The first step to building an observable workflow is to identify which metrics best measure the behavior and performance of a software system. This will vary based on the specifics of the system. As a software system operates, logs and traces keep track of activities, requests and responses. They can be used to find the causes of errors and performance bottlenecks. Application performance monitoring (APM), infrastructure logs, machine logs and application traces are just a few examples of logs and traces. These records provide the necessary data to create dashboards and visualizations, which can then be presented to organizational stakeholders.

    While observability is often compared to software monitoring, which generates data focusing on various metrics related to application performance, it differs from monitoring in several respects. Monitoring tracks raw data related to a few performance metrics. It provides information that is best used by the operations team. Observability uses a large amount of structured data to provide a more robust, accessible picture of the whole system, from front end to back end, that can be understood by employees throughout the organization—even those who do not work in development or lack a technical background entirely.

    Advantages of Explainability

    Explainability refers to transforming machine data into a clear articulation of how a software system works such that others outside the organization can understand it. This capability empowers developers and users alike by enabling them to understand what a software system does and how and why it does it, providing a deeper understanding of why errors occur and how to fix them. Presenting data in a visual format is often a vital part of explainability.

    Explainability is especially important in artificial intelligence (AI) and machine learning (ML) systems, where it constitutes a cornerstone of ethical AI development. Model tracing, which refers to monitoring an ML model as it executes to understand its decision-making process better, is a key component of explainability in ML.

    Best Practices and Common Issues With Observability and Explainability

    Before adding observability or explainability to the software development life cycle, it is important to revisit software life cycle best practices and examine what kind of data is being generated. Not all data is meaningful or useful in observability and explainability. Structuring and ordering data from logs and traces is time-consuming but vital to correctly analyze and draw conclusions from the data. For optimal results, it is important for traces to be appropriately tagged and named consistently according to conventions.

    Additionally, the tools used to implement observability and explainability can be complex. For organizations to achieve maximum benefits from these strategies, it’s important for employees to familiarize themselves with the tools and develop specialized knowledge and skills, which can take time. Finally, there are costs associated with implementing observability and explainability. On one hand, commercial software tools come with licensing costs, which can pose a barrier for small businesses. On the other hand, open source alternatives often do not perform well because they lack the funding and resources required to continuously update and enhance the software.

    Harnessing the Power of Observability and Explainability

    Observability and explainability have numerous benefits for organizations that use flexible, ever-changing and complex software systems. Any company interested in building smoother-functioning software applications stands to benefit. Though both observability and explainability require upfront investments of time and money, these investments pay off in the form of quicker and easier error correction, with resolution occurring in minutes rather than hours or days, and greater application stability. In customer-facing applications, this results in fewer crashes and a better experience for the user. Increased stability also makes it easier to scale applications without losing performance. As these benefits become more apparent, a significant number of companies will likely develop software solutions that are reliable, cost-effective and accessible. This will increase the adoption of observability and explainability, which will continue to influence the evolution of software systems.

  • Using Observability to Create a Smart Data-Driven Culture

    Using Observability to Create a Smart Data-Driven Culture

    The first words that come to mind when talking about smart technologies are often artificial intelligence, machine learning and automation. While these smart technologies play a crucial role in smart-driven cultures, they are not the sole factor in making workplaces “smart.” Organizations that have a smart-driven culture, or data-driven culture, also promote innovation. An innovative organization actively encourages creativity, exploration and the pursuit of new ideas, continuously developing and implementing groundbreaking solutions, products and processes. Innovative companies with a culture of learning and growth are often seen as desirable employers and have high employee retention rates, attracting top talent.

    Let’s go over the benefits of a smart-driven culture and how an observability platform can help your company become data-driven in five steps.

    Why is Smart-Driven Culture Important

    You can increase efficiency and productivity among your employees by fostering a smart-driven culture. Smart technologies are able to automate repetitive tasks and streamline processes, which helps free up workers’ time and focus on other issues instead.

    A data-driven culture can also drastically improve decision-making on a company level. Your organization will begin to strategize and act on objective insights rather than guesswork or assumptions. Through collecting, analyzing and interpreting data, you will not only be able to make informed decisions but also know how to optimize processes and mitigate risks.

    Use data to better understand your customers’ preferences and improve your products to meet their demands more effectively. For example, leverage smart technologies and create high-tech touchpoints to tailor each of your customer’s experiences. A culture that encourages continuous learning, experimentation and adaptation is ready to navigate market shifts, changing customer needs and emerging technologies.

    How to Create a Data-Driven Culture in Five Steps

    According to the 2023 Data Analytics Survey conducted by New Vantage Partners, 79.8% of data leaders identified people, business processes and organizational alignment as the principal challenge to becoming data-driven. These folks cited cultural issues, including organizational receptivity to change, communication and organizational alignment, as the greatest obstacles to realizing business value.

    One way to overcome these challenges is by harnessing the power of observability, building data literacy and organizational transformation. Observability refers to the practice of gaining real-time insights into systems, applications, and processes through the collection and analysis of relevant data. Real-time insights will enable your organization to make data-driven decisions, understand your customers better and quickly identify areas of optimization to improve your products.

    These characteristics are fundamental to smart-driven companies, enabling them to stay competitive and drive innovation in the market. Take the following five steps to ensure you’re maximizing the potential of observability and paving the way toward becoming a smart-driven organization:

    1. Define Clear Goals

    Start by defining what a smart-driven culture means for your company. Write down clear outcomes that you want to achieve with a new culture, and identify the specific areas where observability can make a significant impact on your team.

    Focus on areas where real-time insights derived from observability can generate substantial business value. Set SMART (specific, measurable, achievable, relevant and time-bound) goals that can be tracked over time. For example, you could aim to reduce website loading time by 20% in the next two months in order to increase customer conversion.

    2. Implement Robust Observability Tools

    Evaluate and choose observability tools that align with your organization’s specific needs and goals. Look for tools that offer features such as real-time monitoring, log management, distributed tracing, advanced analytics and visualization capabilities.

    Consider factors like scalability, ease of use, integration with existing systems, and the ability to handle diverse data sources. Remember that the availability of accurate and timely insights promotes a culture that values data and encourages performance for achieving business objectives.

    Ask your IT department to help set up your observability tools to gather the relevant data. For our previous example goal of improving website loading times, this will mean gathering real-time data on website performance, such as server response times, page load speeds, and user interactions.

    3. Promote Data Literacy

    Your observability tools are of little help if no one understands how to use and derive helpful insights from the data you gather. Educate all of your employees on good data practices and the role of analytics in decision-making.

    Provide training and support on the data tools you have chosen and encourage your employees to understand, interpret and utilize data effectively in their day-to-day work. For instance, in meetings, you can ask for data points to back up business decisions.

    4. Encourage Collaboration and Knowledge Sharing

    Creating cross-functional teams and encouraging collaboration among different departments, such as IT, operations and analytics, is crucial for the successful implementation of observability practices.

    Taking an interdisciplinary approach allows for a better understanding of the systems and data within the organization. This can lead to the identification of optimization opportunities, help break data silos and practice collective problem-solving as a result.

    5. Iterate and Improve

    Embrace a culture of experimentation and continuous improvement by using observability data to identify areas for optimization and innovation. Encourage teams to test hypotheses, implement changes and measure the impact, fostering a cycle of learning and refinement. Track progress against the goals you set at the beginning and adjust your trajectory if needed.

    Coming back to our goal to improve website loading time. Now that your interdisciplinary team implemented some changes and reduced the loading times, you can assess the impact on user experience and business metrics, such as bounce rates, conversion rates and customer satisfaction.

    Becoming a smart-driven organization will grant you a great competitive advantage. You will make better and faster decisions, employ the best talent, maximize their productivity, and provide an enhanced experience for your customers.

  • Mezmo Simplifies Management of DevOps Telemetry Data

    Mezmo Simplifies Management of DevOps Telemetry Data

    Mezmo has added additional capabilities to streamline the flow of telemetry data within DevOps workflows as part of an effort to make it simpler to surface insights and reduce the total cost of observability.

    The company has also added integrations with more data sources to the Telemetry Pipeline platform, along with controls that make it simpler to optimize data storage and usage. For example, an Events-to-Metrics Processor capability identifies and extracts metrics from logs to make them easier for third-party tools to consume.

    Mezmo CEO Tucker Callaway said these additions collectively make it simpler to surface insights that will make DevOps workflows more efficient. Previously, the company added capabilities such as rollback and redeploy, sequential parsing, error history management and data sample management to enable DevOps teams to manage telemetry data more efficiently.

    In effect, Mezmo is making it easier to apply engineering best practices to the massive amounts of telemetry data generated across DevOps workflows, he noted.

    No one knows for certain if all that data will require the addition of data engineers to DevOps teams, but as DevOps continues to evolve, it’s clear there is a need to cost-effectively manage data at scale. DevOps teams that embrace observability are quickly discovering that storing logs, traces and metrics for an extended amount of time can quickly become cost prohibitive. Naturally, there’s a lot more sensitivity to those costs during challenging economic times.

    In theory, of course, various forms of artificial intelligence should automate data engineering best practices, but in the meantime, there simply isn’t enough data engineering expertise available. The need for a platform to optimize the flow of telemetry data across DevOps workflows is becoming more acute.

    It’s not clear how quickly DevOps teams are embracing observability, but it’s clear that relying on predefined metrics to monitor IT environments is no longer sufficient. DevOps teams need to be able to query telemetry data to, for example, identify bottlenecks created by dependencies between microservices. Resolving those issues can’t be slowed down by a lack of data to query. Most problems can usually be traced back to a recent update to an application, but there are always going to be some issues that require access to historical data. That historical data should be quickly and easily available, especially since application downtime directly equates to lost revenue for many organizations.

    Observability, regardless of cost, is rapidly becoming a requirement for DevOps teams’ success as application environments become more complex in the cloud-native era. Dependencies between the microservices that make up those applications are too difficult to track and analyze without the aid of an observability platform. The challenge is not every observability platform provider is equally concerned about how much it costs to store all that data. Striking the right balance between the amount of telemetry data collected and the cost of storing it has become a much larger concern.

  • Datadog Updates Aim to Improve Logging, Testing Efficiency

    Datadog Updates Aim to Improve Logging, Testing Efficiency

    At its recent DASH 2023 conference, Datadog revealed Flex Logs and Intelligent Test Runner, two major new capabilities aimed at improving logging and testing efficiency for engineering teams.

    Omri Sass, director of product management at Datadog, said Flex Logs introduces a new middle tier of log storage between real-time querying and cold archives. As Sass explained, this provides a cheaper option for retaining logs beyond the typical two weeks for occasional analytics and investigations. By decoupling storage from compute for reading logs, teams can independently scale each based on their needs. This enables retaining rich log data for months or years to uncover long-term trends, he said.

    In addition, Sass noted that Flex Logs helps address common log analysis limitations around storage costs and rehydrating archives. The feature better aligns log pricing with specific use cases beyond just troubleshooting. According to Sass, this evolution in log storage tiers will likely shift more logs from legacy on-premises systems to its cloud platform.

    The second capability, Intelligent Test Runner, leverages observability signals to optimize CI test suites. As Sass explained, comprehensive test automation in CI pipelines often increases deployment times and flakes. Intelligent Test Runner inspects code changes to determine associated tests, ignoring irrelevant ones, which helps avoid long wait times for minor changes just to exercise unaffected areas.

    By tapping into existing telemetry around code commits, test health and runtimes, the feature adapts testing to each code modification. Sass explained that observability data has matured enough to enable real-time optimization like this. The end result is faster CI validation, so engineering teams can ship updates more rapidly.

    Sass highlighted how Flex Logs and Intelligent Test Runner are Datadog’s attempts to address real pain points developers face around managing log data life cycles and CI speed bumps. Sass said he believes this combination of depth in core disciplines like logs and application performance monitoring (APM), along with expanding into adjacent developer workflows, is key to solving these issues through innovation.

    Looking to the future, the observability space continues to evolve rapidly as emerging technologies and practices expand monitoring beyond traditional IT infrastructure. Companies handling modern workloads expect their observability platform to provide comprehensive visibility as development toolchains and architectures grow more complex, with the next generation of observability likely incorporating advanced analytics, automation and AI to help engineers tame systems at ever-increasing scale and speed. 

  • Datadog Adds Additional Generative AI Capabilities to Platform

    Datadog Adds Additional Generative AI Capabilities to Platform

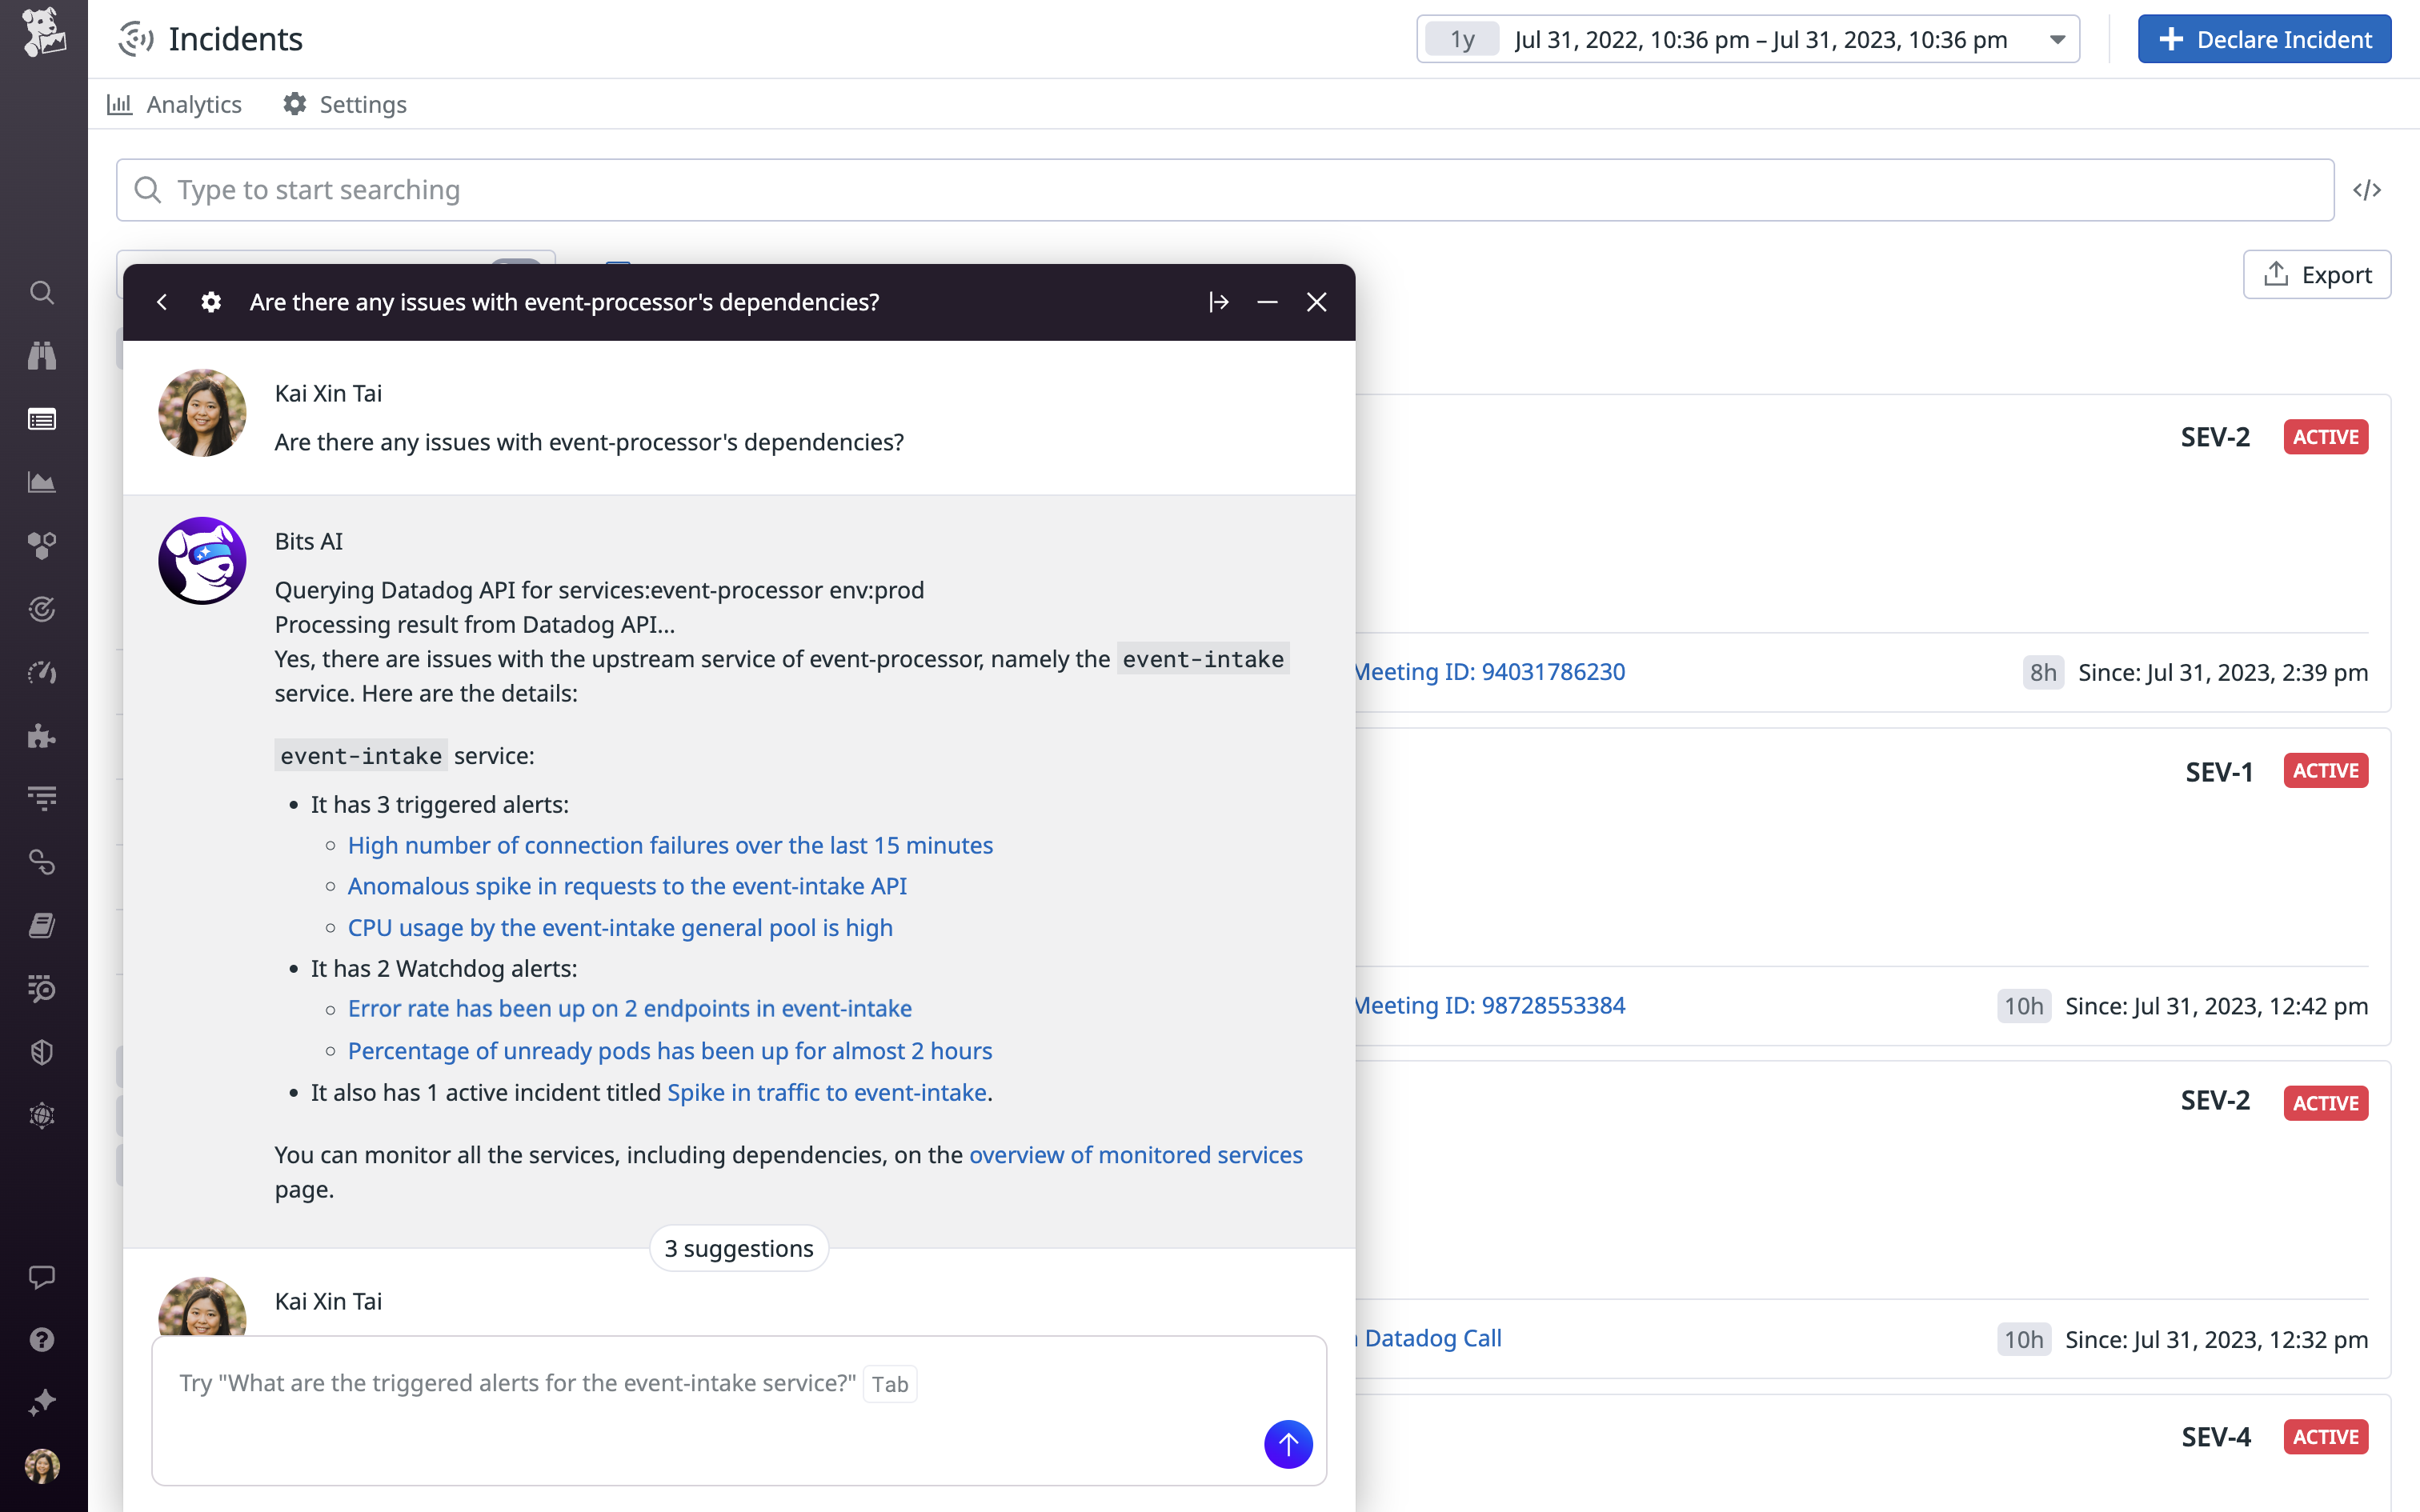
    At its DASH 2023 conference, Datadog today launched Bits, a digital assistant that uses generative artificial intelligence (AI) from OpenAI’s ChatGPT platform to provide real-time recommendations to resolve issues surfaced by the company’s observability platform.

    At the same time, the company announced it is extending the reach of that platform to enable IT organizations to monitor the large language models (LLMs) many are now embedding within custom applications.

    Datadog also released an LLM Observability platform in beta, which brings together data from applications, models and various integrations to help engineers discover and resolve AI issues in applications such as performance degradations, drift and hallucinations in real-time.

    Those extensions complement an existing ability to monitor the usage patterns of application programming interfaces (APIs) making calls to the OpenAI ChatGPT platform.

    Yrieix Garnier, vice president of product at Datadog, said the generative AI capabilities in beta are enabled by data the company used to extend the core capabilities of OpenAI’s ChatGPT platform.

    Bits AI learns from both customer data and other sources to answer queries via a natural language interface that makes the Datadog platform more accessible to a much wider range of IT professionals, noted Garnier.

    The overall goal is to reduce the mean-time-to-resolution for issues by, for example, explaining errors and suggesting code fixes that can be easily shared with developers via a Slack communication channel.

    Those capabilities extend the functionality of the machine learning algorithms that Datadog has already embedded within its platform, noted Garnier.

    While the generative AI capabilities added to the core Datadog platform will make DevOps teams more efficient, it’s not quite clear what role those teams will play in monitoring LLMs created by data science teams. In theory, DevOps teams should be responsible for optimizing the performance of any element of an application, but most DevOps engineers today don’t tend to have much experience with LLMs that are created by data science teams.

    At the very least, however, DevOps engineers should be able to share the root cause of an issue that is adversely affecting those LLMs with those data science teams.

    It’s not clear how quickly LLMs will be incorporated into applications, but most DevOps teams should expect them to soon be pervasive. In effect, Datadog is now providing DevOps teams with the AI tools they will need to effectively monitor applications infused with AI capabilities. The issue is not so much whether DevOps teams will be taking advantage of AI to better manage application environments but how quickly. Given the overall level of complexity DevOps teams regularly encounter, few are likely to want to take on that challenge without some level of AI augmentation.

    The challenge is determining exactly what DevOps tasks might be best handled by a machine that enables software engineers to focus on more complex issues they previously didn’t have the time to address.

  • Using Generative AI for Issue Remediation and Software Reliability

    Using Generative AI for Issue Remediation and Software Reliability

    In today’s fast-paced digital landscape, keeping your services up and performant, especially for cloud-based and online services, is crucial for staying competitive. Downtime or latency issues can drive customers away, especially when all it takes is a click to switch over to a competing SaaS solution. DevOps and site reliability engineering (SRE) teams face the constant challenge of minimizing mean-time-to-remediation (MTTR) when dealing with errors and issues. As valuable as search engines like Google are, the sheer amount of information available can make finding the right solutions a time-consuming task. What if there was a way to automate and streamline this process, making error investigation more intelligent, focused and efficient?

    This article will walk you through the journey of error resolution from the first obscure log line to identifying the problem hidden within it. We’ll resolve the issue using several tactics, ultimately leading to the use of generative AI to cut MTTR and provide precise IT recommendations. This journey includes useful measures and principles that can be applied by DevOps teams and explores the potential for applying generative AI.

    The Current Experience of DevOps/SRE

    Picture this: A log line pops up with an obscure error message, and the first instinct is to search for this message on Google for potential solutions. After all, someone else must have encountered a similar problem, right? However, the abundance of resources and search results can be overwhelming. The search results are often displayed based on website relevance, not necessarily the relevance of the error itself. Consequently, precious time is wasted sifting through countless search results, leading to a longer time to understand and remediate the error. For DevOps and SRE teams responsible for maintaining system stability, reducing MTTR is a crucial key performance indicator (KPI). This begs the question: How can we leverage automation and artificial intelligence to improve the search process and accelerate error resolution?

    Our First Step: Cognitive Insights

    In our organization’s initial attempt to tackle this challenge, we focused on leveraging crowdsourcing techniques to get more relevant results than the brute-force Google search. Moreover, we wanted to automate the process and run it offline so that when an incident occurs, we can offer useful insights rather than starting the search as the system is down or malfunctioning.

    The approach involves an offline phase and an online phase. The offline phase involved analyzing all our ingested logs and identifying common log patterns. This also allowed us to count how often this pattern occurred in our system and how prevalent it is. Then we crawled relevant technology forums like StackOverflow, Google Groups and Bing Groups for relevant discourse around these log patterns that could offer relevant solutions. The next step was to rank the search results by relevance and take the top five most relevant links.

    The offline phase resulted in a library of known log patterns and, for each one, a cognitive insight containing these links, as well as additional information such as the severity level, how many times this pattern occurred in the logs, the date of first occurrence and additional tags of involved technologies, tools and domains.

    The online phase occurs in real-time as new logs come in. Upon ingesting the log, it is automatically matched against all known patterns; if it matches one, it gets the cognitive insight for that pattern. This means that as soon as the problematic log comes in, the DevOps engineer already has focused and ranked search results and context to start from, which accelerates the investigation process.

    The Next Step: Why Don’t we ask Generative AI?

    After reflecting on our initial approach, we had an epiphany. Large language models (LLMs) like ChatGPT had already crawled the web and absorbed a vast amount of information. So, why not leverage their capabilities and ask them directly for insights? The idea was simple: Let the AI “read the posts” for us and provide us with recommendations. We started by formulating specific questions such as “What could the possible errors be?” and even went a step further by asking for further investigation steps. However, implementing this seemingly straightforward approach came with its own set of challenges. We needed to run preprocessing before asking the generative AI, as well as running post-processing on the answers it returned, to get what we expected. Let’s see what that process entails.

    How we Did It: Analyzing, Sanitizing and Validating

    Before asking ChatGPT (or any other generative AI tool) for assistance, several preparatory steps were necessary. First, we had to analyze incoming logs, identify patterns and score them based on severity. This allowed us to prioritize the most critical issues.

    Secondly, we had to carefully design our prompts for the generative AI using prompt engineering, ensuring that we framed our questions in a way that yielded precise and relevant responses. Prompt engineering is the practice of strategically designing effective prompts or instructions for language models to achieve more accurate responses. It involves carefully specifying the input format, context or constraints to guide the model’s generation process and obtain more accurate and desired results. This is true for any use of generative AI, and for our case in particular. Beyond accuracy, prompt engineering helped us tune the requested format and length of the answer to fit the “executive summary” paragraph we popped up for the user. This ensured it wasn’t too lengthy nor too short to provide meaningful insights.

    Additionally, we took great care in sanitizing the queries and removing any sensitive data to maintain privacy and security. This step was especially crucial for those working with public services, highlighting the importance of protecting users’ personally identifiable information (PII), such as names, emails, phone numbers, IP addresses or GPS coordinates.

    With all this preprocessing done, we sent the prompt to the generative AI. It is important to note that public services may not always be available (as some returned a “service is busy” message when working with ChatGPT and other services), so automation should take care of delays and employ retries as needed.

    Finally, as responses were received from the AI, it was essential to validate those. We ran an analysis and filtered out non-relevant answers from different domains (after all, a log is also a product of a tree, and Kafka is also a novelist), ensuring there was no offensive content or misleading information. The semantic integrity of the responses was also carefully evaluated.

    These AI insights have proven to be a powerful troubleshooting tool, and we’ve made it an integral part of our service.

    This journey is not unique. In fact, DevOps teams can employ similar measures for their own telemetry data to serve their own operational workflows. These principles, such as data sanitization and validation, even apply to other types of data and use cases.

  • Postman Acquires Akita Software to Gain API Observability

    Postman Acquires Akita Software to Gain API Observability

    Postman today announced it has acquired Akita Software to gain access to a platform for monitoring and observing application programming interfaces (APIs).

    The first integration of the respective products offered by both companies will arrive in beta this fall.

    Postman CEO Abhinav Asthana said the acquisition of Akita Software will make it much simpler for organizations to discover what APIs are being employed across an enterprise. A recent Postman survey found that 28% of developers are now deploying APIs at least once per week.

    The Akita Software platform will make it simpler for organizations to discover both rogue APIs that have been created by a shadow IT project and zombie APIs that have been inadvertently left exposed long after they are needed.

    Akita Software’s CEO Jean Yang said the integration with Postman’s API management platform will provide a rich source of data that can be used to add artificial intelligence (AI) capabilities to Akita’s API observability platform. For example, generative AI capabilities should make it simpler to create summaries in natural language that explain the calls an API is making to specific data sources.

    In addition, the combined company will be in a better position to enable organizations to better secure their APIs after deployment by surfacing anomalous behavior indicative of an API that is being used to exfiltrate data, she added.

    The merger with Postman will, in effect, enable the combined entity to provide a complete ecosystem for managing APIs, noted Yang.

    Most APIs are used primarily to interconnect internal-facing applications and systems, with a subset used to integrate partners. Only a relatively small percentage of APIs are externally facing in the sense that they expose data to the internet. Many organizations, however, fail to appreciate how quickly an internally facing API can become externally facing over the course of its life cycle. As such, IT teams need tools and platforms that can manage and secure APIs as they evolve.

    As APIs continue to play a crucial role in advancing business goals, there is a clear need for increased visibility as the types of APIs employed also continue to expand. Most APIs in use today are based on the REST format, but there are also APIs based on GraphQL, event-driven architecture and various messaging platforms. None of these newer APIs will supplant REST APIs any time soon. Rather, they are being applied to drive additional processes alongside REST APIs.

    In the longer term, it’s not clear how many APIs will be managed by the developers that created them versus a centralized DevOps team. However, the more APIs that are deployed in a production environment, the less feasible it becomes for developers to manage their life cycle. The challenge is making sure there is some type of structured workflow in place that, at the very least, makes everyone involved in the process aware that a new API has been created and deployed.

  • Splunk Adds Generative AI Tool and OpenTelemetry Collector

    Splunk Adds Generative AI Tool and OpenTelemetry Collector

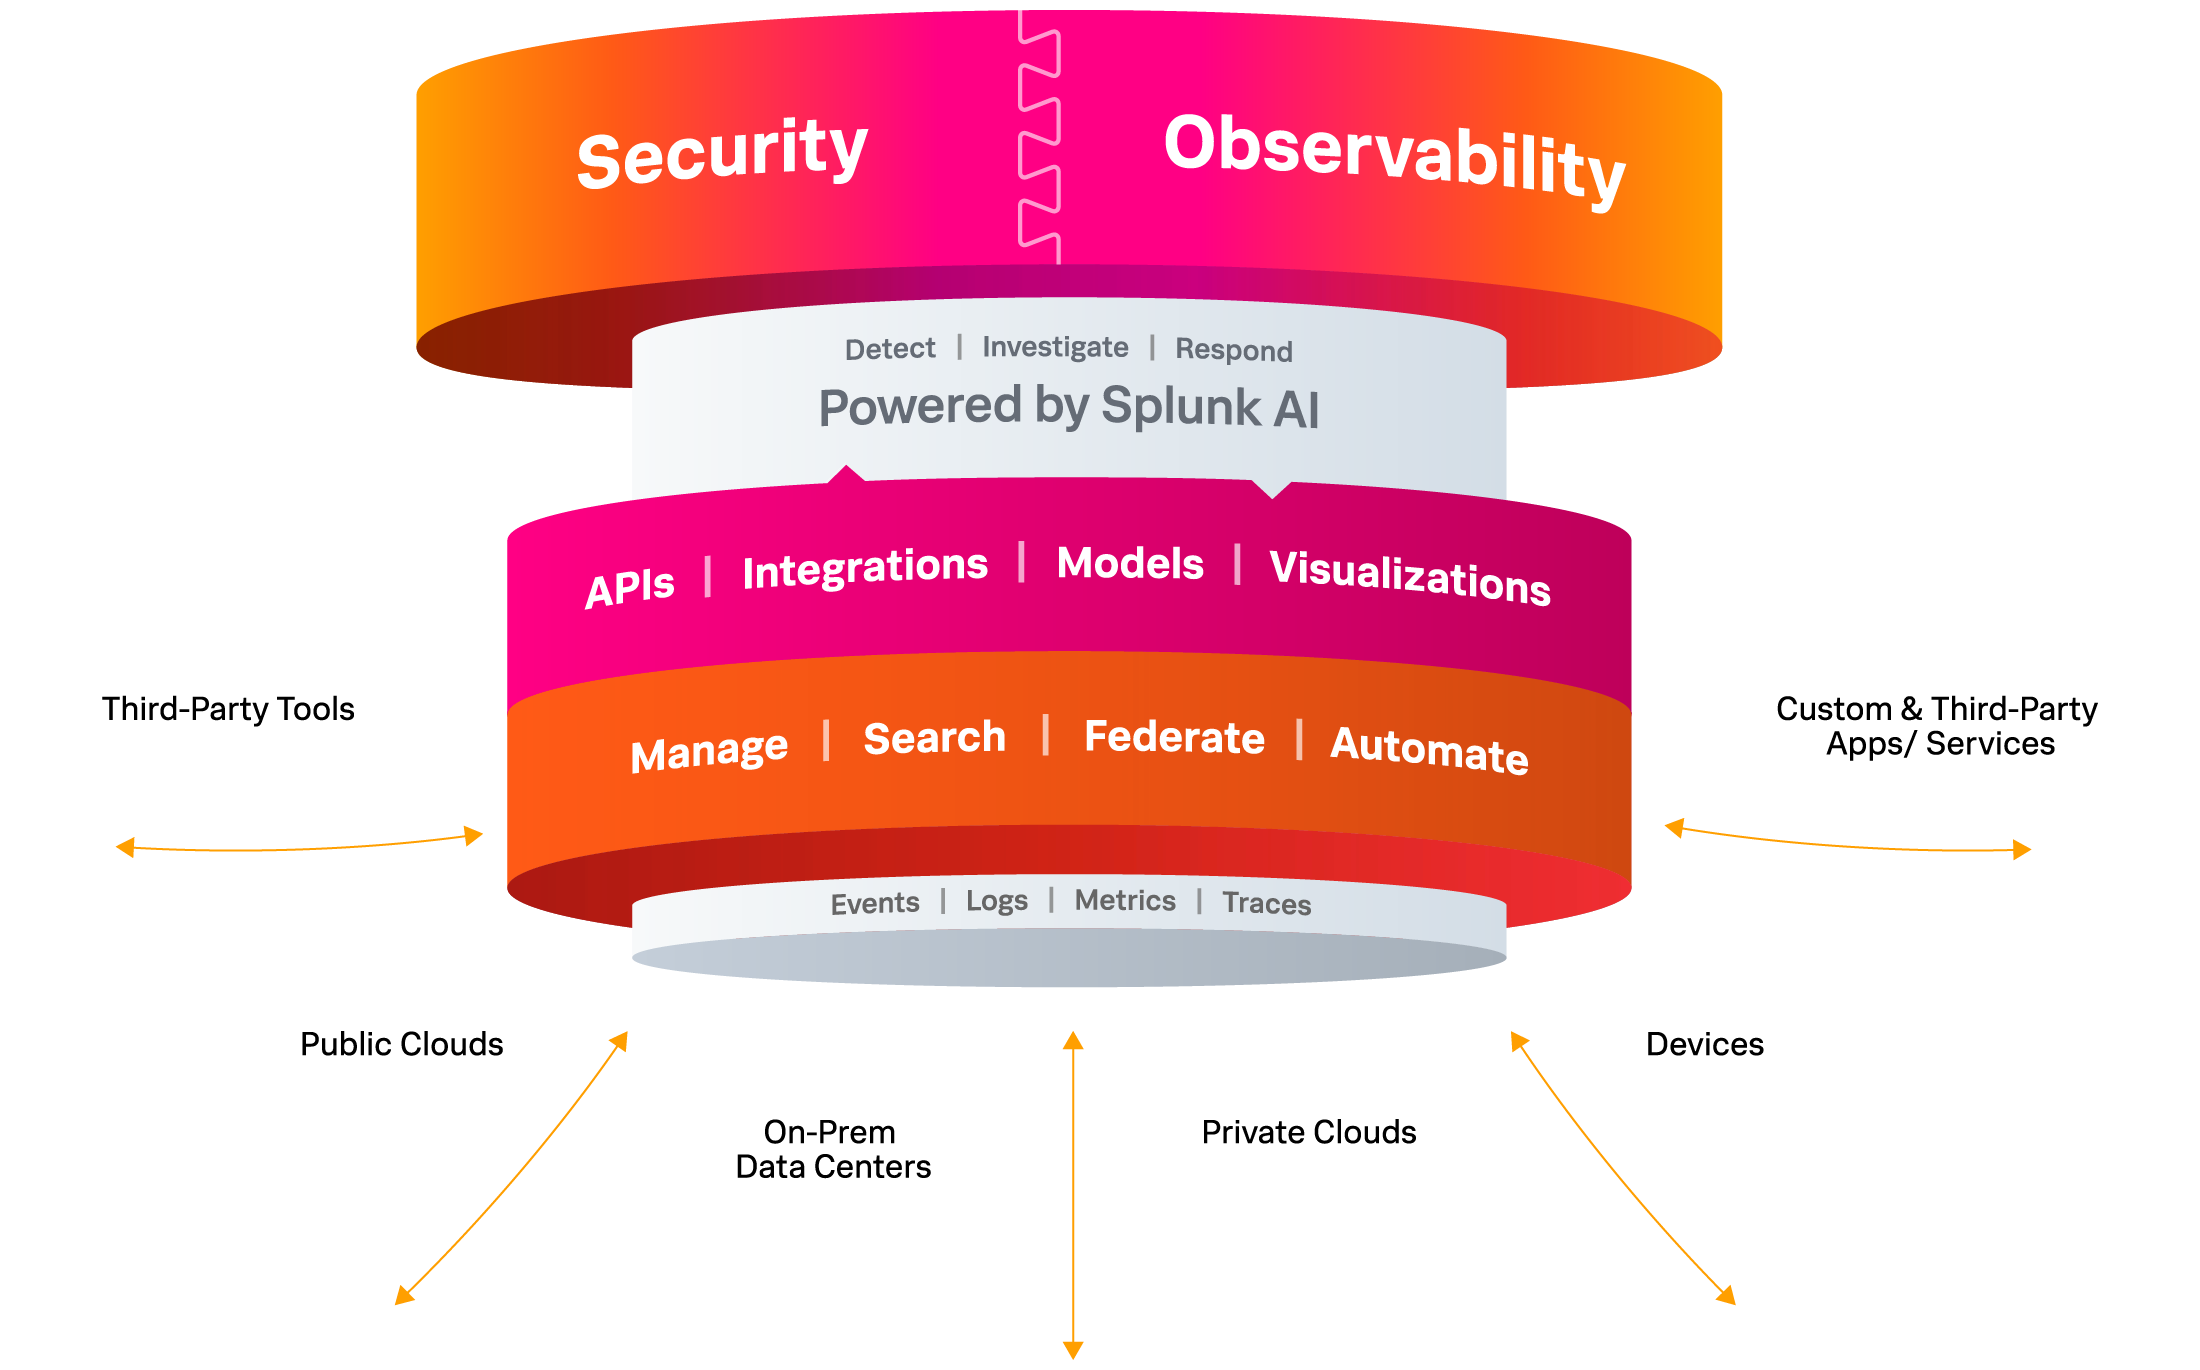
    At its .conf23 conference, Splunk today revealed it added a slew of capabilities to its portfolio of operational analytics tools, including an assistant that leverages generative artificial intelligence (AI) capabilities that use large language models (LLMs) the company developed to enable IT teams to use natural language to invoke the Splunk Processing Language (SPL).

    In addition, Splunk is also previewing OpenTelemetry Collector, an add-on that uses open source agent software being developed by the Cloud Native Computing Foundation (CNCF) to capture metrics and traces. It is designed to enable IT teams to use OpenTelemetry alongside existing agent software that Splunk uses to capture metrics.

    Tom Casey, senior vice president for products and technology at Splunk, said the domain-specific LLMs that the company created enable Splunk Assistant to write or explain customized SPL queries in a way that augments rather than replaces the need for IT professionals. Splunk Assistant is designed to surface recommendations to optimize IT environments to reduce toil rather than automate entire processes, he noted.

    Splunk is adding other tools infused with machine learning algorithms to its portfolio. These include the Splunk App for Anomaly Detection and an Outlier Exclusion for Adaptive Thresholding to detect and omit abnormal data points that has been added to version 4.17 of the Splunk IT Service Intelligence platform.

    In addition, Splunk is previewing an ML-Assisted Thresholding tool for Splunk IT Service that uses historical data and patterns to create dynamic thresholds with a single click.

    The company is making available a 5.4 update to the Splunk Machine Learning Toolkit (MLTK) 5.4 and a Splunk App for Data Science and Deep Learning (DSDL) 5.1 toolkit that provides access to additional data science tools that can extend MLTK to enable organizations to build their own custom LLMs and AI assistants.

    Finally, Splunk added Unified Identity to make it simpler to access Splunk Cloud Platform and Splunk Observability Cloud along with an update to Splunk Cloud Platform and Splunk Enterprise that make it simpler to ingest, route, search and export data.

    It’s still early days as far as the application of generative AI is concerned, but it’s already clear that the way IT is managed is about to be transformed. Coupled with tools such as OpenTelemetry that make it less expensive to collect massive amounts of data, the opportunity to train LLMs that streamline a wide range of processes is immense. Those capabilities won’t replace the need for humans to manage those processes, but they will most certainly cause staff realignments as many manual tasks become increasingly automated.

    In fact, it’s hard to imagine an IT team that would not want to take advantage of AI capabilities to simplify the management of complex IT environments that now function at a level of scale that few IT professionals can successfully manage on their own. One way or another, AI is going to be broadly applied to IT workflows. The only thing left to be seen now is the ultimate impact.