Tag: observability

  • Why Observability is Important for Development Teams

    Why Observability is Important for Development Teams

    Observability, which allows development teams to understand better how their systems behave in production, is critical to successful software delivery. According to Gartner, by 2026, 70% of organizations that successfully applied this practice will achieve shorter latency for decision-making, enabling competitive advantage for target business or IT processes.

    Observability allows development teams to identify and diagnose issues quickly to make decisions that improve overall software delivery performance. Let’s take a closer look at why this practice is critical for development teams.

    Differentiating Observability and Visibility

    To better understand observability, it’s essential to clear up a common misconception – that observability and visibility are the same. Two critical differences exist between the two. Visibility allows development teams to look at the surface-level aspects of an application or system. In contrast, observability provides deeper insight into what an application is doing in production. Being equipped with a deep knowledge of observability allows developers to be more productive within their respective organizations.

    Impact on Developer Productivity

    With observability, developers can identify and diagnose issues within applications quickly, giving them more time to fix bugs and time for resolution, which are both critical success factors for software delivery. Observability allows organizations to quickly identify and respond to potential problems, such as operational issues or security breaches, before they become issues that impact customers or users. While there is no such thing as perfect software, observability helps developers quickly find and fix issues, bottlenecks, inefficiencies, etc., so they can get back to doing what they love: Creating new software.

    With the benefits of observability, developers naturally gravitate toward tooling and technology. There are many tools available for developers to take advantage of, and development teams must learn how to use these tools to integrate them into their applications and services. Let’s explore some of the more popular options.

    The Shift to Cloud-Native Tools

    The shift to cloud-native tools is driven by the increasing popularity of cloud computing and its benefits, such as scalability, cost-effectiveness and flexibility. The move to cloud-native has made an enormous impact on observability efforts. Having good tooling and processes available positively impacts observability efforts because it’s a critical aspect of the developer communities’ systems. Overall, the shift to cloud-native tools is driven by the need for organizations to take advantage of the benefits of cloud computing and the need for more efficient and flexible deployment and scaling of applications.

    Some of the most common tools in observability include:

    These tools offer developers greater insight and knowledge into how applications behave. The cloud-native approach necessitates a new way to aggregate all of these operations.

    Conclusion

    With observability, developers can understand how their systems work in production. These systems act in different ways depending on the environments they run in. Therefore, organizations must do more to provide developers with sufficient observability because of the limited visibility into the overall system performance.

    Observability allows developers to act quickly and remedy issues before they go into production and organizations can better measure success relative to the application’s performance. Hours of developers’ time are spent manually debugging and troubleshooting when organizations could have a system in place to do this automatically and allow developers to get back to what they love doing most: Creating software. Observability helps organizations make better-informed decisions, improve operations and performance and achieve their objectives more effectively.

  • Grafana Labs Acquires Pyroscope to Add Code Profiling Capability

    Grafana Labs Acquires Pyroscope to Add Code Profiling Capability

    Grafana Labs this week announced it acquired Pyroscope and plans to merge Pyroscope’s open source continuous profiling project with the open source continuous profiling database that Grafana Labs launched last year.

    Richard Hartmann, director of community at Grafana Labs, said after logs, metrics and traces, continuous profiling is now the fourth pillar of observability that enables DevOps teams to identify how much infrastructure resources any given piece of code is consuming. That capability is critical for everything from controlling costs to improving performance to limiting the amount of carbon generated by an application both before and after an application is deployed, he added.

    The resulting Grafana Pyroscope project will be natively integrated with Grafana Labs’ open source dashboard project to make it simpler to visualize profiling data and correlate it with metrics, logs, and traces. Grafana Labs is also committing to adding profiling capabilities to the fully managed Grafana Cloud observability platform.

    Pyroscope currently makes a plug-in for Grafana available in addition to a cloud instance of Pyroscope. Integrating Pyroscope with the Grafana Labs portfolio will make it simpler for DevOps teams to visualize issues before there is a major disruption to an application environment, said Hartmann.

    It’s still early days as far as the adoption of observability platforms is concerned, but it’s apparent that as application environments become more complex, the plethora of monitoring tools that DevOps teams rely on will need to be streamlined. Observability platforms promise to unify logs, metrics and traces in a way that makes it simpler to launch queries to identify the root cause of an issue. The rate at which DevOps teams will embrace observability will naturally vary, but the biggest obstacle might not be the platforms themselves. Instead, the issue is understanding what queries can help DevOps teams better understand the root cause of an IT issue. Visualization tools, in combination with code profiling tools such as Pyroscope, should make it simpler to surface those issues.

    Grafana Labs is also enabling organizations to better address sustainability concerns that have emerged as more policies are enacted to encourage organizations to reduce the overall size of their carbon footprints. The European Union, especially, has been enacting policies that provide organizations with a range of incentives to encourage greater efficiency from IT environments. It won’t be long before more DevOps tools and platforms provide greater visibility and control over the amount of infrastructure application code is consuming to achieve sustainability goals.

    In the meantime, overall observability should continue to improve as organizations move beyond continuous monitoring to gain insights into how application environments are behaving. As IT environments become more complex, tools that monitor a set of pre-defined metrics are no longer enough to ensure application resiliency. The challenge—and the opportunity—is to determine how to take observability to the next level before the next inexplicable application performance degradation.

  • JFrog Aligns With New Relic to Improve Observability

    JFrog Aligns With New Relic to Improve Observability

    JFrog and New Relic jointly announced today they will provide a free integration tool that will enable New Relic’s observability platform to consume log data from JFrog platforms for building and deploying applications securely.

    Announced at the Futurestack conference hosted by New Relic, this integration eliminates the manual effort that was previously required to integrate these platforms. Preconfigured New Relic dashboards provide a comprehensive view of performance data, artifact usage and security metrics in real-time that is automatically collected from JFrog Artifactory and JFrog Xray environments and then displayed alongside other telemetry data.

    Omer Cohen, executive vice president of strategy at JFrog, said that capability will make it easier to identify performance issues, urgent vulnerabilities and malicious users in a way that reduces the amount of time required to remediate those issues across the software supply chain.

    The goal now is to eventually provide similar levels of integration between JFrog platforms that enable DevOps teams to manage and secure application binaries with other observability platforms, added Cohen.

    It’s still early days as far as the adoption of observability platforms is concerned, but it’s apparent that as application environments become more complex the plethora of monitoring tools that DevOps teams rely on need to be augmented. Observability platforms promise to unify logs, metrics and traces in a way that makes it simpler to launch queries to identify the root cause of an issue. The rate at which DevOps teams will embrace observability will naturally vary, but the biggest obstacle might not be the platforms themselves. The biggest challenge is understanding which queries to actually launch to identify an issue that might later cause a major disruption. In the longer term, it’s expected that machine learning algorithms will leverage the data collected by observability platforms to automatically identify those issues. In the meantime, much still depends on the acumen of the DevOps team employing an observability platform.

    In fact, a recent New Relic survey found only 27% of respondents have achieved full-stack observability, with only 5% claiming they have a mature observability practice in place. A third (33%) of respondents also said they still primarily detect outages manually or based on complaints, the survey found. More than half (52%) of respondents also admitted they experienced high-business-impact outages once per week or more and 29% said they take more than an hour to resolve those outages.

    On the plus side, nearly three-quarters (72%) expected to maintain or increase their observability budgets next year. More than half (52%) of respondents, including 57% of C-suite executives, expected observability budgets to increase over the next year. A total of 14% of all respondents and 16% of IT decision-makers expected to increase observability budgets significantly or extensively. More than a third (36%) believe observability increases their productivity and enables them to find and resolve issues faster. Just under a third (32%) said observability enables cross-team collaboration, while more than a quarter said observability improves their ability to innovate.

    One way or another, visibility into DevOps environments clearly needs to improve as application environments become more complex. The challenge, as always, is determining the cost required to achieve it.

  • New Relic Adds Module to Surface Code Metrics

    New Relic Adds Module to Surface Code Metrics

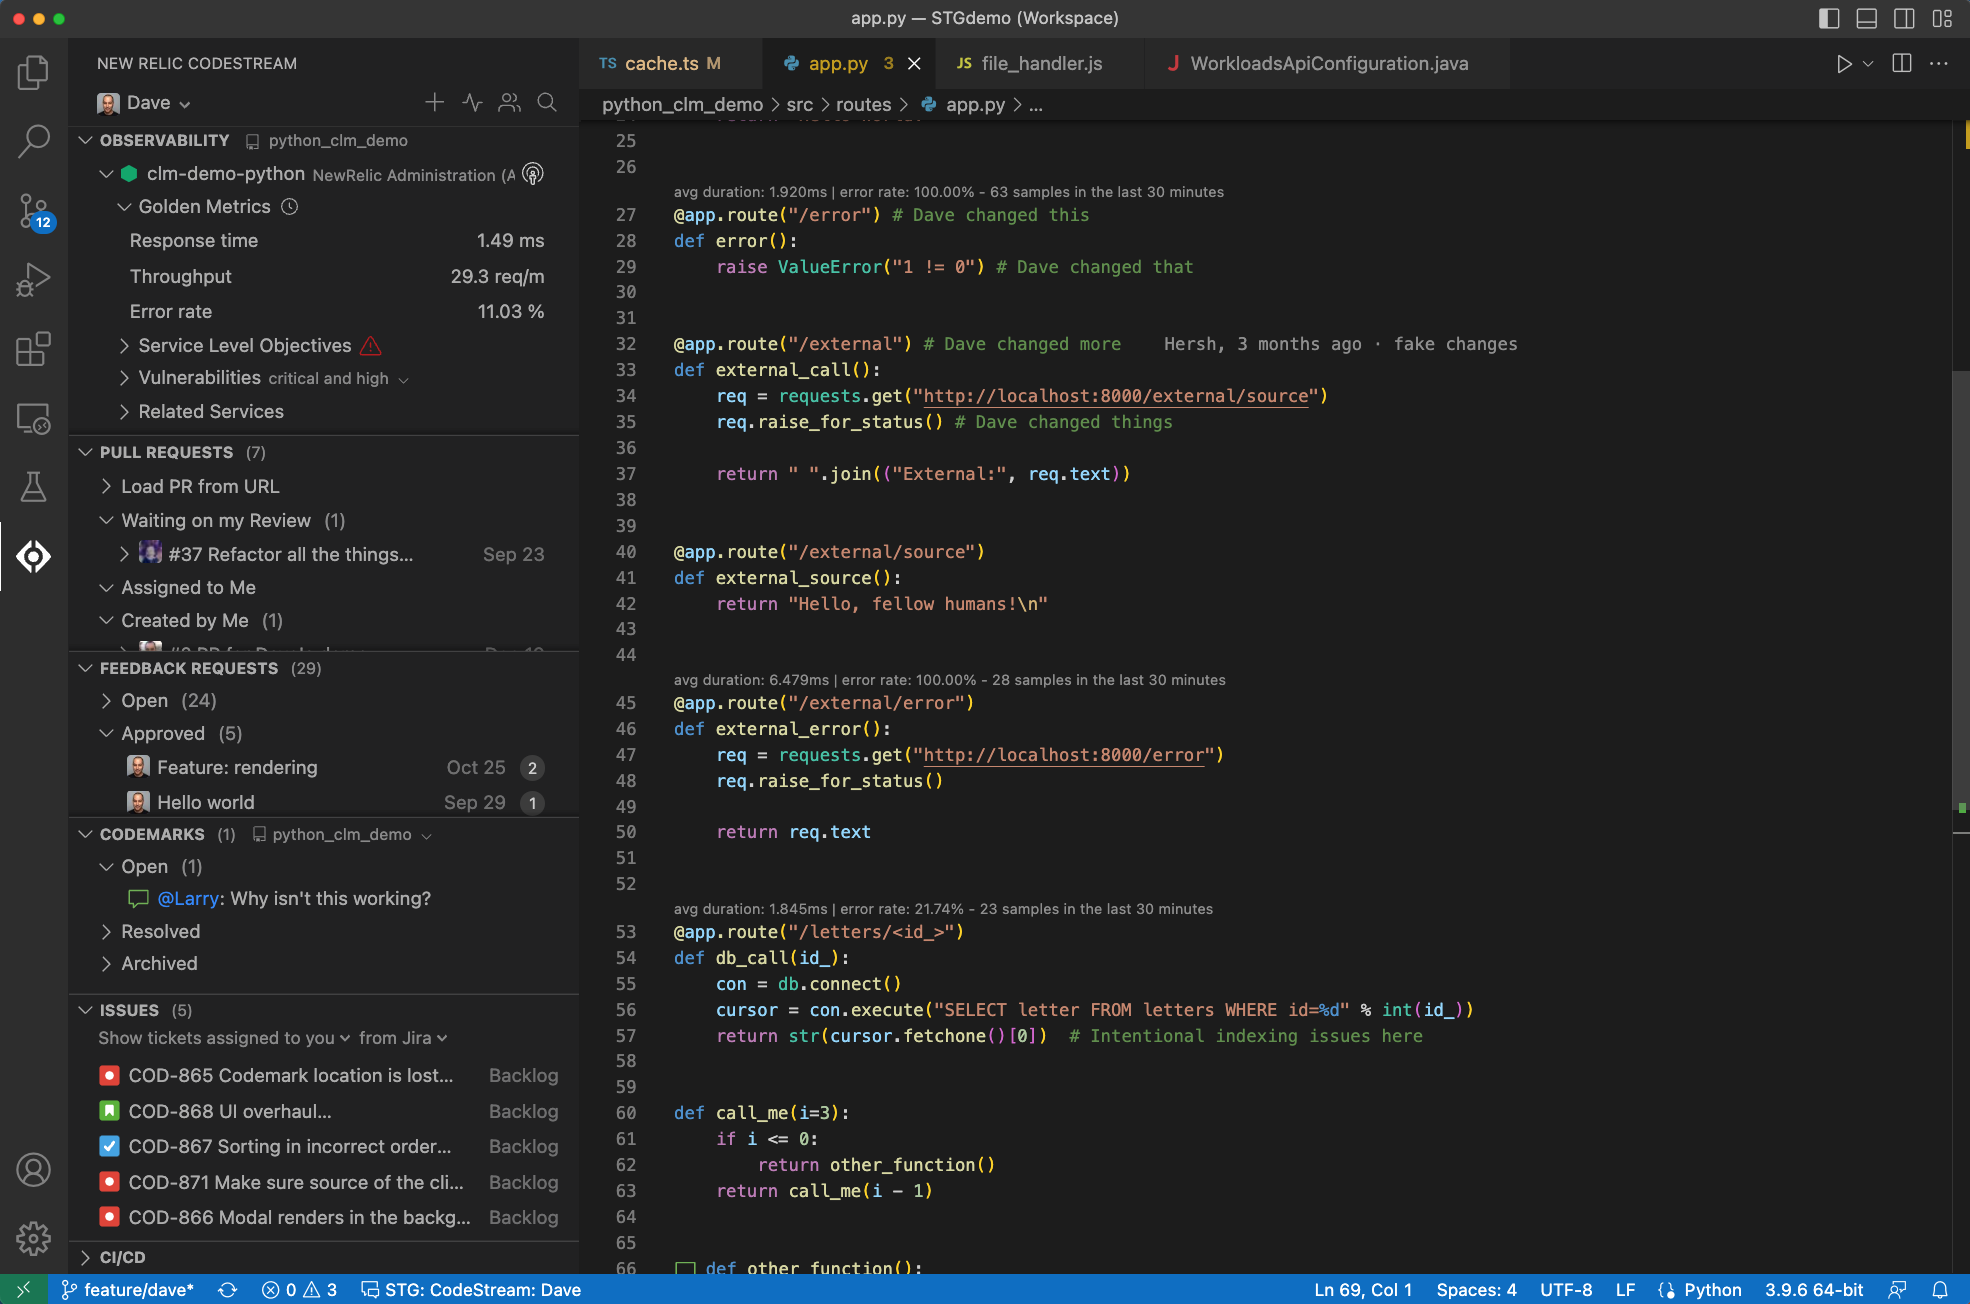
    New Relic today added a free CodeStream module to its observability platform to give developers access to metrics and telemetry data that will enable them to write higher-quality code faster.

    Peter Pezaris, group vice president and general manager of strategy and experience for New Relic, said this capability is part of an effort to shift observability left toward developers to optimize code as it is written and after it is deployed.

    CodeStream surfaces metrics and telemetry data within the integrated development environment (IDE) developers use to write software. Telemetry metrics are displayed as a line of text above the code or in the debugging tool used to troubleshoot an application. Alternatively, developers can view metrics via an observability panel at the service level. They can also view performance metrics such as error rates and response times for related services.

    That approach eliminates the need to wait for IT operations teams to surface issues that usually don’t manifest until long after the code in question was originally developed, noted Pezaris.

    The overall goal is to provide development teams with frictionless access to observability data at every stage of the software development life cycle, he added. That analysis capability will result in faster mean-time-to-detection (MTTD), mean-time-to-resolution (MTTR) and, ultimately, shorter development cycles, said Pezaris.

    Organizations should also be able to reduce technical debt faster by making it easier to identify issues that, for example, adversely impact application performance, he noted. That activity can be especially challenging because developers often inherit code written by someone else that often lacks clear documentation. CodeStream makes it simpler to onboard a developer to any application modernization initiative that has been launched to reduce technical debt, said Pezaris.

    A recent New Relic survey found only 27% of respondents have achieved full-stack observability, and only 5% claimed they have a mature observability practice in place. A third (33%) of respondents also said they still primarily detect outages manually or based on complaints, the survey found.

    On the plus side, the survey also found nearly three-quarters of respondents said C-suite executives in their organization are advocates of observability, and more than three-quarters of respondents (78%) saw observability as a key enabler for achieving core business goals. However, more than half (52%) of respondents said they experienced high-business-impact outages once per week or more, and 29% said they take more than an hour to resolve those outages.

    A full 82% of respondents said they use four or more tools to monitor the health of their systems. Only 7% said their telemetry data is entirely unified and only 13% said the visualization or dashboarding of that data is entirely unified. Nearly half of the respondents (47%) said they would prefer to have a single, consolidated observability platform, but only 2% said they currently used one tool for observability.

    Regardless of the approach to observability, it is clear that development and IT operations teams need to be looking at the same metrics and telemetry data at the same time to collaborate effectively.

  • Why You Need to Break the Observability Data Silo

    Why You Need to Break the Observability Data Silo

    In my role as a developer advocate for Coralogix, I speak with organizations across almost every conceivable industry, and there is a pattern across almost all of them. In the world of observability, the challenge is battling scale. At scale, observability becomes a complex problem to solve. Surprisingly, the most common pattern for handling observability data is also holding people back from unlocking the true power of their data.

    What is the Data Silo in the World of Observability?

    To understand the data silo, we first need to understand the typical architecture of an observability solution, whether it’s homegrown or SaaS. Observability data can be divided into three types: Logs, metrics and traces. These three types come together to give engineers a complete picture of the health and performance of their system.

    These three data types are typically held in different storage mechanisms. A popular solution for logs is open search, while Prometheus holds the mindshare for metrics, and Jaeger is a very popular tracing solution. This means three solutions, three interfaces and, subsequently, three problem-solving workflows.

    What’s wrong with separating data like this? Even though there are three types of data, there is still only one goal: To understand the health and performance of the system. This is the only use case. The data silo is the dominant trend for observability solutions to provide a fragmented view of the data. It requires engineers to piece together stories as they go, rather than correlating across all of this data at once, to provide a complete picture of system performance.

    This slows down troubleshooting. If there is an issue, an engineer will first review one of the data types. Then, they will run different queries against other data types to confirm. So they may detect a 500 error in the logs, then move to the traces to see the impact on traffic, and finally, review the application metrics. This means three minimum queries when attempting to assess only one problem.

    Breaking the Data Silo

    Breaking the data silo can be a daunting challenge. There are some key points to focus on when a company starts out and some finishing touches that make for an excellent developer experience.

    Unify data storage as much as possible. For example, traces can be stored in Prometheus rather than in a separate solution. This will enable engineers to query, for example, trace latencies alongside CPU metrics. It will also minimize the UI work necessary to join together data. If an organization has the expertise, it’s possible to store everything inside an OpenSearch cluster. This means a single interface, with a single query language, to query all available observability data. Anyone assessing this option should simply decide what their company can maintain and what skills they have in-house.

    Present observability data as one. If storage unification isn’t an option, then focus on the presentation layer. Tools like Grafana can consume most observability solutions as external data sources and render them all on the same dashboard. While an engineer will still have to query them using the specific language of the tool, it means that they can render things alongside one another, making for an insightful dashboard.

    Correlate data in one user interface. This means metrics are rendered in a single dashboard alongside logging and tracing data. This will give users a static view of the data at once, even if there is a limit to how queryable the data is.

    Create universal values. If it’s impossible to make any of the previous recommendations, then this is an easy, quick win that will at least make querying observability data more consistent. An easy way to do this without making your code messy is to use a library like MDC (or your tech stack’s equivalent). Add some tags or values that will exist in all logs, metrics, and traces. For example, the name of the application and the feature it belongs to, i.e. application is credit-card-service and feature is payments. This means that if something goes wrong, there is already a set of key-value pairs that translate across every data type.

    At the very least, this will mean an engineer can issue consistent queries across the three solutions, albeit in different syntaxes. This represents the least value, but also the least rework and effort, and will lower the cognitive load of engineers who are already trying to debug a potentially serious outage.

    The Data Silo Can be Beaten

    A siloed observability strategy drives waste and inefficiency in engineering teams, precisely when they need efficiency the most. By breaking the data silo, observability data can be queried, analyzed, and correlated together to form a single, cohesive and complete picture of your system health.

  • Vercel Adds Observability Tools to Web Application Framework

    Vercel Adds Observability Tools to Web Application Framework

    Vercel today announced it has added a suite of observability tools to its platform for building web applications using Next.js, an instance of the open source React framework based on a JavaScript library.

    Vercel CTO Malte Ubl said the Vercel Monitoring tools make it simpler for developers to troubleshoot applications without relying on a DevOps team to surface data. Instead, developers can take advantage of Vercel Monitoring tools to access metrics that track user interface and application programming interface (API) issues, he added.

    That capability is not intended to replace the need for observability tools employed by DevOps teams. Instead, the goal is to provide metrics that are specific to issues that developers encounter as an application is being built or after it has been deployed so they can be addressed.

    Developers can select from pre-made queries provided by Vercel or create their own by defining what metrics they want the Vercel Monitoring tools to track, including bandwidth and web traffic spikes and requests by bots that are indicative of a cyberattack. In total, there are more than 500 potential errors that developers can track. Logs then make it possible to drill down into errors and issues once they are identified to pinpoint the root cause of an issue.

    As more responsibility for applications shifts left toward developers, there’s a clear need for tools that provide more visibility into the applications they develop. Many of the issues that DevOps teams encounter today could have been resolved if developers had been aware of them earlier.

    The Vercel platform employs caching, routing and a React framework to optimize application performance in a way that reduces the dependency on backend infrastructure to optimize application performance. That approach puts less strain on backend infrastructure as more requests are automatically processed using a framework that spans clients and servers. In effect, developers can take advantage of frameworks such as React to treat the underlying IT infrastructure as if it were serverless whenever possible with tools that have a familiar JavaScript construct. The overall goal is to increase developer productivity at a time when many organizations are much more focused on the issue.

    As a result, DevOps teams will need to make some adjustments as more applications capable of providing richer experiences are built and deployed without relying as much on backend infrastructure. That shift has implications for everything from the amount of network bandwidth consumed to the performance of web applications. Frameworks such as Next.js also tend to increase the overall rate at which web applications can be built and deployed.

    One way or another, it’s clear that the way web applications are being built is fundamentally changing. The only issue now is determining to whether DevOps teams are prepared to absorb that level of change across an ever-increasing portfolio of applications that still need to be deployed, secured, updated and optimized.

  • Logz.io Integrates ChatGPT With Observability Platform

    Logz.io Integrates ChatGPT With Observability Platform

    Logz.io has integrated the ChatGPT generative artificial intelligence (AI) platform with its Open 360 observability platform to extend its automated recommendation capabilities to reduce mean-time-to-remediation.

    ChatGPT, developed by OpenAI, is based on a large language model that Logz.io uses to enrich crowdsourced data. That approach enables ChatGPT to surface links to related information and best practices for resolving IT issues.

    Logz.io CTO Asaf Yigal said the company has integrated ChatGPT with its existing AI engine, dubbed Cognitive Insights, that applies machine learning algorithms to identify anomalies indicative of potentially critical IT issues. The company expects to be able to add other generative AI capabilities as additional advances are made, he added.

    The Logz.io Open 360 platform is based on open source OpenSearch, Prometheus and Jaeger software that the company has infused with machine learning algorithms. The integration with ChatGPT is enabled via an application programming interface (API) that OpenAI has provided.

    The overall goal is to employ AI to surface the most relevant issues a DevOps team needs to focus on without having to search huge volume of logs, tracing and metrics data, said Yigal. Generative AI platforms solve a fundamental cognitive load problem created today as DevOps teams collect more data, noted Yial. The more data a DevOps team collects, the harder it becomes to determine what’s going on in an IT environment, said Yigal. He added that generative AI platforms make it possible to analyze massive amounts of data at a scale that isn’t otherwise achievable.

    AI tools should make it possible to manage IT at a level of scale that eliminates many of the low-level data engineering and analytics tasks that previously required manual effort from a DevOps engineering team. It’s not clear how many other DevOps tools and platforms will be invoking generative AI capabilities in the months ahead, but DevOps teams should assume that large language models will soon be augmenting DevOps teams in ways that previously would have been thought unlikely.

    For example, discovering vulnerabilities in software running in production environments is about to become trivial as artificial intelligence (AI) platforms such as ChatGPT evolve. A generative AI platform can identify code vulnerabilities in much the same way as a traditional scanning tool. An AI platform, however, could theoretically monitor code repositories and scan them for vulnerabilities as updates and commits are being made in real-time. DevOps teams should be able to use generative AI platforms to discover and remediate these issues before code is deployed in a production environment.

    It’s just as probable bad actors will use the same platform to achieve the same goal, so from that perspective, many DevOps teams will now find themselves in an AI arms race to improve DevSecOps workflows.

    There are still lots of issues to be worked out in terms of the overall accuracy of generative AI platforms, but they will only become more intelligent as processors continue to advance. The issue now will be determining precisely where the man-machine interface for DevOps teams is today and in the future.

  • Cisco Bets on OpenTelemetry to Advance Observability

    Cisco Bets on OpenTelemetry to Advance Observability

    Cisco today announced a technology preview of a Cisco Full-Stack Observability Platform based on instances of open source OpenTelemetry agent software being advanced by the Cloud Native Computing Foundation (CNCF) to collect metrics, event, logs and distributed traces. The Cisco Full-Stack Observability platform will be available in June 2023.

    The platform, announced at a Cisco Live EMEA event in Amsterdam, Netherlands, will combine the capabilities of multiple Cisco platforms and technologies into a single offering.

    At the same time, the company also announced the bidirectional integration between its existing Cisco AppDynamics application life cycle management (ALM) tool and the Cisco ThousandEyes network monitoring platform beginning in April.

    Finally, Cisco is making available a Business Risk Observability offering to provide business risk scoring. Business Risk Observability combines capabilities of its Kenna Risk Meter tool—gained when Cisco acquired Kenna Security in 2021—with the ability to monitor business transactions through Cisco AppDynamics to provide better visibility into application security. In addition, Cisco has integrated its Panoptica application programming interface (API) management security tool and the Talos threat intelligence platform within the Business Risk Observability Platform.

    Carlos Pereira, a Cisco fellow and chief architect for strategy, incubation and applications at Cisco, said Cisco is moving to narrow the historic divide between application development and cybersecurity teams to enable organizations to adopt DevSecOps best practices and make it simpler to prioritize the remediation of vulnerabilities that are likely to have the most impact on the business.

    Like most providers of observability platforms, Cisco is betting that more applications will be instrumented as OpenTelemetry software continues to mature. Cisco is now the single largest contributor to this project, noted Pereira.

    OpenTelemetry will also play a critical role in improving application security as more applications become instrumented, he noted. In fact, a recent Cisco AppDynamics survey found more than three-quarters of respondents (76%) believed that DevSecOps is essential for organizations to effectively protect against a multi-stage security attack. However, only 43% reported their organization had started implementing DevSecOps workflows.

    Observability, of course, has always been a core DevOps tenet, but achieving and maintaining it is challenging. Most DevOps teams today aspire to maintain some level of continuous monitoring. However, as it becomes easier and less costly to instrument applications, interest is rising in observability platforms that make it simple to investigate anomalies indicative of an issue that could disrupt an application environment. Most of those observability platforms are infusing those platforms with machine learning algorithms to surface those anomalies as part of an effort to augment the capabilities of a DevOps team.

    Regardless of the approach to observability, many organizations will soon be trying to determine whether to rely on existing monitoring tools that make it possible to track pre-defined metrics. In some cases, there may still be a need for that legacy approach to managing IT. Still, in other instances, it may be possible to rationalize some of those platforms in favor of a more advanced approach that relies on a more advanced approach to achieving observability.

  • Where Does Observability Stand Today, and Where is it Going Next?

    Where Does Observability Stand Today, and Where is it Going Next?

    As we move into the second half of 2023, it’s only natural to engage in the annual ‘state of the industry’ reviews and take a general inventory of the past year while looking out into the immediate future. Observability has gained traction among DevOps and platform engineering teams over the past year and is poised to continue that velocity. But my observation is that the current observability model is broken.

    Too Much Data

    Long story short: Many organizations (and engineers specifically) agree that they are sending too much data to their monitoring tools, resulting in an inability to garner valuable insights because the systems are massively overloaded. Sending this high volume of data also costs too much and requires an inordinate amount of time for analysis, which many organizations don’t have. Put simply–more data doesn’t mean more clarity; in fact, we see the opposite.

    Massive adoption of cloud-native technologies such as Kubernetes that heighten the challenge of efficiently monitoring environments is also accelerating this problem. Beyond increasing costs and complexity, many teams seem to feel that their current approach doesn’t create the desired level of observability for Kubernetes, full stop.

    Another major issue we see on the observability landscape relates to the overall maturity of monitoring processes and teams. In many instances, even when organizations have effective tools, they struggle to interpret the data produced into targeted conclusions that their teams can translate into effective actions. And this is further amplified by the outstanding engineering talent shortage because good people are harder to find and retain than ever before.

    We also see a lot of pervasive challenges related to organizations’ desire to use popular open source monitoring tools-especially if they are attempting to do so in an integrated manner or to support rapidly growing deployments at scale.

    Overwhelmed by Observability Data?

    In summary, if you’re overwhelmed by observability data, if complexity and costs grow out of control and you’re also struggling to make sense of the available information and improve your cloud applications, we think that means that the current observability model really is broken.

    To that end, gaining a deeper perspective into end user opinions on these topics, among others, is the precise goal of the annual DevOps Pulse Report, currently in its sixth year and now in the survey stage. We predict that this year’s research project will underline the aforementioned challenges and help frame how teams might seek to address them.

    What types of findings do we hope to unearth? Last year, respondents revealed that despite a growing perception of DevOps maturity, it was actually taking them more time to respond to emerging problems. Roughly 64% of respondents reported that MTTR during production incidents was over an hour, compared to only 47% the previous year.

    Last year’s report also highlighted the reality that monitoring complex environments remains difficult with over 52% of respondents citing Kubernetes, microservices and serverless as their primary challenges in gaining improved observability.

    Both of these previous findings also seemed to underline the growing issues of data overload and spiraling complexity. We’ve also seen previous evidence of a lack of maturity around distributed tracing—a critical observability practice aimed directly at increasing visibility into complex architectures—despite the fact that 75% of respondents listed it as a priority in last year’s research.

    Is your team struggling to make sense of its available monitoring data, or do so in a way that aligns with your current processes or budgets? Hopefully, the 2023 DevOps Pulse Report, set to publish early this year, will put some numbers behind these assertions and help us all understand how to move forward.

    If you want to participate, you can do so here.

  • New Relic Bolsters Observability Platform

    New Relic Bolsters Observability Platform

    New Relic has updated its observability platform to include the ability to better detect and track errors in addition to monitoring vulnerabilities.

    At the same time, an instance of the New Relic observability platform that runs natively on the Microsoft Azure cloud platform is now also generally available.

    Manav Khurana, general manager for observability product and chief growth office for New Relic, said the alliance will enable Microsoft Azure customers to consume New Relic as part of their existing Microsoft Azure services contract.

    New Relic already provides an errors inbox to track issues, but is now adding a tool to track the impact an error might have by correlating data across traces and logs. The company has also integrated its platform with Slack to make it simpler for IT teams to generate alerts when vulnerabilities are introduced into codebases and manage errors more collaboratively.

    Similarly, New Relic is also looking to foster greater collaboration between software engineering and cybersecurity teams. A New Relic Vulnerability Management tool with no additional configuration required captures security signals generated via the company’s Telemetry Data Platform in a way that can be analyzed using an interactive application security testing (IAST) tool that New Relic gained with its acquisition of K2 Cyber Security. Additional IAST capabilities available in preview include the ability to leverage a patented deterministic technique to identify and provide automated vulnerability validation that highlights a proof-of-exploit.

    The overall goal is to provide more visibility and context for organizations that are implementing best DevSecOps practices, said Khurana.

    It’s still relatively early days as far as the integration of observability platforms into DevOps workflows is concerned. A recent survey conducted by New Relic found most organizations don’t expect to have robust observability practices in place by 2025. While most organizations have tools to monitor predefined metrics today, there is a significant gap between observability platforms that enable IT teams to determine the root cause of an IT issue and monitoring platforms that generate an alert whenever a threshold is exceeded.

    In fact, many organizations have too many monitoring tools that often surface conflicting or redundant alerts, noted Khurana.

    One way or another, more codebases are being instrumented. As that process continues to evolve, the agents embedded in that code make it simpler to collect the logs and traces needed to advance observability. The challenge, as always, is that it takes time for the number of fully instrumented applications to exceed the number of legacy applications that are either partially instrumented or not instrumented at all.

    As IT environments become more complex, the need for observability is becoming much more pressing at a time when most IT teams are more short-handed than ever, noted Khurana.

    Regardless of approach, there’s no doubt that observability, with patience, will impact the management of IT for the better.