Tag: New Relic

  • New Relic Survey Unearths Observability Challenges

    New Relic Survey Unearths Observability Challenges

    A New Relic survey found only 27% of respondents have achieved full-stack observability with only 5% claiming they have a mature observability practice in place. A third (33%) of respondents also said they still primarily detect outages manually or based on complaints, the survey found.

    The global survey polled 1,614 respondents, including 1,044 practitioners and 570 IT decision-makers and was published today by New Relic.

    On the plus side, the survey also found nearly three-quarters of respondents said C-suite executives in their organization are advocates of observability, and more than three-quarters of respondents (78%) saw observability as a key enabler for achieving core business goals.

    However, more than half (52%) of respondents said they experienced high-business-impact outages once per week or more and 29% said they take more than an hour to resolve those outages.

    Peter Pezaris, senior vice president for strategy and user experience at New Relic, said a big reason it takes so long to resolve issues is the time required to determine the root cause of issues using multiple tools. A full 82% of respondents said they use four or more tools to monitor the health of their systems. Only 7% said their telemetry data is entirely unified and only 13% said the visualization or dashboarding of that data is entirely unified. Nearly half of respondents (47%) said they would prefer to have a single, consolidated observability platform, but only 2% said they currently used one tool for observability.

    New Relic, of course, is making a case for a single observability platform that spans both the application environment and the underlying infrastructure an application depends on. Today, most IT teams are using a wide range of tools to monitor infrastructure and applications.

    Nearly all respondents said by 2025 they expect to deploy capabilities like network monitoring, security monitoring and log management, as well as Kubernetes monitoring. More than a third (36%) believe observability increases their productivity and enables them to find and resolve issues faster. Just under a third (32%) said observability enables cross-team collaboration, while more than a quarter said observability improves their ability to innovate.

    Nearly three-quarters (72%) expected to maintain or increase their observability budgets next year. More than half (52%) of respondents, including 57% of C-suite executives, expected observability budgets to increase over the next year. A total of 14% of all respondents and 16% of IT decision-makers expected to increase observability budgets significantly or extensively. IT decision-makers anticipate needing observability most for artificial intelligence (51%), internet of things (48%), edge computing (38%) and blockchain (36%) in the next three years.

    It’s still early days as far as the adoption of observability platforms is concerned, but it’s apparent that as application environments become more complex the plethora of monitoring tools that DevOps teams rely on will need to be streamlined. Observability platforms promise to unify logs, metrics and traces in a way that makes it simpler to launch queries to identify the root cause of an issue.

    The rate at which DevOps teams will embrace observability will naturally vary, but the biggest obstacle might not be the platforms themselves. Instead, the issue is understanding what queries can help DevOps teams better understand the root cause of an IT issue before there is a major disruption. In the long term, it’s expected that machine learning algorithms will leverage the data collected by observability platforms to automatically identify issues that might lead to a disruption long before it actually occurs.

    In the meantime, the hope is that monitoring tools will give way to observability platforms that will make managing complex IT environments much simpler for all concerned.

  • How to Adopt an SRE Practice (When You’re not Google)

    How to Adopt an SRE Practice (When You’re not Google)

    Site reliability engineering (SRE) isn’t a new term or practice. The practice of applying software engineering skills and principles to operations problems and tasks happened even before site reliability engineer was a defined job title. But organizing a proactive approach to building and maintaining software drives long-term success in improving operational efficiency, data-driven roadmap planning and general uptime and reliability. All these advantages account for the widespread adoption of SRE. 

    In this article, I’ll dive into what it takes to get into site reliability engineering, how to adopt it within your own organization and some of the core principles and best practices you’ll need to keep in mind as you move forward in your SRE maturity journey.

    What is SRE?

    SRE, or site reliability engineering, is the practice of applying software engineering expertise to DevOps and operations problems. Often, this means proactively writing code and developing internal applications or services to combat reliability and performance concerns. SRE has been a practice for many years but has been more recently popularized by Google when they first published Site Reliability Engineering: How Google Runs Production Systems in March 2016.

    SRE is a complicated acronym because it both relates to a job title, site reliability engineer,  as well as a general practice adopted by development and IT teams, site reliability engineering. SRE teams are often organized differently depending on the organization and the services they support. Sometimes site reliability engineers (SREs) are sprinkled among development teams. This means they can vocalize concerns during roadmap planning and work closely with QA teams, collaborating on everything from shipping features to staging to managing production environments. 

    Another approach organizes an SRE team as a standalone group. The SRE team as a whole is focused on responsibilities including monitoring applications and infrastructure, establishing reliability metrics, tracking issues with new releases and handling on-call duties. No matter how they are organized, what remains the same for all these SREs is their initiative—reliability and performance.  

    DevOps Vs. SRE

    The rapid adoption of DevOps practices may have you wondering, “How is SRE different from DevOps?” Commonly, the two terms go hand-in-hand. SRE is a practice that doesn’t necessarily have to be part of DevOps culture and adoption but is often implemented by organizations that are further along in their DevOps journey. The further along on your DevOps maturity model, the more likely you are to have bought into SRE practices.

    The conversation isn’t ‘SRE versus DevOps; the conversation is about establishing a proactive SRE team and operating model to help strengthen your DevOps practice. Whether you choose an SRE framework integrated into your development and IT teams, or you want to make SRE a standalone business unit, you need to understand their general responsibilities.

    SRE Team Responsibilities

    Site reliability engineers are responsible for defining what performant and reliable really mean when you talk about your applications, services and infrastructure. The day-to-day tasks can range anywhere from instrumenting new monitoring solutions to building custom apps for technical support teams. They might ship new code to production to fix bugs or deliver new features, or they might respond to incidents in real-time and work closely with support teams to deliver positive customer experiences.

    At the end of the day, site reliability engineers are the key to understanding exactly how customers experience your product and how to track system performance and reliability through your customers’ eyes. SRE teams need to figure out exactly where service boundaries exist between what development teams ship and what customers experience. From there, they need to find ways to monitor reliability and performance concerns in a way that helps your internal teams proactively identify risks and deliver better software. 

    SRE teams spread knowledge across the product and development teams to consistently define reliability across the entire organization. With everyone on the same page, the engineering teams can make data-driven decisions when it comes to releasing new features or improving current experiences in production. 

    Site Reliability Engineering Principles and Practices

    At a very high level, Google defines the core of SRE principles and practices as an ability to ’embrace risk.’ Site reliability engineers balance the organizational need for constant innovation and delivery of new software with the reliability and performance of production environments. 

    The practice of SRE grows as the adoption of DevOps grows because they both help balance the sometimes opposing needs of the development and operations teams. Site reliability engineers inject processes into the CI/CD and software delivery workflows to improve performance and reliability but they will know when to sacrifice stability for speed. By working closely with DevOps teams to understand critical components of their applications and infrastructure, SREs can also learn the non-critical components.

    Creating transparency across all teams about the health of their applications and systems can help site reliability engineers determine a level of risk they can feel comfortable with. The level of desired service availability and acceptable performance issues that you can reasonably allow will depend on the type of service you support as well. SRE principles and practices embrace experimentation and require a dedication to proactively understanding the health of the services they support.

    An SRE Operating and Maturity Model

    You can perform a lot of the responsibilities asked of a site reliability engineer and still have a software engineer job title. So, how do you know how mature your site reliability engineering practice is? Luckily for you, we’ll lay out a quick way to build an effective SRE operating model and track your maturity against it. An SRE operating model typically includes three elements, which you might achieve in phases:

    1. A team (or at least one person) dedicated to the practice of SRE.
    2. Deep integration and influence across product, development and operations teams.
    3. Autonomy to automate workflows and write code for nearly any part of your application or system.

    Your SRE maturity depends on where your organization falls along these three elements of an SRE operating model. If you’ve taken the steps to make an SRE team or hire your first site reliability engineer, you’re at the beginning of your journey. If you have a team and they are a valued part of roadmap discussions, QA, deployment workflows, incident management processes, then you have a somewhat mature SRE practice. 

    An organization only reaches complete SRE maturity when the SRE business unit has the autonomy to automate workflows, build applications, own monitoring and alerting solutions, or interject themselves into nearly any conversation. Vocalizing performance and reliability concerns upfront and having a proactive discussion about those concerns is always better than simply ignoring them until it’s too late.

    Monitoring, CI/CD and Organizational Automation

    Site reliability engineers can and will automate just about anything and everything. If it can proactively detect, remediate or resolve an issue, it needs to be automated. From continuous integration and delivery practices to production environment monitoring, SREs should have some visibility into all of it. If they can identify ways to proactively uncover performance and reliability issues, then they need to have the authority to implement those changes.

    Today’s DevOps and IT capabilities around automation, monitoring, artificial intelligence and machine learning give SRE teams a huge advantage when identifying issues, responding to them and fixing them. Organizations with mature DevOps and SRE practices can catch problems in staging and they can also build automated incident management workflows and self-correcting systems. By determining critical components in your applications and infrastructure, SREs can narrow down the scope of things that can cause major problems.

    The Practice of Service Levels (SLIs, SLOs and SLAs)

    Service levels come into play to help SRE teams communicate the true health of digital products and services to all stakeholders. This is done by identifying and measuring critical components that are key to delivering positive customer experiences. In particular, they need to know when one or more components expose functionality to external customers. We call these intersection points system boundaries. System boundaries are the place where site reliability engineers need to apply service-level indicators and objectives to their metrics in order to tell the real story of system performance and reliability. 

    • Service-level indicators (SLIs) are the key measurements to determine the availability of a system.
    • Service-level objectives (SLOs) are goals you set for how much availability you expect out of a system.
    • Service-level agreements (SLAs) are the legal contracts that explain what happens if the system doesn’t meet its SLO.

    While SREs aren’t always responsible for managing service levels, it often falls within their purview. By tracking SLIs and tying them to SLOs, you can set goals around the performance of a system. Google’s SRE book defines the four golden signals of service levels as latency, traffic, errors and saturation. So, for example, you could look at an API call and track its number of successful/failed requests (the SLI) against a general percentage of requests that need to be successful for customers to have a good experience (the SLO).

    SRE teams will often set strict SLOs on critical components within their applications and services to better understand how strict of an SLA they can agree to with customers. From here, the team can apply error budgets as a way to understand how quickly they must resolve issues in order to stay compliant with their SLOs. Service levels allow teams to aggregate metrics and create a transparent view of uptime, performance, and reliability across the entire organization. At a glance, business leaders can use service levels to monitor compliance across multiple teams, applications, services, etc. to gain a comprehensive understanding of their system’s health.

    Adopting SRE Best Practices

    Adopting SRE best practices and principles won’t happen overnight. It takes time and effort to proactively monitor your teams and systems for performance and reliability concerns. But, in the end, your DevOps teams and especially your customers will thank you for deciding to take advantage of site reliability engineering.

  • New Relic Expands Scope of Observability Reach

    New Relic Expands Scope of Observability Reach

    At its Futurestack conference, New Relic announced it expanded the integrations and tools it provides for its observability platform and added its first cybersecurity tool.

    The company now provides more than 470 integrations with cloud services, open source tools and other enterprise technologies, with support for offerings from Akamai, Atlassian, CircleCI, Cloudflare, Netlify, PagerDuty and Postman now being added to its Instant Observability platform. The company has also added the ability to now collect logs alongside metrics and traces within its Application Performance Monitoring (APM) offering.

    Finally, New Relic has deepened its cloud ties with Microsoft, added a guided user onboarding interface, support for a wider range of instrumentation methods, tighter integration with Kubernetes and, for the first time, is branching out into the realm of cybersecurity via a New Relic Vulnerability Management service that is being added to its software-as-a-service (SaaS) portfolio.

    Ishan Mukherjee, group vice president for product go-to-market at New Relic, said New Relic Vulnerability Management is the start of a larger effort to enable IT teams to leverage the observability data they already collect via the New Relic platform to drive the adoption of DevSecOps best practices. Legacy approaches to vulnerability management create yet another silo of data that only further aggravates cybersecurity blind spots, he noted. New Relic Vulnerability Management aggregates data collected via its agent software and integrations with a wide range of platforms to provide a unified view of the overall security posture of an IT environment, Mukherjee added.

    It’s still early days as far as adoption of observability platforms is concerned, but it’s apparent that platforms that unify the collection of metrics, logs and traces across both applications and the IT infrastructure they run on are transforming how IT is managed. Most DevOps teams today are able to continuously monitor IT environments using tools that track a set of pre-defined metrics; observability platforms make it possible to aggregate data so that DevOps teams can launch queries that help them uncover the root cause of an IT issue. That capability is increasingly becoming critical as IT environments—thanks, in part, to the rise of microservices and cloud computing environments—become too complex for IT teams to manage using legacy tools.

    The challenge is that most IT teams are not quite sure what questions they should ask to get the most value from investment in an observability platform. Observability platforms that accurately surface issues without requiring much intervention from IT teams are likely to gain the most traction, as the competition among providers of these platforms intensifies.

    In the meantime, organizations might want to start reevaluating roles within their IT teams as it becomes simpler to collaborate around a single source of data. The days when IT teams had to triage issues using disparate tools that surfaced conflicting data may finally be coming to an end. As such, it should become possible for a team of IT professionals to manage a wider range of processes across an extended enterprise IT environment.

    Naturally, it may be a while before observability platforms drive wholesale reorganizations of IT teams, but it’s now more a question of when rather than if that day will come.

  • New Relic Adds SLO Tools to Observability Platform

    New Relic Adds SLO Tools to Observability Platform

    New Relic this week made a service level indicator (SLI) and service level objective (SLO) capability generally available within the New Relic One observability platform. The new capability makes it possible for DevOps teams to customize metrics, unified health reports and alerts.

    Alex Kroman, general manager and senior vice president for product engineering for New Relic, said the goal is to enable DevOps teams to more easily optimize services that span multiple applications and software components at a time when more organizations are relying on software to drive digital business transformation initiatives.

    IT teams have, of course, been tracking SLOs for decades. However, as application environments have become more distributed—thanks, in part, to the rise of microservices—achieving and maintaining SLOs has become more challenging. DevOps teams often lack an understanding of which metrics are most relevant to the business and even when they do, they have historically relied on manual processes and ad hoc tooling, noted Kroman.

    In contrast, New Relic is providing those capabilities in a way that makes it simpler to manage service levels at no additional cost, he added. DevOps teams can, for example, create SLIs in one click to automatically establish a baseline of desired performance and reliability. The platform also provides recommendations based on historical data to both establish benchmarks and customize and configure SLIs and SLOs.

    Those capabilities make it simpler to set service boundaries and track reliability across teams based on benchmarks, tags and reports that include bespoke views for both service owners and business leaders. In effect, via an application programming interface (API) exposed by New Relic, it becomes possible to employ dashboards to gain visibility across an entire business process, said Korman.

    It’s still early days as far as the modernization of SLOs is concerned, but it’s clear that, over time, they will be managed as code along with everything else in a DevOps workflow. The more organizations become dependent on applications to drive digital business initiatives, the more critical it will become for DevOps teams to track SLOs. The decision that must be made is the degree to which it makes sense to manually implement some form of SLO-as-code versus relying on an observability platform that can be accessed as a cloud service.

    Observability, of course, has always been a core tenet of DevOps. Few organizations are able to really achieve it, however, because most IT teams have been monitoring little more than a pre-defined set of metrics. Modern observability platforms make it easier for site reliability engineers (SREs) to launch queries against aggregated instances of metrics, logs and distributed traces to ascertain the root cause of an issue. The issue then becomes how to correlate the results of those queries against the service levels that businesses expect from a set of applications that might be driving, for example, an order-to-cash process. After all, knowing what occurred within an IT environment doesn’t always easily translate into a report that the average business executive can easily comprehend.

  • New Relic: Observability Tops 2022 DevOps Agenda

    New Relic: Observability Tops 2022 DevOps Agenda

    If 2021 was the year when IT organizations became aware of the need for observability, then the coming year should see observability aspirations realized.

    A report published by observability platform provider New Relic postulates that there are no less than 11 factors converging in a way that will make observability an absolute requirement for organizations.

    At the top of that list is a simple fact: Observability is now required to drive digital business transformation initiatives that typically span multiple processes. In fact, a global survey of 1,300 IT leaders, software engineers and developers conducted by New Relic found 90% of respondents view observability as critical to the business.

    Second, as a result, observability is now starting to be applied in both pre- and post-production environments as organizations take a more holistic approach to managing the software development life cycle, the report noted.

    Third, the report suggested that IT teams are looking to make better-informed decisions based more on facts than intuition. To do this, teams are using data collected from across the enterprise application environment. In fact, the fourth factor advancing observability in the enterprise is that the cost of instrumenting application environments is dropping, which the report notes is making it easier to collect relevant data.

    The fifth and sixth factors reflect a desire to rationalize the number of monitoring tools that IT teams currently use and the fact that usage-based pricing has simultaneously made it less expensive to leverage observability platforms as needed.

    The seventh factor is the overall shift toward open source software that enables observability platform providers to collectively leverage innovations faster. The eighth factor, closely linked to the open source trend, is the rise of more complex open source platforms such as Kubernetes that require much higher visibility to successfully deploy and manage.

    The ninth trend identified in the report is increased adoption of DevOps best practices that encourage IT teams to view observability as a core tenet of any IT management strategy. The tenth factor cited by the report is the need to drive increased collaboration among IT professionals.

    Finally, the eleventh factor driving further adoption of observability is the need for increased application reliability as more organizations appreciate their dependence on software to deliver essential services.

    Buddy Brewer, a group vice president and general manager for New Relic, said now that observability platforms are becoming more accessible, the next big challenge will be teaching IT professionals what questions to ask as they troubleshoot both legacy monolithic applications and a wide range of emerging microservices-based applications. The results of those queries then need to be easily shared with both developers and internal IT operations teams that must work together to maximize application performance and availability, he added. The latter requirement is why New Relic decided to acquire CodeStream to make telemetry data available with integrated development environments (IDEs), noted Brewer.

    There is, of course, no shortage of observability platforms for IT teams to adopt. In fact, the biggest challenge now is getting every application stakeholder to agree to standardize on an observability platform—no small feat, as many DevOps teams may already have a preference for one approach over another.

  • Mona Allies with New Relic to Converge MLOps and DevOps

    Mona Allies with New Relic to Converge MLOps and DevOps

    New Relic and Mona, a provider of a platform for monitoring the models used to provide artificial intelligence (AI), announced today they have formed an alliance to help bridge the divide between DevOps teams and data scientists.

    Most data science teams today build models based on machine learning algorithms using operations platforms that enable them to manage the life cycle of those models, otherwise known as MLOps. Mona provides a set of monitoring tools that are employed to detect drift that can occur as some of the underlying assumptions that were made when building the model are discovered to be less accurate or when new data sources become available.

    New Relic, meanwhile, provides an observability platform that is widely employed by DevOps teams to monitor and observe an IT environment. IT teams that have access to New Relic One can now also view dashboards provided by Mona that detect anomalies involving data integrity issues and model performance issues.

    The integration also enables users to create custom Mona alerts that are shared via the New Relic Alerts and Applied Intelligence service. That capability reduced the volume of alerts generated by correlating anomaly detection to specific IT events.

    Yotam Oren, CEO of Mona, said that level of integration provides a bridge between DevOps and data science teams that typically have widely divergent cultures.

    Incorporating AI models within applications is the next major DevOps challenge. There is almost no application being built today that won’t incorporate some level of AI. The challenge is AI models are built by data scientists that employ a wide range of machine learning operations (MLOps) platforms to construct those models. The pace at which those AI models are developed, deployed and updated varies widely. However, all organizations will eventually need to confront the problem of how to insert AI models within applications both before and after they are deployed in a production environment.

    There are two schools of thought about how best to achieve that goal. The first is to assume an AI model is just another type of software artifact that can be managed as part of an existing DevOps process. In that context, there may be no need for a separate MLOps platform. Conversely, proponents of MLOps contend AI models are built using pipelines created by data engineering teams working in collaboration with data scientists. Developers only become part of the process when an AI model needs to be inserted into an application environment. AI models may ultimately need to be incorporated within an application, but the proponents of MLOps platforms maintain building models requires a unique platform to manage a software artifact that is built by training algorithms.

    It’s only a matter of time before compliance issues force some form of convergence between DevOps and MLOps teams, noted Oren. The longer it takes to address both the cultural and technical issues that are required to meld DevOps and data science teams, the more challenging it will become as both teams are set in their respective ways.

  • New Relic Acquires CodeStream to Close Observability Gap

    New Relic Acquires CodeStream to Close Observability Gap

    New Relic today revealed it has acquired CodeStream as part of an effort to make observability data more accessible to developers.

    Buddy Brewer, group vice president (GVP) and GM at New Relic said New Relic CodeStream makes application telemetry data collected via the New Relic One platform directly available within an integrated development environment (IDE), now including Microsoft VS Code. In addition, there are also integrations with Microsoft Teams and the GitHub repository.

    The goal is to close an observability gap that exists today between developers and IT operations teams that stems from a lack of developer visibility into production environments, he noted.

    Finally, New Relic is also announcing a core user pricing option for New Relic One that is aimed at developers. Starting at $49 per month, developers gain access to a core set of capabilities such as CodeStream integrations, errors inbox, logs, GraphQL application programming interfaces (APIs) and the ability to build and run custom applications on New Relic One.

    Peter Pezaris, CodeStream co-founder and CEO, now GVP and GM, strategy and developer tools at New Relic, said becoming part of New Relic will make it easier to bridge the divide that exists between most developers and IT operations teams by making it much easier for developers to see how their code is actually executing in a production environment. That capability will eliminate scenarios where code that runs just fine on a laptop executes poorly in a production environment, he added.

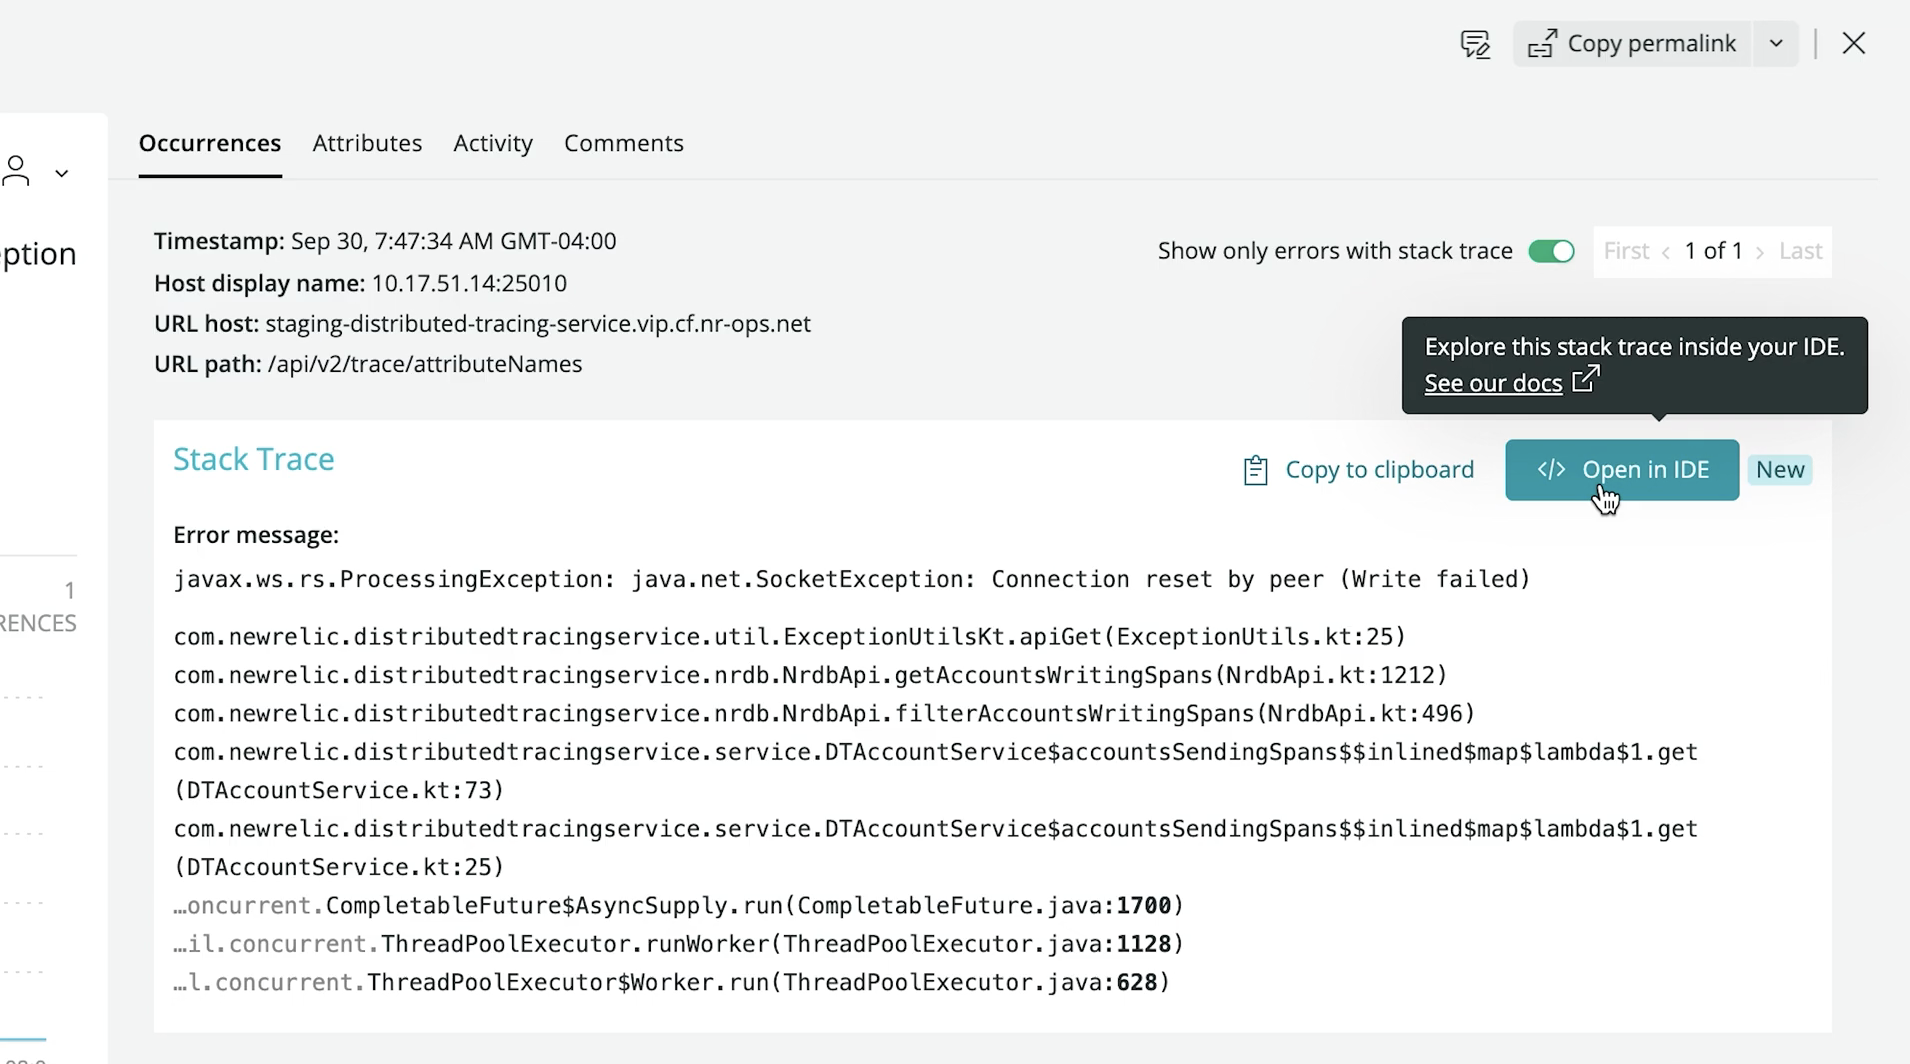
    Developers can also add inline code comments, trigger pull requests, request feedback and track issues directly from their IDE via integrations with a wide range of developer and communication tools. Developers also can switch from New Relic One into an IDE in a single click to navigate, triage and remediate production errors in the context of the code they wrote.

    New Relic is initially making New Relic CodeStream available for free—no credit card required—during a preview period that extends to January 12, 2022. Afterward, some of the more advanced features will require a paid user license once free tier limits are reached. Similarly, IT teams can also sign up for a free New Relic One account without entering a credit card to instrument their applications.

    As the responsibility for managing applications in production environments continues to shift left, Pezaris said it’s critical to give developers the tools they need to optimize code in a production environment.

    It’s not quite clear exactly how much responsibility for applications is shifting left toward developers; it differs from one organization to the next. Many are simply trying to reduce as much friction as possible between developers and their IT operations teams by providing more ‘connective tissue’ from New Relic that IT teams would have to otherwise write themselves, noted Pezaris.

    It may take some time to bridge the observability gap between developers and IT operations teams. Most IT operations teams are still coming to terms with what observability provides that existing IT monitoring tools don’t. Monitoring, at its core, focuses on predefined metrics to identify when a specific platform or application is performing within expectations. The metrics tracked generally focus on, for example, resource utilization. In contrast, observability combines metrics, logs and traces—a specialized form of logging—to instrument applications in a way that makes it simpler to troubleshot issues without having to rely solely on a limited set of metrics that have been pre-defined.

    In theory, at least, that level of observability should ultimately reduce the total number of incidents an IT operations team needs to fix by identifying issues long before they become an actual disruption.

  • New Relic I/O Aims to Simplify Instrumentation

    New Relic I/O Aims to Simplify Instrumentation

    New Relic today at the KubeCon + CloudNativeCon North America conference launched a New Relic Instant Observability (I/O) initiative through which it is making available open source tools to simplify application instrumentation.

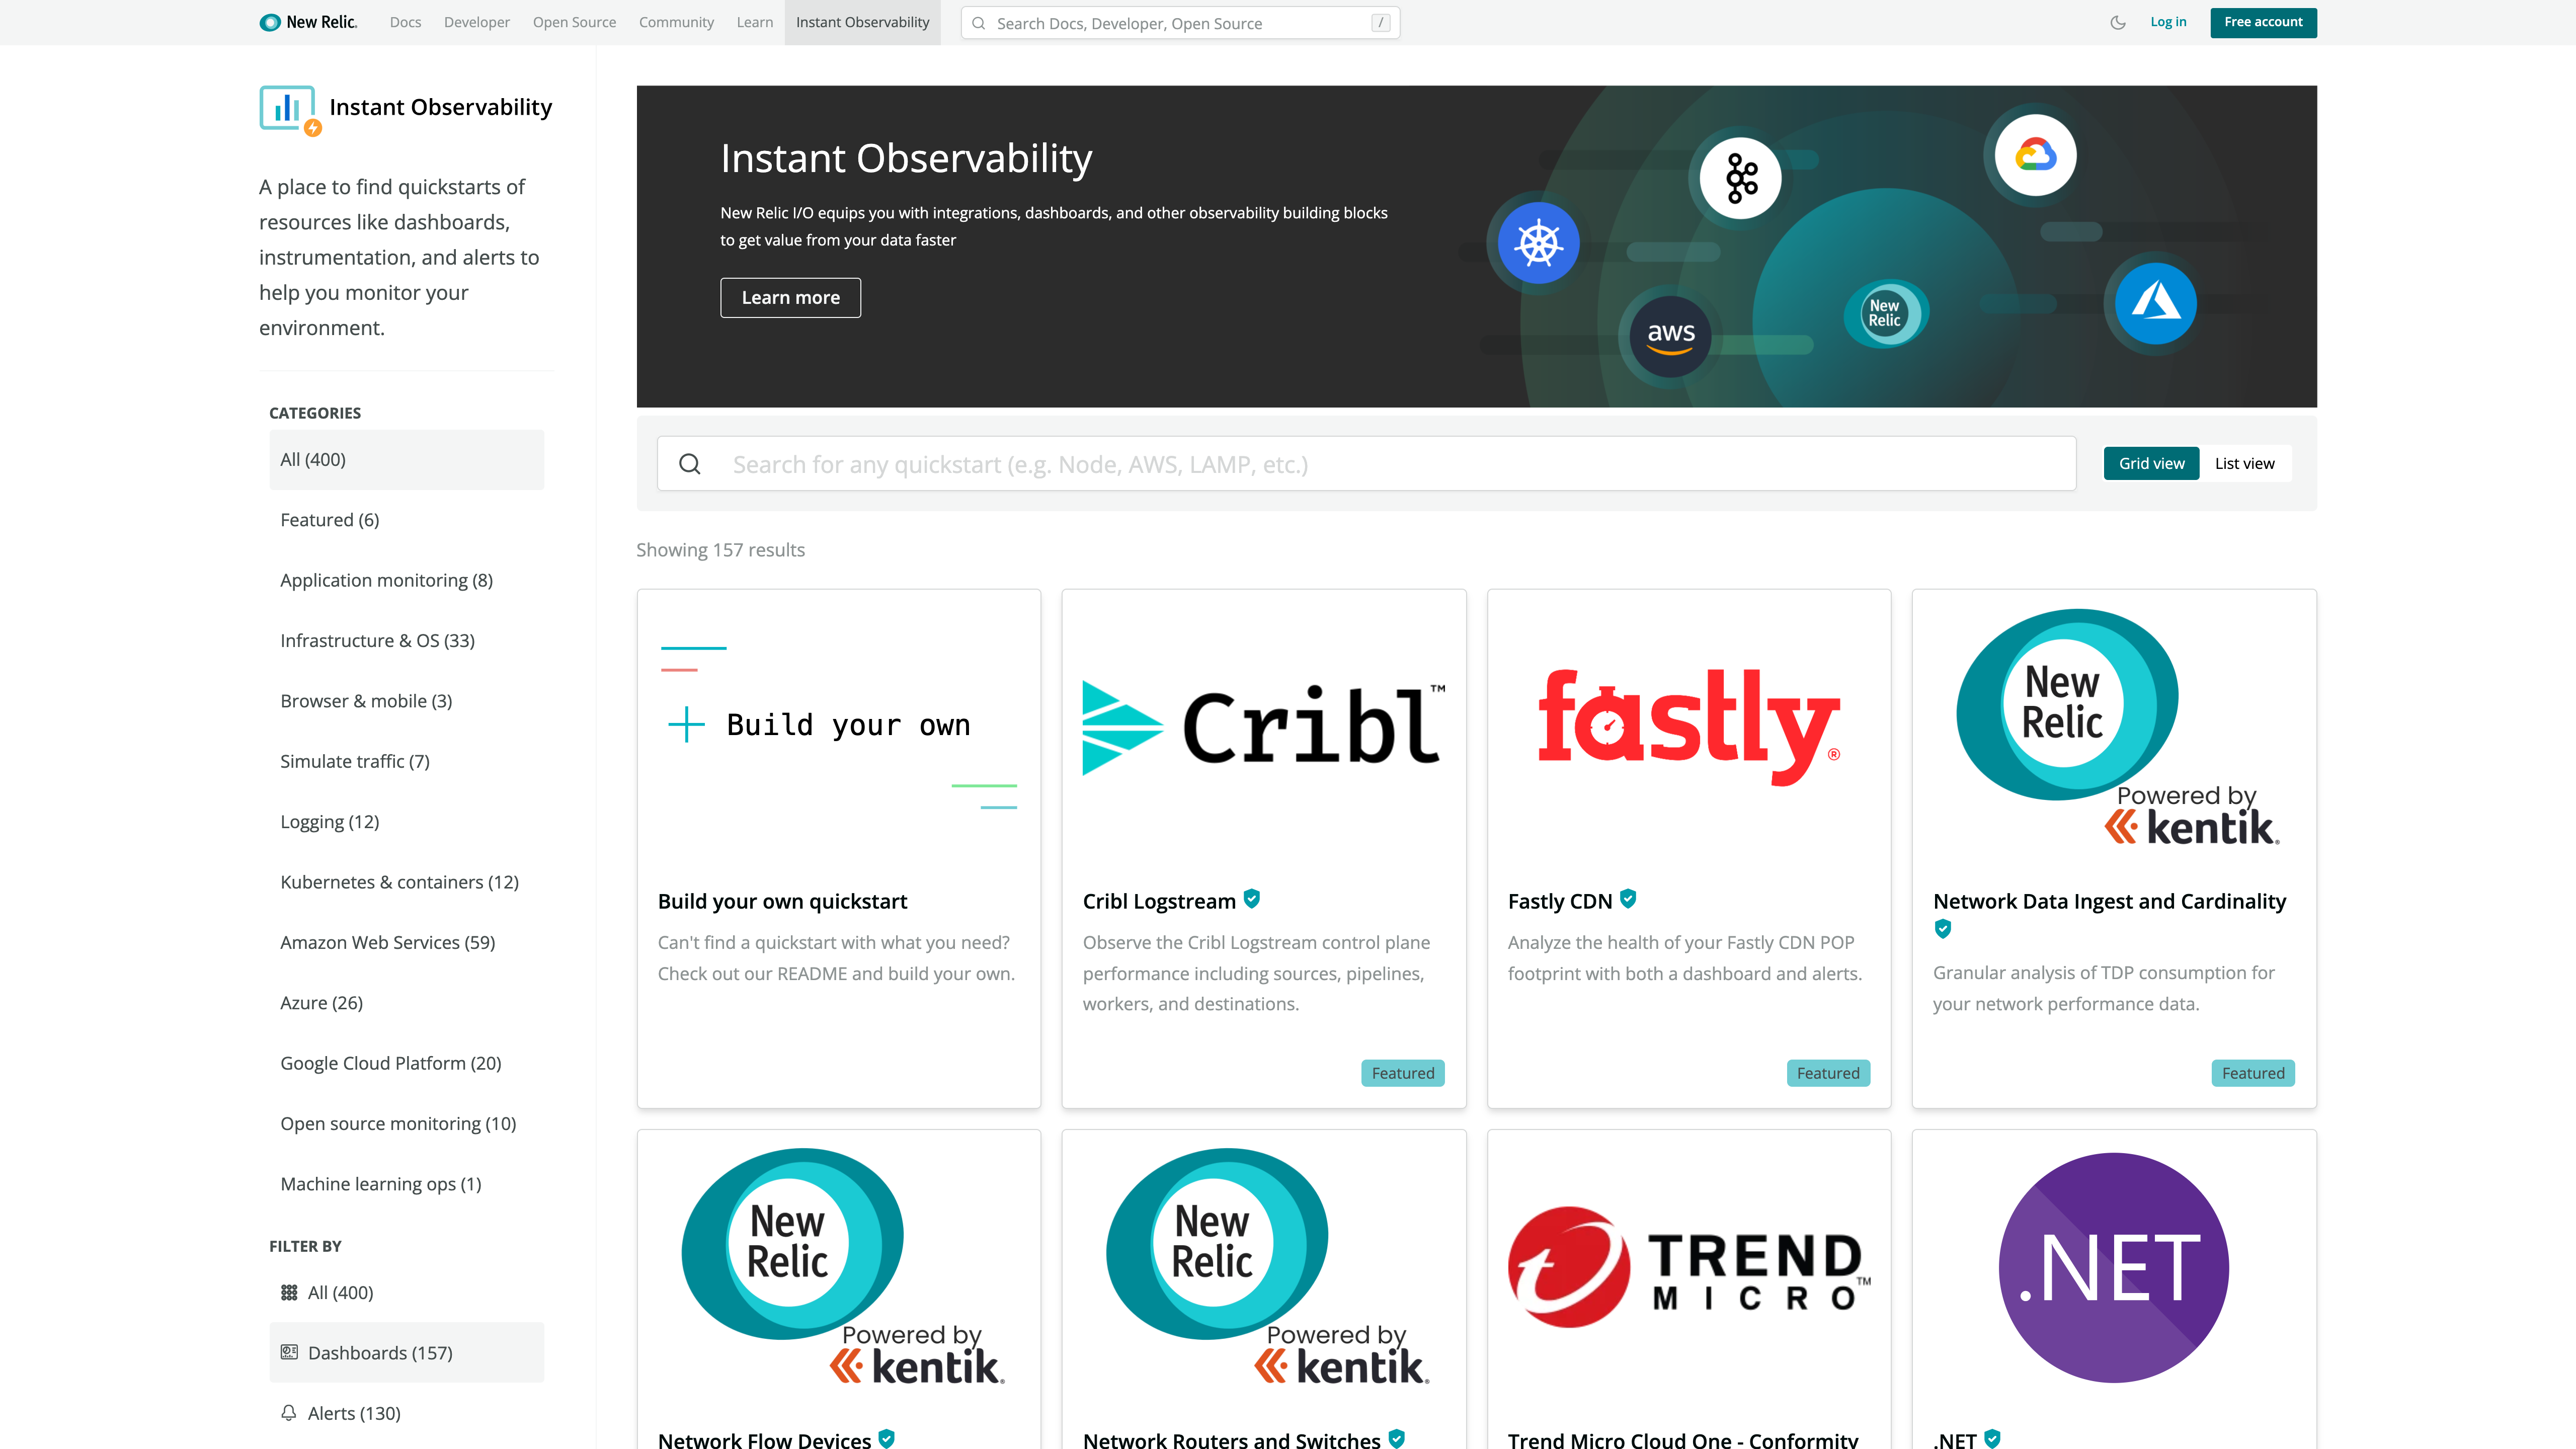
    Marck Robinson, senior vice president for engineering at New Relic, said the catalog of tools will help DevOps teams instrument a much wider range of applications. New Relic will make those tools available as part of the free tier of its observability platform delivered via the cloud. DevOps teams will be able to use more than 400 pre-configured quickstarts to both instrument applications and create dashboards, Robinson said.

    New Relic itself is contributing quickstarts for cloud services, open source tools and platforms such as Kubernetes, Istio and Cassandra. Third-party vendors that have already contributed to the catalog include Cribl, Fastly, Gigamon, Kentik, Lacework and Trend Micro. Each contribution is being vetted by New Relic as part of an effort to foster the development of a larger open source observability ecosystem, noted Robinson.

    Robinson said overall, New Relic is trying to make it easier for DevOps teams to close an instrumentation gap that is impeding IT organizations from moving beyond monitoring to embrace true observability of their IT environments. The recent New Relic 2021 Observability Forecast report notes only a quarter of respondents (26%) have a mature observability practice, with the most commonly cited barriers to observability being a lack of resources (38%) and skills gaps (29%).

    As a result, DevOps teams often encounter a last-mile observability challenge when it comes to both instrumenting applications and then building their dashboards, said Robinson.

    As part of a larger effort to make it easier to instrument applications, New Relic has open sourced agent software, standardized on the OpenTelemetry tools being advanced under the auspices of the Cloud Native Computing Foundation (CNCF) and contributed the Pixie observability platform for Kubernetes environments to the CNCF.

    Observability in one some or another has always been a core tenet of any DevOps best practice. Initially, DevOps teams focused on continuous monitoring as the most effective way to proactively manage application environments. However, it can still take days, sometimes weeks, to discover the root cause of an issue. However, observability platforms are emerging that correlate events in a way that makes it easier for analytics tools to identify anomalous behavior indicative of a root cause of an IT issue. Armed with these insights, it becomes a lot simpler for IT teams to resolve issues faster.

    In contrast, monitoring focuses on predefined metrics to identify when a specific platform or application is performing within expectations. The metrics tracked generally focus on, for example, resource utilization. Observability, on the other hand, combines metrics, logs and traces—a specialized form of logging—to instrument applications in a way that makes it simpler to troubleshot issues without having to rely solely on a limited set of metrics that have been pre-defined to monitor a specific process.

    With the rise of microservices-based applications, the shift to the cloud and more end users than ever working remotely, the need for observability has never been more critical. The issue now is finding a way to make it much simpler to achieve.

  • New Relic Launches Industry’s Largest Open Source Ecosystem of Quickstarts and Partner Integrations to Help Every Engineer Embrace Observability in Minutes

    Company doubles down on open source commitment with New Relic Instant Observability, an open catalog of 400+ quickstarts to help engineers instrument, dashboard and alert their entire stack

    Leading enterprise technologies such as Cribl, Fastly, Gigamon, Kentik, Lacework and Trend Micro contribute to accelerate adoption of observability by all engineers

    San Francisco, CA – October 13, 2021 – New Relic (NYSE: NEWR), the observability company, today launched New Relic Instant Observability (I/O), an open source ecosystem of quickstarts to empower all software engineers to instrument, dashboard and alert their entire technology stack in minutes. As part of New Relic’s commitment to make observability an open, data-driven and daily practice for every engineer, New Relic I/O offers end-to-end integrations with 400+ cloud services, open source tools and enterprise technologies, contributed and maintained by the community. The launch features contributions from partners such as Cribl, Fastly, Gigamon, Kentik, Lacework and Trend Micro to bring the power of the world’s leading technologies to engineers everywhere, no matter the technology or use case. New Relic I/O is available as part of New Relic’s generous free pricing tier, so every engineer can get started without talking to sales or providing a credit card.

    According to New Relic’s 2021 Observability Forecast, while most engineers and developers are familiar with observability, there’s a huge gap in adopting the practice: only 26% of respondents have a mature observability practice, and the most commonly cited barriers to observability success are lack of resources (38%) and skill gaps (29%). New Relic I/O addresses this gap by introducing an ever-expanding, open ecosystem of knowledge-focused resources that codifies the collective experience of the world’s observability experts and practitioners to help engineers around the world unlock the power of their data faster. 

    Continuing New Relic’s Commitment to “Open” Observability 

    Today’s news reinforces New Relic’s commitment to making observability a daily best practice for every engineer by continuing their investment into the global open source community. In the last 12 months, New Relic open sourced 10+ years of agents R&D, standardized on OpenTelemetry, and contributed Pixie to the Cloud Native Computing Foundation (CNCF). New Relic I/O is the continuation of this strategy to dramatically reduce the barrier for engineers to embrace observability to plan, build, deploy and run the great software that underpins flawless digital experiences for their customers, employees, partners and suppliers. 

    “As part of our developer-first strategy and commitment to open source and open communities, we’re proud to introduce a new open ecosystem to help all software engineers embrace observability as a data-driven approach and daily practice through a vibrant community of telemetry data sources, dashboards and alert configuration quickstarts,” said New Relic CEO Bill Staples. “We’re honored to launch with an ever-expanding group of industry-leading partners who will help us honor our commitment to make observability available for all so every engineer can instantly observe any hardware or software systems, cloud service, SaaS, IoT device or application in seconds.”

    “Over the coming years we anticipate thousands of telemetry sources, pre-built dashboards and quickstarts will be curated from the engineering community and consumed by millions of engineers who need telemetry data to make better decisions across the software lifecycle. Only New Relic is committed to this kind of open ecosystem approach to observability,” added Staples.

    Unlike other exchanges that only focus on instrumentation, New Relic I/O introduces an open hub of 400+ quickstarts that moves beyond just instrumentation with pre-built dashboards, alert configurations, user guides and documentation to help software engineers get started with observability via a guided install process. Additionally, New Relic I/O is a community built by the world’s leading observability experts, and each contribution is reviewed by New Relic. Users and partners can easily add new contributions, improve existing quickstarts and provide suggestions to the quickstart repository at any time.

    Access Instant Observability for Leading Partner Technologies

    As part of New Relic’s commitment to providing open observability, the launch features quickstart contributions from Cribl, Fastly, Gigamon, Kentik, Lacework and Trend Micro to enhance the understanding of application performance in the context of every engineer’s daily workflow. Additionally, New Relic is introducing quickstarts for cloud services, open source tools and enterprise technologies, including Kubernetes, Istio, Apache and Cassandra, so every engineer can get a customized observability view based on their preferred tools and specific use case. 

    • Cribl is the observability pipeline company that lets customers parse and route any type of data. The Cribl quickstart allows you to get immediate visibility into your entire environment right from New Relic One without the need to create your own dashboards and alerts—simplifying your workflows and reducing time to value.
    • Fastly is an edge cloud platform that enables its customers to create great digital experiences quickly, securely, and reliably. With the Fastly CDN quickstart, you can monitor key metrics from Fastly’s content delivery network that can help you improve service reliability and ensure great online experiences for end users.
    • Gigamon is the cloud visibility company. The Gigamon Hawk hybrid-cloud visibility and analytics platform provides access to – and extracts intelligence from – all network traffic. The Gigamon quickstart delivers advanced security capabilities that offer network detection and response to advanced threats, including shadow IT activities, crypto-mining and torrent activities, SSL cipher versions and expiration dates across both managed and unmanaged hosts, such as IoT/OT and containers.
    • Kentik is the network observability company. The Kentik quickstarts help network and development teams quickly identify and troubleshoot application performance issues correlated with network traffic performance and health data.
    • Lacework is a data-driven security platform for the cloud that can collect, analyze, and accurately correlate data across an organization’s AWS, Azure, GCP and Kubernetes environments, and narrow it down to the handful of security events that matter. The Lacework quickstart bridges the gap between observability and security teams, and integrates with New Relic’s database to surface security events and alerts directly in New Relic One. 
    • Trend Micro is a global cyber security leader. The Trend Micro Cloud One quickstart ingests Cloud Security Posture Management (CSPM) data from Conformity into New Relic One to contextualize and correlate it with workload telemetry data, delivering AI-powered visualizations and quick insights. This allows security and cloud teams to immediately take action in improving their security and compliance postures.

    “Cloud security has the same core tenants as observability—organizations need speed, automation, and context. Whether you’re proactively identifying vulnerabilities or trying to find the root cause and impact of a breach, you need to streamline as much as possible,” said Lacework President and CRO Andy Byron. “Our cloud security solution coupled with New Relic’s comprehensive observability capabilities provides our joint customers with a seamless and consistent experience between DevOps and security use cases. Together we’re bridging the gap between software delivery and security—providing deeper visibility, shared context and efficiency—all while not inhibiting your development speed.”

    New Relic Instant Observability is generally available today as part of the New Relic One platform. Users can browse all quickstarts in New Relic I/O today. For more information, visit newrelic.com or read our blog.

    Comments on the News

    Clint Sharp, co-founder and CEO at Cribl

    “Enterprises today are caught between the fleets of existing deployed agents, dozens of next-generation and legacy protocols, and their dreams of ubiquitous observability. With our partnership with New Relic, customers can easily onboard data from anywhere into New Relic – giving them full visibility to observe and secure every application.”

    Simon Wistow, co-founder and vice president of strategic initiatives at Fastly

    “Fastly is uniquely built to offer greater control and reliability, supporting faster sites and apps, high-quality streaming and real-time visibility—all in our agile, API-first platform. With Fastly’s powerful edge cloud and New Relic’s industry-leading cloud-based observability platform, businesses can correlate data from all other services to get a holistic, real-time view of their network while developers get the tools they need to build and deploy the most groundbreaking apps—all optimized for speed, security and scale.”

    Michael Dickman, Chief Product Officer at Gigamon

    “We share New Relic’s vision for an open ecosystem empowered by rich telemetry. Gigamon extends this vision to security use cases for hybrid- and multi-cloud infrastructure. By providing 5,000+ metadata attributes, for example, customers enhance their full security stack to go deep into the application communications of VM, container, and bare metal workloads. New Relic quickstarts make it easy to visualize Gigamon flow and metadata, complementing log- and metric-based observability. Gigamon ThreatINSIGHT completes the picture by using this network visibility to detect, investigate, and respond to threats from crypto-mining to beaconing.”

    Avi Freedman, co-founder and CEO at Kentik

    “The lack of integrated application and network observability continues to claim a high toll in latency and downtime. Even the companies with well-budgeted IT teams are exposed to user experience impact when they do not have a unified view of their environments. Through our expanded partnership with New Relic, we’re helping network and development teams quickly identify and troubleshoot application performance issues correlated with network traffic, performance and health data, and ultimately make services more reliable.”

    Wendy Moore, vice president of product marketing at Trend Micro

    “Architecting a security observability strategy is becoming increasingly important as cloud builders rapidly take advantage of high-velocity cloud architectures. By leveraging our security services platform with New Relic One, we are providing our joint customers comprehensive visibility into their cloud risk posture, providing valuable insights to respond better to vulnerabilities.” 

    About New Relic

    The world’s best engineering teams rely on New Relic to visualize, analyze, and troubleshoot their software. New Relic One is the most powerful cloud-based observability platform built to help organizations create more perfect software. Learn why developers trust New Relic for improved uptime and performance, greater scale and efficiency, and accelerated time to market at newrelic.com.

    Forward-looking statements

    This press release contains “forward-looking” statements, as that term is defined under the federal securities laws, including but not limited to statements regarding the availability and access to New Relic I/O, and our expectations of the increase in telemetry sources, prebuilt dashboards and quickstarts that will be curated from the engineering community over the coming years,  including any anticipated benefits, results and future opportunities related thereto. The achievement or success of the matters covered by such forward-looking statements are based on New Relic’s current assumptions, expectations, and beliefs and are subject to substantial risks, uncertainties, assumptions, and changes in circumstances that may cause New Relic’s actual results, performance, or achievements to differ materially from those expressed or implied in any forward-looking statement. Further information on factors that could affect New Relic’s financial and other results and the forward-looking statements in this press release is included in the filings New Relic makes with the SEC from time to time, including in New Relic’s most recent Form 10-Q, particularly under the captions “Risk Factors” and “Management’s Discussion and Analysis of Financial Condition and Results of Operations.” Copies of these documents may be obtained by visiting New Relic’s Investor Relations website at http://ir.newrelic.com or the SEC’s website at www.sec.gov. New Relic assumes no obligation and does not intend to update these forward-looking statements, except as required by law.

  • New Relic Survey Shows Greater Appreciation for Observability

    New Relic Survey Shows Greater Appreciation for Observability

    A global survey of 1,300 software engineers, developers, IT leaders and executives found half of respondents (50%) are in the process of implementing an observability platform. Another 23% of respondents said that they cannot gain end-to-end observability at all, while 26% said they believe they have mature observability practices in place. The survey, published today, was conducted by CITE Research on behalf of New Relic.

    The majority (94%) of IT professionals said observability is important for their job role, while nearly three-quarters (74%) said there is still room to grow their observability practice. In fact, 81% of the 450 C-suite executives that participated in the survey said they expect to increase observability budgets in the next year, with 20% expecting those budgets to increase significantly.

    Overall, the survey finds that lack of resources (38%), skills (29%), understanding of the benefits (27%) and strategy (26%) are top barriers to achieving observability.

    Observability, in one form or another, has always been a core tenet of DevOps best practices. Most DevOps teams have relied on monitoring tools to observe a specific process or function. The challenge is those monitoring tools track a pre-defined set of metrics such as resource utilization. Ideally, observability combines metrics, logs and traces—a specialized form of logging—to instrument applications in a way that makes it simpler to troubleshot issues without having to rely solely on a limited set of pre-defined metrics.

    Nearly three-quarters of respondents (72%) noted that IT teams today need to toggle between at least two different tools to manage IT, with 13% having to use more than ten different tools to monitor the health of their systems.

    In contrast, observability platforms make it possible to correlate events across both applications and infrastructure. This capability makes it easier for analytics tools to identify anomalous behavior indicative of the root cause of an IT issue. Armed with these insights, it becomes a lot simpler for IT teams to resolve issues faster.

    The New Relic survey notes that 60% of respondents still monitor telemetry data at the application level, which indicates that a massive amount of valuable telemetry data is largely going unused. A full 91% of IT professionals that responded to the survey noted that observability is critical at every stage of the software life cycle, especially when it comes to planning and IT operations.

    Top benefits cited include faster deployments (27%), more cost-effective use of IT resources (25%), better digital experiences (23%) and improved productivity (22%). The top use cases cited involved digital transformation initiatives (42%) followed by cloud optimization (37%), DevOps processes (36%) and bringing products to market faster (36%).

    Buddy Brewer, group vice president and general manager for New Relic, said observability will become a more pressing issue in IT environments, thanks to the rise of microservices-based applications running on Kubernetes. A full 88% of IT decision-makers New Relic surveyed said they are exploring Kubernetes and containers at some level right now, but only 10% said they have deployed them in a production environment. A total of 40% expect to be in production within three years.

    In general, it’s become critical for IT teams to be able to query data in real-time to resolve issues that are becoming more challenging to resolve at a time when organizations have never been more dependent on IT. Sampling data in the hopes of discovering issues is no longer sufficient, noted Brewer.

    The challenge, of course, is that most IT teams have been using legacy monitoring tools for so long that it’s still hard to imagine there might be a better approach. That doesn’t necessarily mean all those legacy tools will be immediately replaced, but it does mean many of them may simply fade away over time.

    One way or another, most IT teams will soon be able to observe IT environments more deeply. Developers increasingly are taking advantage of open source tools like OpenTelemetry to instrument applications in a way organizations can more easily afford, regardless of whether they fully appreciate the nuances of modern observability versus traditional monitoring.