Tag: New Relic

  • New Relic Extends AI to Identify Alert Coverage Gaps

    New Relic Extends AI to Identify Alert Coverage Gaps

    New Relic this week added additional artificial intelligence (AI) capabilities to its observability platform that make it possible to detect and resolve alert coverage gaps.

    Camden Swita, a senior product manager for New Relic, said it’s not uncommon for DevOps teams to discover an issue that the existing alerts they put in place were not designed to address. New Relic is adding machine learning algorithms at no additional cost that are designed to identify anomalies indicative of those potential issues. The platform then surfaces recommended alerts that DevOps teams can apply or further customize as they see fit, he added.

    Those machine learning algorithms ensure DevOps teams are tracking the right thresholds to ensure there are no blind spots that could adversely affect application performance, noted Swita.

    New Relic is employing both predictive and generative AI to enable DevOps team to detect and resolve issues faster. The company has been using machine learning algorithms for predictive AI for several years and, more recently, started providing early access to a generative AI tool dubbed Grok.

    The overall goal is to make the capabilities of an observability platform more accessible, Swita said. This is accomplished by surfacing issues without requiring a software engineer to craft intricate queries to interrogate metrics, logs and traces, he noted.

    The AI capabilities also serve to reduce the amount of alert noise; it’s now possible to more easily understand the root cause of an issue and reduce the total number of alerts that might otherwise be sent, he added.

    While there’s no doubt AI will help democratize DevOps by making it possible to write scripts and better manage workflows, it might be a while before DevOps teams trust the recommendations made. AI models typically require some time before they understand how an IT environment functions, and not every initial recommendation may be valid. In time, however, DevOps teams will find themselves increasingly supervising processes that AI models are executing.

    In addition, there are competing approaches to building large language models (LLMs) that drive generative AI. For example, it’s not clear whether chaining LLMs together will be more efficient than creating a single large ‘parent’ LLM that has ‘child’ relationships with smaller LLMs, noted Swita.

    In the meantime, DevOps teams would be well-advised to list tasks that are likely to be automated by AI models. Many of them will tend to be manual tasks that most software engineers don’t especially relish, so in that regard, there’s naturally a lot of interest in AI. It remains to be seen, however, whether various forms of AI might one day automate an entire DevOps workflow. In fact, most DevOps engineers are going to set a high bar for AI models that, at the very least, will be expected to perform a task as well as humans before it’s trusted completely.

  • New Relic Adds App Security Testing Tool to Observability Platform

    New Relic Adds App Security Testing Tool to Observability Platform

    New Relic today made available a public preview of an application security testing tool that will be integrated into its observability platform.

    Esteban Gutierrez, CISO and vice president of information security for New Relic, said the New Relic Interactive Application Security Testing (IAST) will provide DevSecOps teams with the context needed to identify the root cause of a cybersecurity issue down to specific lines of code.

    DevSecOps teams will be able to take advantage of IAST to identify vulnerabilities both in code as it is written and after it has been deployed in a production environment without any false positives, he noted.

    New Relic achieves that goal using deterministic testing techniques that surface an actual proof-of-exploit using observability data collected from both applications and the underlying infrastructure upon which they depend, said Gutierrez. DevSecOps teams are then provided with guided remediation suggestions, guardrails and tracking tools to both remediate the issue at hand and prevent it from reoccurring, he noted.

    New Relic IAST takes advantage of the agent software New Relic provides to collect observability data, which reduces the total cost of DevSecOps by providing IT teams that have adopted the New Relic platform with an integrated set of application security testing tools that doesn’t require them to acquire and manage a separate additional platform, added Gutierrez.

    That approach also ensures that application security testing is integrated with the continuous integration/continuous delivery (CI/CD) platforms that New Relic already observes, he added.

    The reason most vulnerabilities are not remediated in a timely fashion is the DevOps teams responsible for creating and deploying the required patches lack any context. They often don’t know, for example, how many instances of a vulnerability there might be or the actual level of severity. Without those insights, it becomes exceedingly difficult to prioritize remediation efforts, noted Guttierrez.

    As application security requirements become more stringent in the wake of forthcoming legislation, it’s now more of a question of when than if organizations will be required to better secure their software supply chains. The issue DevOps teams face now is finding a way to integrate application security testing tools into existing DevOps workflows without slowing down the pace at which applications are being developed.

    Of course, not every vulnerability discovered requires the same level of attention. Depending on its severity and likelihood of being exploited, DevOps teams need to prioritize which vulnerabilities need to be remediated first. There simply are not enough resources available today to fix every vulnerability an application might have. For the foreseeable future, there will remain technical debt involving vulnerabilities that will need to be addressed after an application is deployed in a production environment.

    The issue, of course, is that cybercriminals are getting more adept at exploiting those vulnerabilities. The amount of time any DevOps team has to resolve issues before they result in a breach continues to dwindle.

  • New Relic Taps Generative AI to Simplify Observability

    New Relic Taps Generative AI to Simplify Observability

    New Relic has added a tool that takes advantage of generative artificial intelligence (AI) to make it simpler to query the telemetry data collected by its observability platform via a natural language interface (NLI).

    Jemiah Sius, director of developer relations for New Relic, said New Relic Grok will make the New Relic One platform more accessible to a wider range of IT professionals, especially those that haven’t mastered New Relic’s proprietary programming language that enables DevOps teams to identify the root cause of an issue.

    New Relic Grok automatically pinpoints code-level errors in integrated development environments (IDEs) in addition to analyzing code, stack traces and production telemetry to suggest fixes. New Relic is providing this capability via integration with the large language models (LLMs) created by OpenAI, which is providing the foundation for a broad range of generative AI capabilities through Microsoft. New Relic has a long-standing alliance with Microsoft, added Sius.

    Using plain language, anyone can generate a system or app health report complete with anomalies, issues and recent deployments in a way anyone can understand without having to create and filter dashboards, he noted.

    New Relic Grok also makes it simpler to identify instrumentation gaps that can then be addressed using the instructions it provides. It can also set up missing alerts and automate alerts using the open source Terraform infrastructure-as-code (IaC) tool.

    Finally, IT teams can also use New Relic Grok to manage accounts, users and user access, data retention rules, usage, billing and other administrative tasks.

    New Relic previously invested in machine learning algorithms to automate observability tasks. These AI extensions to the New Relic platform are part of a larger effort to extend the reach of the New Relic One observability platform further left toward developers and IT administrators rather than just site reliability engineers (SREs), said Sius.

    However, New Relic doesn’t anticipate that generative AI will eliminate the need for SREs to use its programming tool to solve more complex problems, he added.

    The overall goal is to provide development teams with frictionless access to observability data at every stage of the software development life cycle to reduce mean-time-to-detection (MTTD) and mean-time-to-resolution (MTTR) of issues.

    In general, most organizations are still in the early stages of achieving full-stack observability. A recent New Relic survey found only 27% of respondents have achieved full-stack observability and only 5% claimed they have a mature observability practice in place. A third (33%) of respondents also said they still primarily detect outages manually or based on complaints, the survey found. On the plus side, the survey also found nearly three-quarters of respondents said C-suite executives in their organization are advocates of observability, and more than three-quarters of respondents (78%) saw observability as a key enabler for achieving core business goals. However, more than half (52%) of respondents said they experienced high-business-impact outages once per week or more and 29% said they take more than an hour to resolve those outages.

    AI, of course, promises to improve reliability. At the very least, it could make it easier to identify issues long before a major disruption occurs.

  • New Relic Report Surfaces Spike in Amazon JDK Usage

    New Relic Report Surfaces Spike in Amazon JDK Usage

    An analysis of the Java applications observed by New Relic showed nearly one-third of organizations (31%) are using the Amazon Java development kit (JDK) compared to 28% using the Oracle JDK as more Java applications are built and deployed in the cloud.

    The report also found the number of Java applications running in containers is remaining steady year-over-year at 70%.

    Overall, the report published last week found more than 56% of applications are now using Java 11 in production, followed by Java 8 at nearly 33%. However, more than 9% of applications are now based on Java 17, representing a 430% growth rate.

    Jemiah Sius, director of developer relations for New Relic, said it’s clear that Java 17 is starting to gain traction in production environments. This is happening at a faster rate than previous releases of the venerable programming language as more cloud-native applications based on containers are being built and deployed, noted Sius.

    Regardless of the version of Java, it doesn’t appear developers are moving away from Java as they build cloud-native applications, noted Sius. Rather than requiring developers to learn a new programming language, it’s simply been more cost-effective to enable them to continue building applications using a programming language they already know.

    Java, meanwhile, has been experiencing a renaissance after more organizations began contributing to projects once the core platform became available under open source licenses. In fact, the Java community is now adopting many concepts pioneered in other programming languages to enable organizations to, for example, drive digital business transformation initiatives that are dependent on legacy applications being modernized. As a result, most organizations will continue to deploy Java applications everywhere from the network edge to the cloud.

    New Relic, of course, is betting that as more cloud-native applications are deployed, the need for an observability platform that addresses the needs of developers and IT operations teams alike will become more apparent.

    In general, most organizations are still in the early stages of achieving full-stack observability. A recent New Relic survey found only 27% of respondents have achieved full-stack observability and only 5% claimed they have a mature observability practice in place. A third (33%) of respondents also said they still primarily detect outages manually or based on complaints, the survey found.

    On the plus side, the survey also found nearly three-quarters of respondents said C-suite executives in their organization are advocates of observability and more than three-quarters of respondents (78%) saw observability as a key enabler for achieving core business goals. However, more than half (52%) of respondents said they experienced high-business-impact outages once per week or more and 29% said they take more than an hour to resolve those outages.

    The expectation is that that augmenting DevOps teams with observability tools and platforms that are increasingly being infused with artificial intelligence (AI) will reduce outages, even as cloud-native applications make IT environments even more complex than they already are. The issue is, however, those application environments are becoming more complex at a rate that is far exceeding the pace at which observability platforms are currently being adopted.

  • New Relic Bets on AI to Advance Observability

    New Relic Bets on AI to Advance Observability

    New Relic is preparing to extend the capabilities of its observability platform by making use of both additional machine learning algorithms and the ChatGPT generative artificial intelligence (AI) platform.

    Peter Pezaris, senior vice president for strategy and experience at New Relic, said during an interview on an episode of TechStrong TV that a prototype of an AI model created using machine learning algorithms will automatically notify developers when code in a production environment is not performing well—right within their integrated development environment (IDE). The notification will then take developers to the precise line of code identified as the root cause of the issue, he said.

    DevOps teams will need to add two lines of code to applications running in production environments to take advantage of this capability. New Relic also plans to use a similar approach to integrate with generative AI platforms such as ChatGPT to create suggestions for fixing code, he added. ChatGPT now makes it possible to create entire programs in ways that output HTML and JavaScript code, so DevOps teams should expect to be able to use the platform to create natural language queries that invoke the proprietary query language New Relic makes available for its observability platform, he noted. Conversely, ChatGPT will make it possible to explain how a piece of code functions in plain language, Pezaris added.

    Previously, New Relic employed a similar approach to integrate its observability platform with machine learning operations (MLOps) platforms used to build and deploy AI models. This was part of a larger effort to integrate MLOps and DevOps workflows, added Pezaris.

    These AI extensions to the New Relic platform are part of a larger effort to extend the reach of the New Relic One observability platform further left toward developers. Most recently, New Relic added a free CodeStream module to its observability platform to give developers access to metrics and telemetry data that will enable them to write higher-quality code faster.

    That approach eliminates the need to wait for IT operations teams to surface issues that usually don’t manifest until long after the code in question was originally developed. The overall goal is to provide development teams with frictionless access to observability data at every stage of the software development life cycle to reduce mean-time-to-detection (MTTD) and mean-time-to-resolution (MTTR) of issues.

    Organizations should also be able to reduce technical debt faster by making it easier to identify issues that, for example, adversely impact application performance.

    In general, most organizations are still in the early stages of achieving full-stack observability. A recent New Relic survey found only 27% of respondents have achieved full-stack observability, and only 5% claimed they have a mature observability practice in place. A third (33%) of respondents also said they still primarily detect outages manually or based on complaints, the survey found.

    On the plus side, the survey also found nearly three-quarters of respondents said C-suite executives in their organization are advocates of observability, and more than three-quarters of respondents (78%) saw observability as a key enabler for achieving core business goals. However, more than half (52%) of respondents said they experienced high-business-impact outages once per week or more and 29% said they take more than an hour to resolve those outages.

    The hope is, of course, that by augmenting DevOps teams with AI capabilities, the number of those outages will be dramatically reduced in the months and years ahead.

  • JFrog Aligns With New Relic to Improve Observability

    JFrog Aligns With New Relic to Improve Observability

    JFrog and New Relic jointly announced today they will provide a free integration tool that will enable New Relic’s observability platform to consume log data from JFrog platforms for building and deploying applications securely.

    Announced at the Futurestack conference hosted by New Relic, this integration eliminates the manual effort that was previously required to integrate these platforms. Preconfigured New Relic dashboards provide a comprehensive view of performance data, artifact usage and security metrics in real-time that is automatically collected from JFrog Artifactory and JFrog Xray environments and then displayed alongside other telemetry data.

    Omer Cohen, executive vice president of strategy at JFrog, said that capability will make it easier to identify performance issues, urgent vulnerabilities and malicious users in a way that reduces the amount of time required to remediate those issues across the software supply chain.

    The goal now is to eventually provide similar levels of integration between JFrog platforms that enable DevOps teams to manage and secure application binaries with other observability platforms, added Cohen.

    It’s still early days as far as the adoption of observability platforms is concerned, but it’s apparent that as application environments become more complex the plethora of monitoring tools that DevOps teams rely on need to be augmented. Observability platforms promise to unify logs, metrics and traces in a way that makes it simpler to launch queries to identify the root cause of an issue. The rate at which DevOps teams will embrace observability will naturally vary, but the biggest obstacle might not be the platforms themselves. The biggest challenge is understanding which queries to actually launch to identify an issue that might later cause a major disruption. In the longer term, it’s expected that machine learning algorithms will leverage the data collected by observability platforms to automatically identify those issues. In the meantime, much still depends on the acumen of the DevOps team employing an observability platform.

    In fact, a recent New Relic survey found only 27% of respondents have achieved full-stack observability, with only 5% claiming they have a mature observability practice in place. A third (33%) of respondents also said they still primarily detect outages manually or based on complaints, the survey found. More than half (52%) of respondents also admitted they experienced high-business-impact outages once per week or more and 29% said they take more than an hour to resolve those outages.

    On the plus side, nearly three-quarters (72%) expected to maintain or increase their observability budgets next year. More than half (52%) of respondents, including 57% of C-suite executives, expected observability budgets to increase over the next year. A total of 14% of all respondents and 16% of IT decision-makers expected to increase observability budgets significantly or extensively. More than a third (36%) believe observability increases their productivity and enables them to find and resolve issues faster. Just under a third (32%) said observability enables cross-team collaboration, while more than a quarter said observability improves their ability to innovate.

    One way or another, visibility into DevOps environments clearly needs to improve as application environments become more complex. The challenge, as always, is determining the cost required to achieve it.

  • New Relic Adds Module to Surface Code Metrics

    New Relic Adds Module to Surface Code Metrics

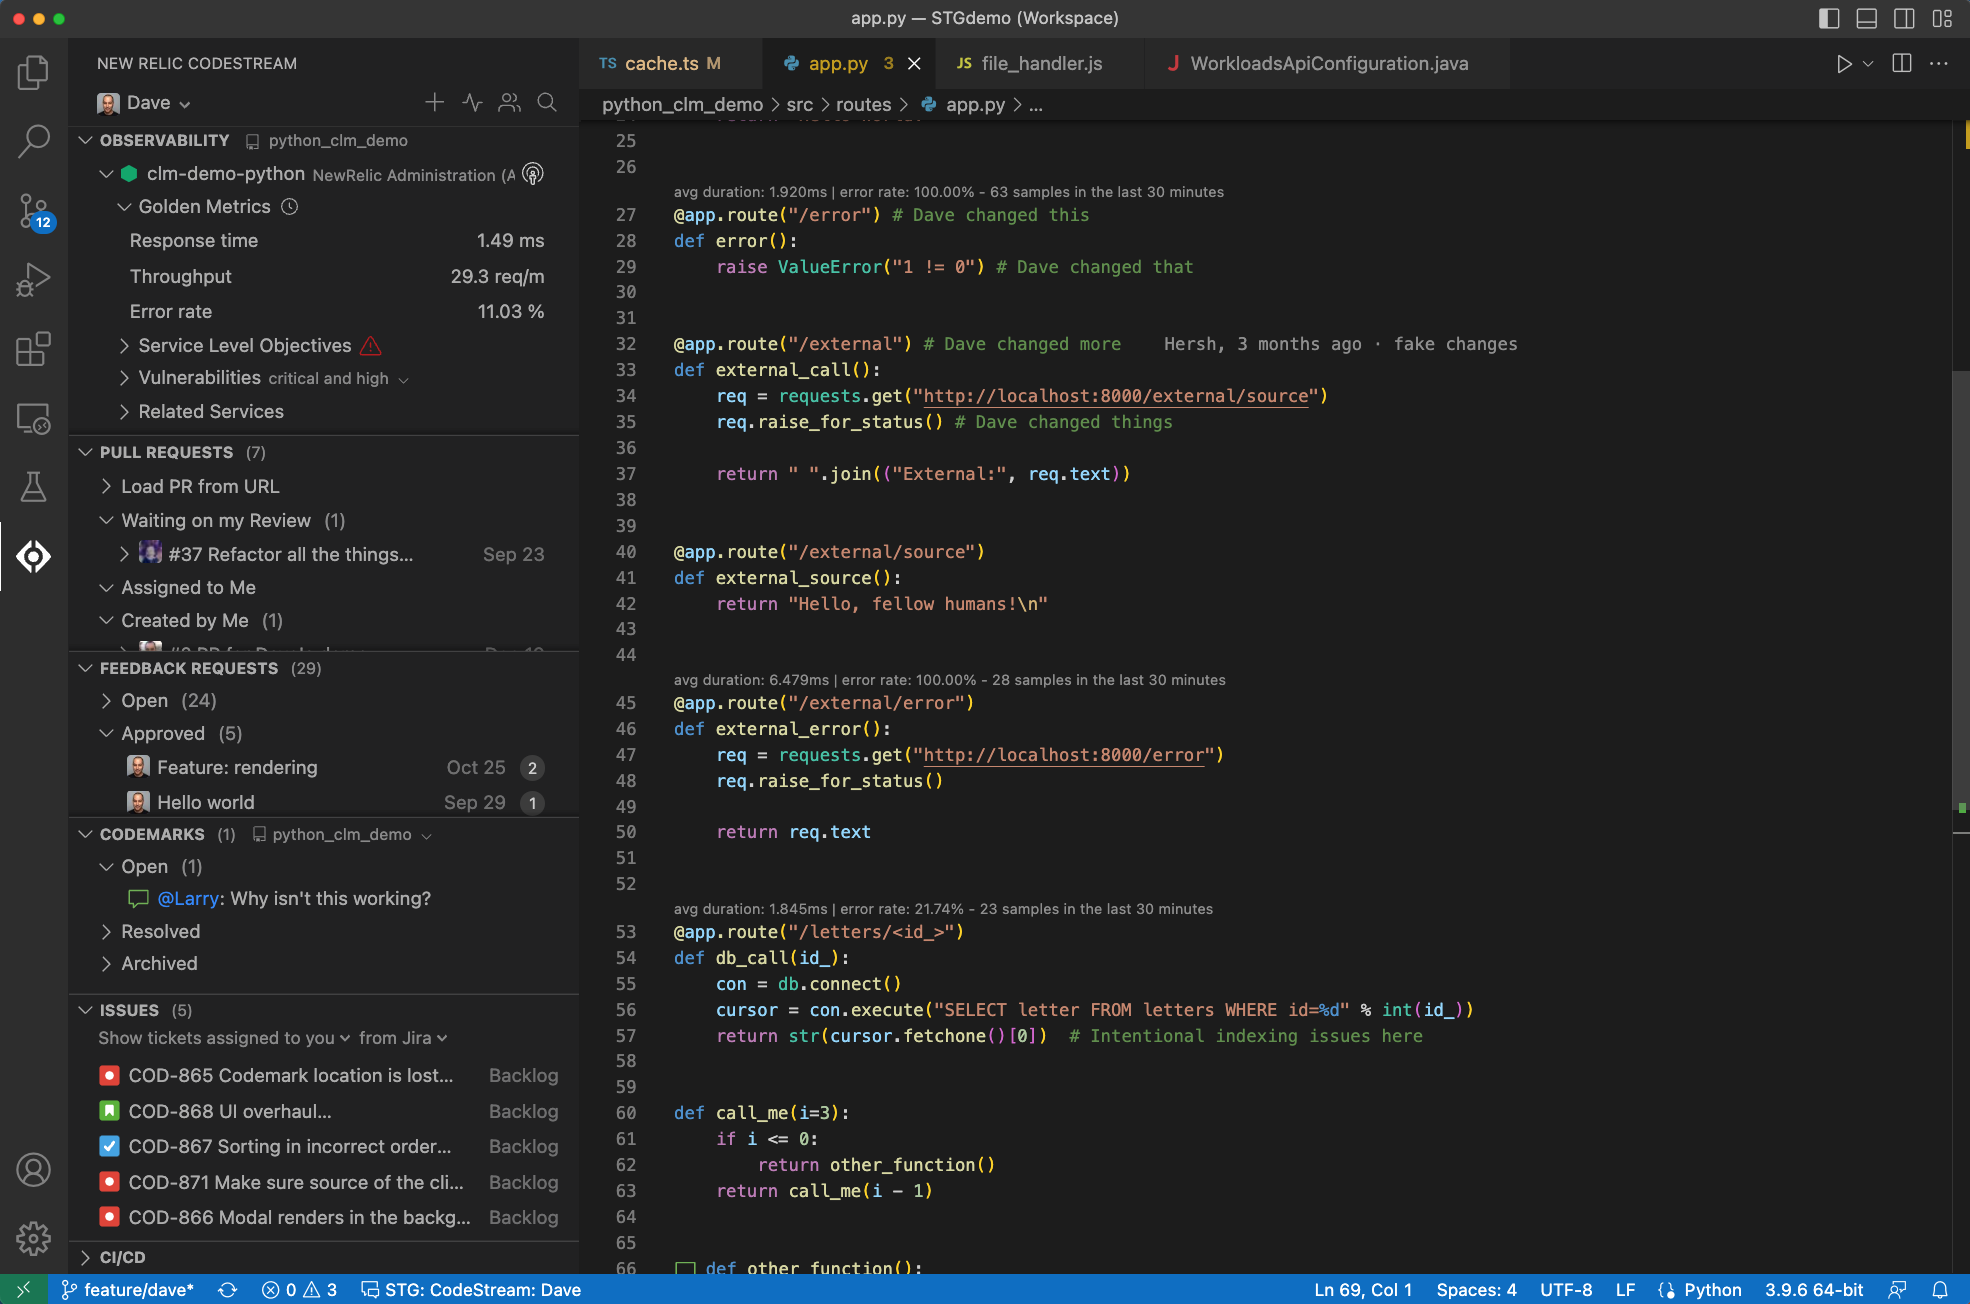
    New Relic today added a free CodeStream module to its observability platform to give developers access to metrics and telemetry data that will enable them to write higher-quality code faster.

    Peter Pezaris, group vice president and general manager of strategy and experience for New Relic, said this capability is part of an effort to shift observability left toward developers to optimize code as it is written and after it is deployed.

    CodeStream surfaces metrics and telemetry data within the integrated development environment (IDE) developers use to write software. Telemetry metrics are displayed as a line of text above the code or in the debugging tool used to troubleshoot an application. Alternatively, developers can view metrics via an observability panel at the service level. They can also view performance metrics such as error rates and response times for related services.

    That approach eliminates the need to wait for IT operations teams to surface issues that usually don’t manifest until long after the code in question was originally developed, noted Pezaris.

    The overall goal is to provide development teams with frictionless access to observability data at every stage of the software development life cycle, he added. That analysis capability will result in faster mean-time-to-detection (MTTD), mean-time-to-resolution (MTTR) and, ultimately, shorter development cycles, said Pezaris.

    Organizations should also be able to reduce technical debt faster by making it easier to identify issues that, for example, adversely impact application performance, he noted. That activity can be especially challenging because developers often inherit code written by someone else that often lacks clear documentation. CodeStream makes it simpler to onboard a developer to any application modernization initiative that has been launched to reduce technical debt, said Pezaris.

    A recent New Relic survey found only 27% of respondents have achieved full-stack observability, and only 5% claimed they have a mature observability practice in place. A third (33%) of respondents also said they still primarily detect outages manually or based on complaints, the survey found.

    On the plus side, the survey also found nearly three-quarters of respondents said C-suite executives in their organization are advocates of observability, and more than three-quarters of respondents (78%) saw observability as a key enabler for achieving core business goals. However, more than half (52%) of respondents said they experienced high-business-impact outages once per week or more, and 29% said they take more than an hour to resolve those outages.

    A full 82% of respondents said they use four or more tools to monitor the health of their systems. Only 7% said their telemetry data is entirely unified and only 13% said the visualization or dashboarding of that data is entirely unified. Nearly half of the respondents (47%) said they would prefer to have a single, consolidated observability platform, but only 2% said they currently used one tool for observability.

    Regardless of the approach to observability, it is clear that development and IT operations teams need to be looking at the same metrics and telemetry data at the same time to collaborate effectively.

  • New Relic Bolsters Observability Platform

    New Relic Bolsters Observability Platform

    New Relic has updated its observability platform to include the ability to better detect and track errors in addition to monitoring vulnerabilities.

    At the same time, an instance of the New Relic observability platform that runs natively on the Microsoft Azure cloud platform is now also generally available.

    Manav Khurana, general manager for observability product and chief growth office for New Relic, said the alliance will enable Microsoft Azure customers to consume New Relic as part of their existing Microsoft Azure services contract.

    New Relic already provides an errors inbox to track issues, but is now adding a tool to track the impact an error might have by correlating data across traces and logs. The company has also integrated its platform with Slack to make it simpler for IT teams to generate alerts when vulnerabilities are introduced into codebases and manage errors more collaboratively.

    Similarly, New Relic is also looking to foster greater collaboration between software engineering and cybersecurity teams. A New Relic Vulnerability Management tool with no additional configuration required captures security signals generated via the company’s Telemetry Data Platform in a way that can be analyzed using an interactive application security testing (IAST) tool that New Relic gained with its acquisition of K2 Cyber Security. Additional IAST capabilities available in preview include the ability to leverage a patented deterministic technique to identify and provide automated vulnerability validation that highlights a proof-of-exploit.

    The overall goal is to provide more visibility and context for organizations that are implementing best DevSecOps practices, said Khurana.

    It’s still relatively early days as far as the integration of observability platforms into DevOps workflows is concerned. A recent survey conducted by New Relic found most organizations don’t expect to have robust observability practices in place by 2025. While most organizations have tools to monitor predefined metrics today, there is a significant gap between observability platforms that enable IT teams to determine the root cause of an IT issue and monitoring platforms that generate an alert whenever a threshold is exceeded.

    In fact, many organizations have too many monitoring tools that often surface conflicting or redundant alerts, noted Khurana.

    One way or another, more codebases are being instrumented. As that process continues to evolve, the agents embedded in that code make it simpler to collect the logs and traces needed to advance observability. The challenge, as always, is that it takes time for the number of fully instrumented applications to exceed the number of legacy applications that are either partially instrumented or not instrumented at all.

    As IT environments become more complex, the need for observability is becoming much more pressing at a time when most IT teams are more short-handed than ever, noted Khurana.

    Regardless of approach, there’s no doubt that observability, with patience, will impact the management of IT for the better.

  • New Relic Extends Observability Reach to More DevOps Platforms

    New Relic Extends Observability Reach to More DevOps Platforms

    New Relic today expanded its ecosystem by adding integrations between its observability platform and a wide variety of DevOps and cybersecurity tools. The New Relic observability platform now integrates with offerings from Atlassian, Amazon Web Services (AWS), CircleCI, Confluent, GitHub, JFrog, Lacework and Snyk and the open source Jenkins continuous integration/continuous delivery (CI/CD) platform.

    Peter Pezaris, senior vice president for strategy and experience at New Relic, said the goal is to make it simple to share analytics based on telemetry data collected from IT operations environments with the tools organizations rely on to build and deploy applications.

    In total, there are now more than 500 integrations with the New Relic observability platform, he noted.

    Only 27% of respondents to a recent New Relic survey reported that they have achieved full-stack observability and only 5% claimed they have a mature observability practice in place. A third (33%) of respondents also said they still primarily detect outages manually or based on complaints from end users. More than half (52%) of respondents said they experienced high-business-impact outages once per week or more and 29% said they take more than an hour to resolve those outages.

    On the plus side, nearly three-quarters (72%) of respondents expected to maintain or increase their observability budgets next year, with more than half (52%) expecting observability budgets to increase over the next year.

    Observability, in one form or another, has always been a tenet of any DevOps practice. For the most part, the best that could be achieved until recently was continuous monitoring of a set of pre-defined metrics. With the arrival of observability platforms, it’s becoming much simpler to not only monitor metrics but also launch queries that surface issues long before an IT service can be disrupted.

    An observability platform achieves that goal by making it possible to query logs, metrics and distributed traces in a way that surfaces patterns that have not been pre-defined. In effect, an observability platform makes it simpler to debug application environments where the number of dependencies that exist between services are becoming too complex to track or decipher manually.

    Of course, those applications will need to be instrumented using agent software capable of generating the data observability platforms require. Fortunately, open source projects such as OpenTelemetry are helping to drive down the total cost of instrumentation by making agent software more accessible to a wider range of application developers.

    It’s not clear how quickly IT teams will be embracing observability platforms, but there is now a clear opportunity to narrow the divide between IT operations teams and application developers, noted Pezaris. As each DevOps platform makes it easier to collect data via application programming interfaces (APIs), richer telemetry data can be collected, he added.

    In the meantime, as application environments continue to become more complex in the cloud-native era, most DevOps teams will need additional tools. Existing legacy monitoring tools don’t make it easy to discover, for example, which microservice might be adversely impacting the overall performance of an application because calls are being rerouted. The frustrating thing, as always, is that it can take days or weeks to pinpoint an issue that might take only a few minutes to fix.

  • New Relic Reports Major Spike in Volume of Log Data

    New Relic Reports Major Spike in Volume of Log Data

    New Relic today shared a report based on anonymized data it collects that showed a 35% increase in the volume of logging data collected by its observability platform.

    The report also identified logs generated by NGINX proxy software (38%) as being the most common type of log, followed by Syslog (25%) and Amazon Load Balancer (20%).

    In addition, Fluent Bit is the most commonly used open source processor and forwarder tool (38%) among IT teams that have adopted the New Relic platform. Another 16% are using New Relic infrastructure agent, followed by 14% that send log data directly to New Relic via an HTTP endpoint.

    The report also found 50% of all logs ingested by language agents come from Java applications, followed by .Net (26%), Ruby (22%) and Node.js (2%).

    Jemiah Sius, director of developer relations at New Relic, said as more cloud-native applications are deployed, the volume of log data that is collected is only going to increase as open source OpenTelemetry tools are more widely adopted. In addition, IT teams will also be collecting metrics, traces and events to better pinpoint the root cause of issues using observability platforms such as New Relic One, he added.

    Amazon Web Services (AWS) is now, of course, one of the biggest sources of log data. The New Relic report noted that the serverless AWS Lambda service is the most widely employed source of log data among AWS customers that employ the New Relic One platform. However, use of the AWS Firehose service for extracting, transforming and loading (ETL) data has grown sharply in the last year, noted Sius.

    The New Relic report found while only 32% of New Relic accounts that use AWS have adopted Firehose, there has been a 62% increase in adoption year-over-year.

    Log data is usually the first thing any IT team consults whenever there is an issue, but as the volume of log data increases it’s becoming more difficult to associate log data with specific IT events. The issue that each IT team will have to come to terms with is how much log data to store alongside metrics, traces and other data formats to help them proactively identify the root cause of an IT issue.

    Observability platforms, in the meantime, promise to make it possible to query that log data to identify relationships between events. The goal is to enable IT teams to investigate issues before they can disrupt IT services rather than merely reacting to events after they have unfolded, said Sius.

    The hope, of course, is that machine learning algorithms will soon automatically identify issues before most IT teams even know there is a problem. Given the overall complexity of modern IT environments, it’s unlikely most IT teams even know what queries to launch to identify the root cause of an issue. Instead, as machine learning algorithms become more familiar with what constitutes normal IT events, it will become simpler for those algorithms to surface the issues that are actually worth IT’s attention.