Tag: New Relic

  • New Relic Adds Support for Model Context Protocol to Observability Platform

    New Relic Adds Support for Model Context Protocol to Observability Platform

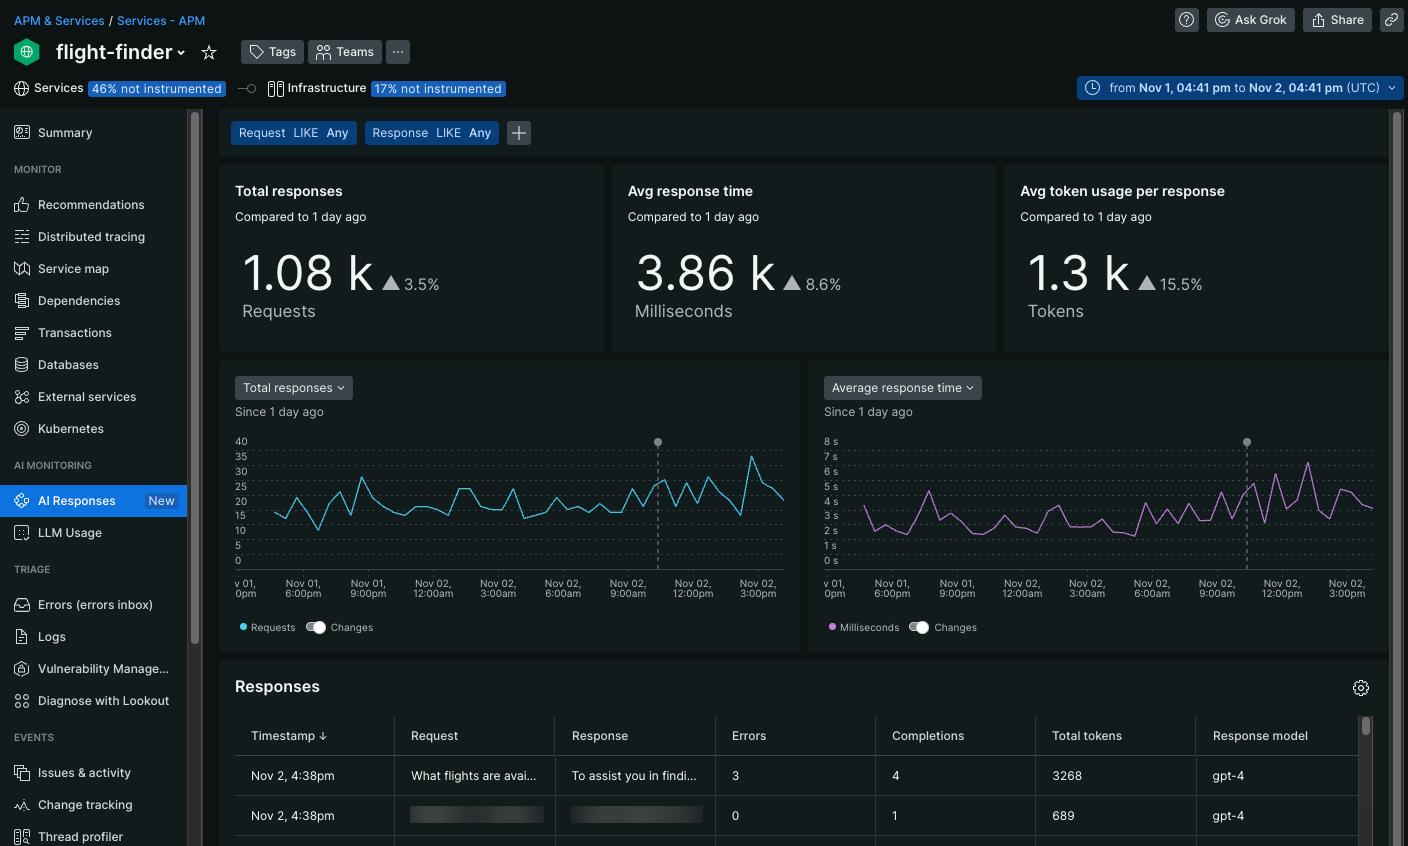
    New Relic this week added support for the Model Context Protocol (MCP) to its observability platform to surface insights into artificial intelligence (AI) agents and applications.

    Originally developed by Anthropic, MCP is rapidly becoming a de facto application programming interface (API) for enabling interoperability between AI agents and other sources of data.

    New Relic has now incorporated MCP with its application performance monitoring to surface insights into AI agents and applications alongside its ability to monitor and observe legacy applications.

    Previously, New Relic had added an ability to observe large language models (LLMs), but via MCP it’s now able to extend the reach of that capability to AI agents and applications that access those LLMs. That capability makes it possible to visualize specific usage and patterns of the entire lifecycle of an MCP request, including invoked tools, call sequences and execution durations.

    Additionally, DevOps teams can identify which prompts are being invoked and what choices were made by an AI agent along with surfacing latency, errors and other MCP performance issues.

    New Relic AI Monitoring MCP support is now available in Python Agent version 10.13.0, with additional languages coming soon.

    In general, New Relic reports it has seen a steady 30% growth in usage of its AI monitoring tools quarter-over-quarter for the past year. The company has also seen a 92% increase in the number of unique AI models being used. However, the ChatGPT models provided by OpenAI accounted for 86% of all the LLM tokens being generated.

    Nic Benders, chief technical strategist for New Relic, said that level of activity suggests that OpenAI is well on its way to becoming a de facto standard, even as the number of AI models being made available continues to rapidly increase.

    It’s not immediately clear why one LLM might be preferred over another but OpenAI, in addition to making a steady stream of investments, has successfully generated a significant amount of brand recognition. That helps make OpenAI one of the first platforms that most organizations are going to look to when building an AI application, said Benders.

    However, there are use cases, such as coding, that lend themselves, for the moment at least, better to coding, he added.

    Less clear is the degree to which the various AI models that are available will gain enough traction to warrant the ongoing level of investment required to sustain them. IT teams should carefully consider what foundations they want to build and deploy AI applications on for the long term, noted Benders.

    Additionally, not every AI application requires the latest, and most expensive, LLM, said Benders. The cost of previous generations of AI models has declined considerably as more advanced models have become available. Many applications, however, may not require access to a more advanced model, especially when a previous generation will enable a developer to automate a task at a much lower cost.

    Ultimately, observability platforms will play a critical role in enabling organizations to track which AI models are being used for which use cases. The challenge now is understanding not only which ones are gaining traction among application developers, but just as importantly, the symbiotic relationship that exists between AI models and the IT infrastructure upon which they depend.

  • New Relic Integrates AI Agents with Copilot Coding Agent from GitHub

    New Relic Integrates AI Agents with Copilot Coding Agent from GitHub

    New Relic this week made available a preview of an integration with the artificial intelligence (AI) agents it created for its observability platform with the AI agents that GitHub has developed.

    Nic Benders, chief technical strategist for New Relic, said AI agents that the company has developed will now be able to create an issue that GitHub Copilot will be able to use to improve an application. GitHub Copilot will analyze the issue, draft a fix, and submit a draft pull request for human review. The New Relic platform will then validate the change once it is merged.

    In effect, the New Relic and GitHub agents are creating a virtuous cycle to address incidents and performance as they arise, said Benders.

    Just as importantly, the New Relic agents are creating issues in a semi-structured format that is human readable, so DevOps teams will have the option of either assigning that task to a human developer or GitHub Copilot, he added.

    New Relic is making this capability initially available to eligible accounts that are also Copilot Pro+ or Copilot Enterprise users. Launched at the Microsoft Build 2025 conference, the GitHub Copilot coding agent is currently available as a preview to GitHub Copilot Enterprise customers and GitHub Copilot Pro+ users.

    While DevOps teams are making greater use of AI tools, it might be a few years yet before they are fully mastered, noted Benders. Using AI tools to generate code is one thing but integrating AI agents into DevOps workflows is a more complex endeavor, he noted.

    Nevertheless, a recent Futurum Group survey finds 41% of respondents expect AI tools and platforms will be used to generate, review and test code, while 39% plan to make use of AI models based on machine learning algorithms. The challenge now is identifying the specific tasks that might best be handled by an AI agent to reduce the overall amount of toil that goes into software engineering, said Benders.

    Ultimately, AI agents will also make DevOps teams less dependent on a confusing set of observability dashboards as AI agents begin to proactively discover issues, hopefully, before they have any significant adverse impact on application environments.

    Each organization will need to determine for themselves the degree to which they are comfortable relying on AI to build and deploy applications, but at this point, it’s more a question of how much rather than if. There are clearly productivity gains to be had so long as the work of AI agents remains closely supervised by DevOps engineers that have the expertise required to ensure that application quality is maintained and enhanced.

    In the meantime, DevOps teams should be aggressively experimenting with AI tools and platforms, said Benders. Like most powerful tools, it requires knowledge and expertise to get the most out of AI that only comes with hands-on experience, he added.

    After all, the DevOps goal has always been to automate as many tasks and workflows as possible. AI agents are only the latest in a long series of tools and platforms that enable DevOps teams to achieve that goal.

  • New Relic Streamlines Observability Data Management

    New Relic Streamlines Observability Data Management

    New Relic this week made available a live archives capability that provides instant access to historical logs for up to seven years and eliminates the need to rehydrate, reload, re-index or move data.

    At the same time, the company also announced its observability platform is now integrated with infrastructure and observability tools provided by Sentry Software to help IT teams reduce costs and collect additional sustainability metrics alongside logs, metrics and traces.

    Jemiah Sius, senior director of developer relations for New Relic, said overall, New Relic is moving to make it simple to analyze and store telemetry data regardless of when it was collected. For example, rather than requiring historical data to be accessed via a cold storage service in the cloud, the New Relic platform now makes that data available directly within the database that is at the core of its observability platform.

    That approach also provides the added benefit of not incurring ingress and egress fees for moving data in and out of cloud storage services, noted Sius.

    IT teams can simply create a New Relic Query Language (NRQL) to identify which logs to route to a live archive in as little as 30 seconds without having to add an additional log collector.

    The overall goal is to make it simpler to investigate incidents faster, given the urgency that is created whenever there is an outage or audit request that needs to be immediately addressed, noted Sius. That’s critical because DevOps teams are always for time, he added.

    In general, New Relic is reducing the overall toil associated that many DevOps teams encounter today when managing telemetry data. Rather than being confronted with a complex set of data engineering tasks, telemetry data from multiple applications and infrastructure platforms can automatically be collected, analyzed and stored.

    It’s still early days as far as the adoption of observability platforms is concerned, but there is already no shortage of options. The challenge is that in addition to logs, metrics and traces, IT teams are now starting to also track cost and energy consumption metrics. Observability platforms provide the means to centralize telemetry data that is only going to increase in volume as more applications are deployed. The challenge has been framing the queries needed to surface meaningful insights. Fortunately, with the rise of generative artificial intelligence (AI) tools that make it simpler to create queries, the overall level of skill required to invoke an observability platform is dropping. In effect, generative AI is making it possible to democratize DevOps best practices.

    Ultimately, existing DevOps teams should be able to manage highly distributed application environments without having to hire and retain a small army of additional software engineers. The issue is that, in many cases, the size of the overall code base is increasing rapidly as developers take advantage of various generative AI tools to help them write code faster. Hopefully, advances in AI will arrive soon enough to enable DevOps teams to cope with all that code before DevOps teams are inevitably overwhelmed.

  • New Relic Adds Ability to Correlate IT Events to Business Processes

    New Relic Adds Ability to Correlate IT Events to Business Processes

    New Relic this week added an ability to enable DevOps teams to better understand the potential business impact any change to an IT environment might have.

    Manav Khurana, chief product officer for New Relic, said New Relic Pathpoint adds a dashboard to the company’s observability platform through which business metrics can be collected alongside telemetry data. That data is collected either via connectors provided by New Relic or via a metrics application programming interface (API) that IT teams can invoke.

    IT teams can use that API to connect to custom applications or an end-to-end business process, noted Khurana.

    All that data is then modeled alongside DevOps telemetry data to provide insights into the impact any change might have on the business in real-time, he added. That approach provides the added benefit of making it easier to strategically align the management of applications, services and infrastructure by business function, noted Khurana.

    In the near future, New Relic will also extend the natural language capabilities it is currently previewing to New Relic Pathpoint, he said.

    Longer term, New Relic is working toward making it possible to model how proposed changes to business processes will impact IT environments, added Khurana.

    Business and IT leaders intuitively understand that every business event creates a corresponding IT event, but most organizations manage those processes in isolation. New Relic Pathpoint presents an opportunity to close a divide between IT teams and the rest of the business that has plagued organizations for decades.

    It may be a while before advances in data analytics and AI eliminate that divide completely, but creating a common set of metrics for managing business and IT processes is a crucial first step.

    In the meantime, DevOps teams, in addition to accelerating the pace at which applications can be built and deployed, are being asked to employ observability platforms such as New Relic One to minimize disruption to the business. Observability has always been a core DevOps tenet, but achieving and maintaining it is challenging. Most DevOps teams today aspire to be able to maintain some level of continuous monitoring. However, as it becomes easier and less costly to instrument applications using open source agent software, interest is rising in observability platforms that simplify the investigation of anomalies indicative of an issue that could disrupt an application environment. As that shift occurs, more organizations will seek to correlate IT and business events.

    It’s still early days as far as the adoption of observability platforms is concerned, but it’s apparent that as application environments become more complex, the plethora of monitoring tools that DevOps teams rely on will need to be streamlined. It’s not uncommon for DevOps teams to have multiple monitoring tools that surface a set of predefined but often conflicting metrics. Observability platforms, however, unify logs, metrics and traces in a way that makes it simpler to launch queries to identify the root cause of an issue, hopefully before any catastrophic disruption can occur.

  • Three Strategies for Reducing MTTD and MTTR as Outage Costs Spiral

    Three Strategies for Reducing MTTD and MTTR as Outage Costs Spiral

    According to a New Relic survey of IT professionals, the median annual cost of IT outages has reached an astronomical $7.75 million. Over one-third of the 1,700 respondents said critical business application outages now cost more than $500,000 per hour. In a business environment where most interactions with customers, suppliers and business partners are conducted digitally, downtime has become a problem and an existential threat.

    Most IT organizations carefully monitor two key metrics — mean time to detection (MTTD) and mean time to resolution (MTTR) — to track their success in identifying and remediating critical systems issues. The figures represent, respectively, the average time it takes administrators to identify that a problem has occurred and to remediate the underlying issues. They serve as a benchmark for understanding the organization’s level of awareness of the status of its systems and the speed with which problems can be diagnosed and acted upon.

    There are many ways to improve performance against these metrics, but three stand out as the most effective, as evidenced by New Relic and the survey results.

    Monitor Everything

    The less you know about a problem, the longer it takes to diagnose and fix. The New Relic survey measured 17 different observability categories, such as network monitoring, alerts, log management, browser monitoring and distributed tracing. Across the board, about two-thirds of the companies that used even one of those monitoring tools reported reduced MTTR, with many saying resolution times had fallen by more than 25%.

    One-third of respondents whose organizations implemented full-stack observability—which is the ability to see everything in the tech stack that could affect the customer experience—reported the fewest outages, fastest MTTD and MTTR, lowest outage costs and highest median annual return on investment compared to all respondents. For example, those who have full-stack observability experience a median outage cost that is 37% less than those without.

    As the complexity of enterprise technology stacks increases, so does the difficulty of pinpointing the root cause of an outage. Any monitoring is better than no monitoring at all, and the more visibility you have into applications and infrastructure the faster you can identify and resolve incidents. Strive for full-stack observability around integrated observability data and a comprehensive dashboard.

    Have an Incident Management Action Plan

    The worst time to figure out how to resolve a problem is when you’re in the midst of a crisis. Organizations with mature observability practices also have extensive and documented response plans.

    Your incident plan will be unique to your organization. Small companies and startups tend to have ad hoc response strategies based on the skills within the organization. Large enterprises may use a more formal methodology like IT service management that defines strict procedures and protocols. Companies that have embraced modern DevOps and Lean principles often use a hybrid approach that depends heavily on teamwork and collaborative problem-solving. All of these approaches can work if the team fully understands the chosen strategy.

    Document your IT architecture, identifying known vulnerabilities and outlining procedures for responding to the most common types of incidents. Plans should cover obvious disruptions like fires and power outages, but you should also think about “unicorn” scenarios such as a rogue query that ties up a database server or a communication outage at a key supplier. Mature observability teams devote a portion of their resources to constantly testing new and unpredictable scenarios and use chaos engineering to randomly inject problems in a controlled manner to see if systems respond as expected.

    As you develop incident response procedures, document the processes in runbooks, which tell responders exactly what to do when a specific problem occurs. This not only creates a database of organizational knowledge about response strategies but also helps with onboarding new employees and covers for skills gaps that occur when team members are unavailable or leave the company.

    Fix for the Future

    Technical debt is a long-term obligation that is created when a short-term – and incomplete – solution is applied. You should aim to minimize it in your observability operation.

    When a problem occurs, the temptation is to fix it as quickly as possible. Human nature is to move on to the next task without taking the time to go back and understand why a problem occurred. “Quick and dirty” fixes are an invitation to larger problems in the future. Your observability plan should include a forensics stage that documents root causes and the fixes that were applied. Even if it isn’t convenient to implement a long-term solution immediately, the documentation serves as a guide for implementing a permanent fix down the road.

    Building a resilient IT architecture is a marathon, not a sprint. The more rigor you apply to identifying and resolving problems when they happen, the better prepared you will be to prevent their reoccurrence and the more informed your team will be about the resources they manage. Reducing your MTTD and MTTR will not only improve the bottom line of your business, it will ensure that your customers have an amazing digital experience.