Tag: logs

  • Era Software Adds SaaS Edition of Log Management Platform

    Era Software Adds SaaS Edition of Log Management Platform

    Era Software has unfurled a software-as-a-service (SaaS) edition of its platform for collecting and managing log data that is based on a time-series database it built.

    At the same time, the company has revamped the user interface of the underlying EraSearch log management platform that IT teams can deploy themselves to make it simpler to troubleshoot IT issues.

    Stela Udovicic, senior vice president of marketing for Era Software, said the EraCloud edition of the log management platform provides a more accessible way to access a log management platform based on an object storage system that can handle any type of log data.

    There’s also an indexing engine based on machine learning algorithms that enables the platform to scale better than rival platforms, she noted.

    Available via the Amazon Web Services (AWS) marketplace, EraCloud collects, indexes and analyzes log data from cloud applications, Kubernetes and IT infrastructure platforms to provide a centralized means of collecting data at a lower cost. In addition to being able to continuously monitor billing costs, an EraSearch cluster can now be provisioned in minutes.

    Era Software, previously known as EraDB, earlier this year raised an additional $15.25 million in financing to drive development of a log management platform that provides an alternative to open source platforms, such as Elasticsearch, that don’t scale as well. The result is a higher total cost as the volume of log data that is less efficiently managed via Elasticsearch steadily compounds. As part of that effort, the company also supports a subset of the Elasticsearch application programming interface (API) to facilitate transitioning from Elasticsearch.

    Many organizations today already have terabytes of log data they are trying to manage and store, noted Udovicic.

    It’s not quite clear how many IT organizations are considering alternatives to log management platforms. However, as the amount of log data that IT teams want to be able to store over a longer amount of time increases—in part to facilitate greater observability—the pressure to contain the cost of retaining all the data is also rising.

    Observability, in general, requires combing logs, metrics and traces—a specialized form of logging—in a way that makes it easier to identify the root cause of an issue by querying data. It differs from monitoring in that observability is achieved using a predefined set of metrics that track whether a platform or application is performing within expectations.

    It may be a while before most IT teams generally achieve observability, but the journey typically starts with finding a more efficient way to collect log data in both proprietary and open source formats. Rather than having to normalize all that data, Era Software is making a case for analyzing that data in whatever format it happens to be available.

    One way or another, a much larger percentage of the applications deployed by IT teams in production environments will have to be instrumented to achieve observability. The issue now is determining how best to make all the data collected from those applications available to DevOps teams at a reasonable cost.

  • Grafana Labs Expands into Incident Management Realm

    Grafana Labs Expands into Incident Management Realm

    During its online ObservabilityCON 2021 conference, Grafana Labs this week previewed an incident management platform in addition to making available an on-premises edition of its distributed tracing tool.

    Tom Wilkie, vice president of product for Grafana Labs, said the Grafana OnCall incident management platform is a natural extension of the observability tools the company already provides using the widely employed open source Grafana dashboard. The platform, which is expected to be generally available in 2022, is based on software Grafana Labs gained by acquiring Amixr earlier this year.

    Grafana OnCall unifies all the alerts created by Grafana, Prometheus and the Alertmanager tool the Prometheus community created to streamline the number of alerts generated by the platform. The goal is to reduce the alert fatigue a DevOps team might experience when dealing with an IT issue that can be traced back to a single root cause, noted Wilkie.

    Grafana

    At the same time, Grafana Labs made Grafana Enterprise Traces available for on-premises IT environments. It is based on Grafana Tempo, a cloud service that makes it possible to store and then analyze distributed traces using inexpensive object storage resources. The latest version of the core open source Tempo project has also been updated to add service graphs and the ability to search recent traces.

    Grafana Labs this week also updated Loki, an open source log management platform, to add support for out-of-order log lines, custom log retention policies per log stream and per tenant and a deletion API that makes it easy to scrub log data. Version 2.4 of Loki also adds additional high-availability capabilities.

    Other updates to the Grafana Labs platform include support for recorded queries, a set of pre-built dashboards that enable users to quickly drill into their Prometheus metrics data, the ability to consume metrics from the AWS CloudWatch service provided by Amazon Web Services (AWS), improvements to its ability to monitor Kubernetes clusters and updates to the open source load testing tool the company gained by acquiring k6 last year.

    Grafana Labs is also committing to expanding its integration with Microsoft Azure cloud service alongside its integrations with AWS, noted Wilkie.

    While competition among providers of observability platforms is already fierce, Wilkie said an observability platform based on an open source dashboard that can already collect data from more than 100 sources provides a unique advantage. At the core of the Grafana Labs platform is a centralized framework for collecting data generated primarily by the open source Prometheus monitoring platform being developed under the auspices of the Cloud Native Computing Foundation (CNCF).

    While Prometheus is used most often in Kubernetes environments, it is starting to gain traction in monolithic application environments as well; it provides an open source approach to defining a de facto standard for collecting metrics and other data that can be consumed by an observability platform.

    It’s not clear yet to what degree IT teams are distinguishing between monitoring and observability. Monitoring focuses on predefined metrics to identify when a specific platform or application is performing within expectations. Observability combines metrics, logs and traces to instrument applications in a way that makes it simpler to troubleshoot issues without relying solely on a limited set of metrics that are pre-defined and monitor a specific process or function.

    Regardless of whether IT teams view observability as being distinct from monitoring, it’s clear that the ability to manage IT environments is improving at a rapid rate. The challenge, of course, is the IT environment itself is becoming more complex with each passing day.

  • Observability Vs. Monitoring: What’s the Difference?

    Observability Vs. Monitoring: What’s the Difference?

    As more and more IT organizations pivot from strategies rooted in monitoring to ones that aim to achieve observability, one of the first questions that teams need to answer is, “What is the difference between the two?”

    That’s a somewhat loaded question because there are some differences of opinion out there regarding what, exactly, distinguishes monitoring from observability. But in general, the differences can be distilled into two main points, as we will explain.

    What is Observability and What is Monitoring?

    The first step in understanding the difference is to understand what each term means on its own.

    The classic definition of observability is that it is the use of external data outputs to understand the internal state of a system. In the IT industry specifically, observability could be defined as the use of logs, metrics and distributed traces to understand the state of a complex software system.

    Meanwhile, monitoring is the process by which data is collected from a system. In IT, monitoring is how teams collect logs, metrics and traces and move them to a place where they can be analyzed.

    Similarities

    There are some obvious similarities between the two. Both involve (at least in part) the collection of diverse sets of data. Both also serve the goal of helping teams identify problems within their software stacks and deliver a high-quality user experience.

    Two Key Differences

    But the similarities end there. Ultimately, monitoring and observability are distinct concepts and processes, with two main differences that distinguish them from each other.

    Monitoring collects data. Observability interprets it.

    The first is that observability focuses on interpreting and understanding data, whereas monitoring is merely the collection of data.

    In this sense, you can think of monitoring as one of the processes that makes observability possible. But observability requires more than monitoring. In addition to collecting data, observability also involves the correlation of data from multiple sources and the identification of relevant patterns or anomalies within that data.

    Monitoring Tells you What is Wrong. Observability Tells you Why it’s Wrong

    The second main difference is that monitoring simply alerts you when something goes wrong. Observability goes further by helping you understand why it’s wrong and how to fix it.

    For example, a monitoring tool might tell you that your application’s response rate is no longer adequate. But you need observability to figure out which specific microservices within the application are causing the problem. Using that information, you can plan and execute an effective response to reliability issues using an incident management platform.

    With monitoring alone, you only know that something is broken, not how to fix it.

    Observability and Monitoring: Better Together

    Although it’s common to speak in terms of “observability versus monitoring,” the reality is that you can’t have observability without monitoring. (You could monitor without observing, but doing so would significantly reduce your ability to understand and resolve problems quickly.)

    So, don’t think of it as an either/or proposition. Think of them as concepts and practices that go hand-in-hand, even if they perform different functions.

  • Sumo Logic Extends Observability Scope and Reach

    Sumo Logic Extends Observability Scope and Reach

    During the online Illuminate user conference, Sumo Logic revealed how it is integrating capabilities it gained with the June 2021 acquisition of Sensu, a provider of open source monitoring tools, with its continuous intelligence platform in addition to adding support for data collected via open source OpenTelemetry software.

    Sensu Go, a set of tools for implementing monitoring-as-code, is now a core part of the Continuous Intelligence Platform. The company is also now making available in beta Sumo Logic OpenTelemetry Distro and Ecosystem Support, a single agent through which all logs, metrics and traces can be collected from instrumented applications. Sumo Logic is also supports the AWS OpenTelemetry Distro, an offering from AWS that provides similar capabilities. Sumo Logic has also increased the capabilities of Sumo Logic Free to include monitoring-as-code tools created Sensu.

    Bruno Kurtic, vice president of product and strategy, said as responsibility for managing applications shifts left toward developers it’s critical to provide observability capabilities that can be programmatically infused into applications. As part of that effort, Sumo Logic is now also offering Sensu Plus, which provides access to an analytics engine for the data the platform collects.

    Sumo Logic is also adding machine learning algorithms to provide more context to the alerts the platform generated via an Alert Response feature that is part of the core platform.

    The company is also adding support for the operator software that Red Hat created to make it simple to deploy Sumo Logic Continuous Intelligence Platform alongside the Red Hat OpenShift platform for building and deploying applications on top of Kubernetes clusters. In addition, Sumo Logic is also providing integration with a total of 38 either new or updated observability applications that integrate with a wide range of third-party platforms.

    Finally, Sumo Logic is extending the security observability platform it provides based on its platform to add support for containers and serverless computing functions alongside virtual machines and integrations with third-party endpoint detection and response (EDR), network detection and response (NDR), threat intelligence and managed detection and response (MDR) platforms. The company has also added or updated 26 applications for specific third-party platforms.

    Kurtic said Sumo Logic makes it possible for developers and IT operations teams alike to observe an IT environment on an end-to-end basis via a single pane of glass. In some cases, the members of an IT operations team will require a user interface to manage that environment. Developers, meanwhile, might prefer an application programming interface (API) through which observability data is made accessible from within a continuous integration/continuous delivery (CI/CD) platform.

    Regardless of the type of user, however, IT teams should not have to hire their own data science team to analyze observability data. Instead, the observability platform should embed machine learning algorithms that surface all the benefits of data science without the need to hire additional headcount, he said.

    One way or another, DevOps teams will soon routinely benefit from the additional levels of context that observability platforms provide. The challenge will then be determining how best to fix a raft of issues that many DevOps teams today simply didn’t know existed.

  • LogDNA Previews Streaming Module for Observability Platform

    LogDNA Previews Streaming Module for Observability Platform

    LogDNA is making available on a limited basis the ability to process streaming data to its observability platform as part of an effort to give DevOps teams more control over log data.

    Tucker Callaway, LogDNA CEO, said the data ingestion pipeline that LogDNA already provides can ingest, parse and normalize massive amounts of structured and unstructured log data. LogDNA Streaming adds the ability to automatically send log data to any application or analysis tool.

    That capability also helps reduce storage costs by limiting the number of copies of log data that might otherwise be created, he added.

    LogDNA also expects that DevOps teams will also be able to analyze data in flight as part of an effort to make it simpler to surface issues even before log data is stored, noted Callaway.

    While there are multiple streaming data platforms available, Callaway said LogDNA opted to build one on its own to meet the requirements of an observability platform. Ultimately, the goal is to shift observability left at the data level to provide more granular insights in real-time, he said.

    That capability will also lay the foundation for a wide range of autonomous processes that would be driven by the observability data collected via LogDNA, added Callaway.

    LogDNA

    Observability has always been a core tenet of any DevOps best practice. Most DevOps teams typically focus on some form of continuous monitoring to more proactively manage application environments. However, it can still take days, sometimes weeks, to discover the root cause of an issue. Monitoring tools are designed to consume predefined metrics to identify when a specific platform or application is performing within expectations. The metrics tracked generally focus on, for example, resource utilization.

    Observability combines metrics, logs and traces—a specialized form of logging—to instrument applications in a way that makes it simpler to troubleshot issues without having to rely solely on a limited set of metrics that have been pre-defined to monitor a specific process or function. DevOps teams can more easily employ queries to interrogate data in a way that makes it easier to discover the root cause of an issue. An observability platform correlates events in a way that makes it easier for analytics tools to identify anomalous behavior indicative of an IT issue.

    It’s now only a matter of time before providers of the platform widely employ machine learning algorithms to analyze machine data faster. There may even come a day when so-called “war room” meetings—that today need to be convened to identify the cause of an IT issue via a painstaking process of elimination—are no longer required.

    In the meantime, the percentage of applications that are instrumented in an IT environment needs to increase to achieve that goal. Fortunately, thanks to the rise of open source agent software, the cost of instrumenting applications is starting to decline. At the same time, DevOps teams should expect to see a marked increase in the volumes of incoming data, and they will need to find somewhere to store that data as well as determine the length of time it should be retained.

  • Visualize Logs to Get More Value from Data

    Visualize Logs to Get More Value from Data

    Why do you keep logs? Regardless of the type of logs we’re talking about, you keep them because you expect them to provide some value for the organization. Maybe the logs will help you improve profitability; perhaps they will help you recover from downtime or perhaps they are expected to alert you to a security incident in progress. If you’re a system administrator or someone tasked with infrastructure reliability and maintenance, you’d agree that logs are critical. They represent the source of truth you go to for information about your server status and activity, website traffic, application performance and much more.

    No matter the intended purpose of logs or how you use them, the information in these logs should be easy to access and interpret. Today’s complex systems generate enormous amounts of log data, making it almost impossible to dig through tons of data in raw text files to find important information. Finding valuable information is immensely difficult in text logs but not in the visual world. This is precisely where log visualization comes into play. What if the data in your logs could transform into graphic shapes and patterns? Wouldn’t it be much easier and faster to decipher information from log data and understand it better?

    What are Logs, and What are They Used For?

    Before going any further, let’s make sure everyone is on the same page about the meaning of logs. A log is a textual, timestamped record that tells us what happened and when. DevOps engineers have to rely on a combination of logs from various system components and data sources to understand why an event occurred, and perhaps even predict future events.
    logs value unknown


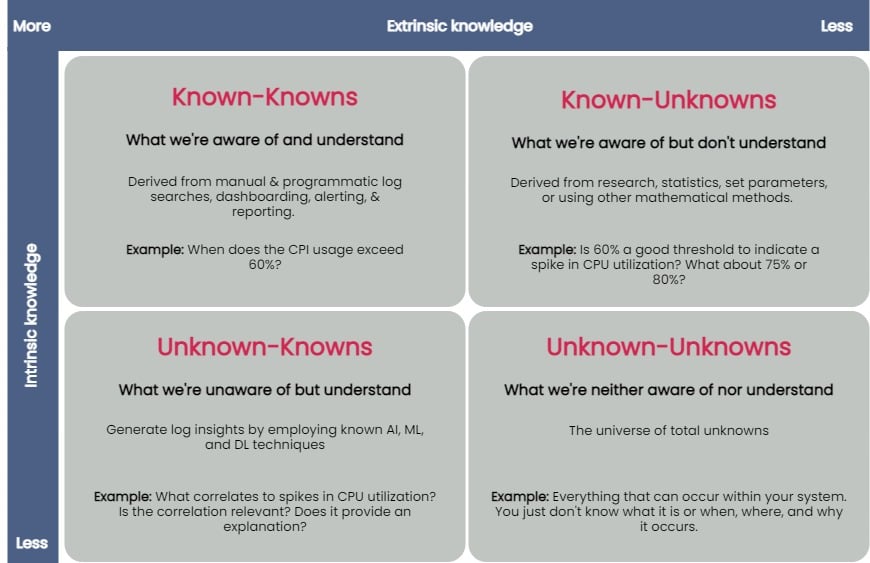
    You can taxonomize knowledge extracted from log data into four key groups: known-knowns, known-unknowns, unknown-knowns and unknown-unknowns. Manual and programmatic log searches, dashboarding, alerting and reporting manually extracted log fields are common ways to extract and analyze known-knowns. These methods assume that the engineer is already familiar with the data and knows where to look for answers. You can use statistics or other mathematical means to algorithmically resolve the known-unknowns, such as search terms and thresholds. The unknown-knowns are taken care of using AI/ML/DL techniques that generate log insights such as event correlations, log pattern clustering and known anomaly detection. But what about the unknown-unknowns?

    Uncovering Unknown-Unknowns

    With raw text logs, it’s relatively simple for engineers to conduct machine searches or set alerts upon encountering certain specific errors or specific types of behavior. However, to search through logs or even set up alerting parameters requires you to know what you’re looking for. If you have no idea what kind of errors or threshold limits for which you need to be alerted, it’s impossible to set these up.

    Modern applications are incredibly complicated, and one can not honestly understand everything about how they work or even always ask the right questions when things go wrong. But if an engineer reviewing logs doesn’t even know what to search for, it becomes impossible to figure out without an assistance tool like a purpose-built log visualization solution.

    For the most part, none of the techniques used to uncover the known-knowns, known-unknowns, and unknown-knowns of log data can help reveal the unknown-unknowns. An effective way of unraveling them is to rely on human intelligence to explore the unknown-unknowns space. Supplementing human intellect with a purpose-built log visualization tool can significantly help analyze the unknown-unknowns. Once you’ve recognized the unknown-unknowns, you can quickly feed this knowledge back into the appropriate, less esoteric groups (known-knowns, known-unknowns and unknown-knowns) and get more value from your log data.

    A good log visualization tool can aid in gathering knowledge from unknown-unknowns and can inform proactive log analysis or fast reactive log analysis use cases. Current log analysis practices center around reactiveness; the focus is to minimize and resolve issues after a problem has occurred. Using a log visualization tool, you can quickly isolate subtle and anomalous changes within a system by visualizing patterns generated from log data and exploring unknown-unknowns before an incident occurs.

    Current log visualizations are limited in display log count distribution and its variations. They do not visualize other log attributes or log combination attributes.

    All the UIs shown have similar function usage and displays. Drilling into an example of UI windows gives one the feeling of a typical log analytics practice. The figure below annotates different log analysis functions in the labeled, boxed area. None-visual log analytics functions such as search, tag, and log display are all required time-range input.

    log metrics annotate UI

    An ideal log visualization tool should not rely on just one information type. Log data is multifaceted. A log visualization tool can only begin to be valuable when it lets you focus on as many facets of log data as you can derive.

    Log Visual Pattern Discrimination

    The power of log visualizations comes from humans’ ability to recognize visual patterns. It’s hard to spot a pattern among raw log data, but it becomes easier once you can visualize that data.

    When an experienced DevOps operator looks at a log visualization, they can easily see where the anomaly is, even with no previous understanding of how the system works or where the anomaly might be coming from.

    Visualizations allow engineers to identify visual patterns and quickly understand what is going on in the system—whether it’s a hack in progress or an error causing a poor user experience. Visualizations are compelling, as they help shed light on important events, even if the engineer has no idea where to look or had no idea there was a hack going on in the first place.

    For instance, consider a scenario where a complex system generates millions of logs daily. Suppose we were to establish a baseline of the number of logs the system would generate when functioning normally. In that case, we’d have to take a daily count over a couple of weeks, or at least a month, to deduce a good-enough baseline.

    Even if we derive an acceptable baseline, we’d have to keep recording daily counts and compare it with this baseline to detect an anomaly. Doing this can be time-consuming and counterproductive as you might end up discovering an anomaly when it’s already too late to take any action.

    Once we plot logs daily on a graph, we can immediately figure out the baseline by observing it visually. Once we’ve visually established a baseline, we can instantly identify anomalies when we see values plotted above or below that established baseline. The following image visualizes logs ingested over ten days, illustrating how simple it is to establish baselines and identify when a system is doing something outside its usual behavior. This graph can deduce the baseline to be around 38,000 log records, with anything above denoting abnormal behavior within the system.

    log visualization

    Better Log Visualizations

    There are a few essential criteria for creating good log visualization analytics. They are:

    Use original log data. Data strategy is important. Most log data is unstructured by default, and many organizations tend to convert it to structured data before doing anything else with it. Doing so is a mistake, as you can lose vital pieces of information in the process. Good visualizations should be based directly on the logs exactly as the system produces them.

    Log data consistency. The format for the visualization should be consistent because if there are constantly changing variables, it becomes harder for humans involved to spot patterns.

    Choose robust log attributes and use them wisely. Instead of using just one log attribute for visualization (such as time distributed log density), you should look at visualizing more facets. Doing so gives analysts a better grasp of—and an intuitive understanding of—the log data set. For example, multiple pictures of an elephant taken from different angles help people understand elephants better than showing them only a single photo of an elephant taken from one angle. Similarly, if we break down logs by each of their attributes and then plot their frequency, we can better visualize how a system is performing. However, the attributes you pick are critical to providing valuable visualizations.

    With modern systems becoming even more complex, deciphering logs and uncovering unknown-unknowns will never be easy. The time is right to introduce new log visualization techniques to handle these unknown-unknowns. With log visualization becoming more user-friendly, you no longer need to count on people to be familiar with log interpretation or be aware of statistical, mathematical or AI techniques to analyze log data. Visualizing log data is not just a decision-making aid to human intelligence, discriminating between what is and isn’t acceptable and quickly identifying and remediating issues—the knowledge gained from unraveling the unknown-unknowns also helps advance AI/ML and automation techniques used to ascertain the knowns of your log data.

  • Grafana Labs Advances Open Source Visualization and Observability

    Grafana Labs Advances Open Source Visualization and Observability

    During the online GrafanaCONline conference today, Grafana Labs announced that version 8.0 of its open source visualization software widely employed by DevOps teams is now generally available. In addition, version 1.0 of Grafana Tempo, an open source back end platform for collecting distributed traces that are needed to drive observability across an application environment, is also generally available.

    At the same time, Grafana Labs revealed that Grafana Tempo is now available as a service on Grafana Cloud.

    Version 8.0 of Grafana adds support for additional types of visualizations such as streaming panels, state timeline, status history, bar chart and histograms in addition to a revamped unified alerting system that enables DevOps teams to view and edit alerts generated by Grafana and open source Prometheus monitoring platform via a common user interface. The notification system adopted to achieve that goal is based on a Prometheus alert manager that provides capabilities such as grouping, deduping and silencing of notifications alongside advanced message templates.

    The latest release of Grafana also improves startup and graph rendering performance, thanks to a major reduction in initial download size and graph rendering time.

    The enterprise edition of Grafana has also been updated to provide support for fine-grained access controls, improves caching of back end data sources and improved reporting capabilities such as live dashboard links that can be embedded in email.

    Overall, Grafana Labs claims there are now more than 750,000 active installations of Grafana that organizations are employing to create visualizations that correlate data collected from multiple back end sources.

    In addition to contributing to Grafana and Grafana Tempo, the company is running a cloud service that makes multiple instances of Prometheus running on different clusters accessible from a central console.

    Torkel Ödegaard, creator of the Grafana project and chief Grafana officer for Grafana Labs, said Grafana Tempo promises to further advance observability thanks mainly to its ability to employ object storage to capture complete distributed traces. Rather than only sampling traces, it’s now feasible to trace every request. Grafana Tempo is also compatible with any open source tracing protocol, such as Jaeger, Zipkin and OpenTelemetry, and can be integrated with metrics, logs and dashboards via a managed Grafana Cloud service.

    It’s not quite clear how quickly organizations are embracing distributed traces to improve application observability or, for that matter, to what degree traces might eliminate the need for certain types of metrics or log analytics. The one thing that is certain is DevOps teams require more context than ever to proactively manage complex IT environments. Distributed traces make it simpler to track interactions between application services. The challenge is they can require IT teams to store a lot more data.

    In time, of course, distributed tracing will become more commonly employed as developers more routinely instrument applications based on microservices that tend to have lots of dependencies that are difficult to discover in the absence of some type of distributed tracing capability. Of course, distributed tracing has been around, in some form or another, in application performance management (APM) platforms for some time. The difference now is that, as open source software, it’s becoming more affordable to implement.

  • How Centralized Log Management Can Save Your Company

    How Centralized Log Management Can Save Your Company

    Through centralized log management, organizations can consolidate all log data into one central, data highway and directs logs wherever they need to go

    The digital transformation wasn’t gradual. It came crashing into industries worldwide in response to safety restrictions around the pandemic.

    Nearly a third of Americans are working remotely in light of the pandemic—drastically increasing the external users—with no signs that employees will be returning to the office full-time post-COVID-19. A recent PwC survey found that 83% of employees want to work remotely at least once a week and that 55% of employers anticipate their employees will do so even after the pandemic.

    Companies have implemented new and creative solutions to deal with the spike in remote access: VPNs and SSL connections through web applications, to name a few. However, many of these solutions were only a bandage that won’t suffice for long term remote access.

    There is one thing amid all these changes that can become an increasingly large problem if left unaddressed: logs. Logs are collections of data that continue to be collected whether users are in the office or in their living room. Without centralized log management, this data can put organizations at a critical security risk. As the digital transformation takes industries by storm, it’s important for organizations to remember the importance of managing logs.

    Today’s Log Landscape

    When a company’s remote workforce jumps from 50 to 5,000 in a matter of weeks, things change. Compared to in the office, logs at these companies have jumped by 10,000%. Remote work generates logs on security access points, remote access, server logs, terminal services and application logging—all of which are fed into an organization’s security information and event management solution (SIEM).

    This jump is creating and revealing more blind spots to companies, which proves how difficult it is for administrators to increase the rates for their security monitoring tools to reach that level without drastically upping their company’s budget for its SIEM. Even Microsoft and network providers are running into issues with so many changes happening at the same time. Additionally, companies have to worry about privacy laws, making sure all personal data is encrypted and secured.

    Centralized Log Management

    Organizations should implement centralized log management (CLM) to consolidate all log data into one central, data highway that collects all logs and directs them wherever they need to go. CLM solutions reduce SIEM costs once SIEMs are no longer effective log management tools.

    Dropping all logs into a SIEM spikes costs, so oftentimes only a portion is collected, which creates fragmented or incomplete pictures and impacts security monitoring and incident response. CLMs lift the burden of having to hire staff, provide training and support for SIEMs. CLMs also reduce the costs organizations would incur with their SIEM providers, as well as the risk of endangering the SIEM infrastructure by storing unmanaged logs.

    Fragmented data collection can become a unified data collection with a data highway. Organizations can now filter unruly data and deliver only what you need. This helps overcome the age-old strategy of letting separate teams have their own sources of data, which could instead be directed to the appropriate team via your data highway. The data highway lets you collect once and use it many times, where it’s needed.

    Parsing: Cleaning up the Data

    Once logged, data needs to be parsed. To prime your data to be parsed for specific items, unnecessary and unwanted information must be filtered out. This diminishes the storage space logs take up and increases the usability of the data.

    One example of superfluous information is the timed mark that many applications add into the log of their system to show they are online. Unless a security auditor will need to see this, there is no reason why an organization should be paying to store it in their SIEM. Administrators are even able to filter out all extraneous text and add parsing for specific events. This quickly and easily reduces costs that are likely spiraling out of control during this time.

    Parsing, filtering, masking and other transformation techniques in your data highway allow security teams to overcome privacy issues and filter out personal information that shouldn’t be distributed. Resolving this problem could become crucial as more and more personal data is being collected than ever before, and as privacy laws are becoming stricter.

    The Data Highway

    Build your dream team to utilize your new data highway to its greatest potential. Not everyone reviewing logs will be SIEM experts or as skilled as a Linux or UNIX administrator (or even one at all). Build your team to be able to easily operate your new data highway, because you don’t want it to be gathering dust on the shelf.

    With your new data highway, you’ll be able to optimize your SIEM, increase your likelihood of meeting compliance requirements and be able to log from more places with easy searchability. With that encrypted data store, your compliance officer may even be able to sleep at night. Beyond the SIEM, you’ll be able to send your data anywhere: Kafka, MongoDB, any database, big data systems and more.  Don’t just optimize your SIEM; build your data highway and collect those logs once, distribute them where they need to go and cut costs with centralized log management.

    So, in this crush of new technologies spiraling into the new digital transformation age, don’t forget the importance of managing your logs. IT and security admins shouldn’t be in the position of going to company management to inform them of uncontrolled SIEM costs. They can be managed and reduced without losing their effectiveness by simply feeding to the SIEM only the data that needs to be there.

  • Metrics, Logs and Traces: The Golden Triangle of Observability in Monitoring

    Metrics, Logs and Traces: The Golden Triangle of Observability in Monitoring

    It isn’t surprising that the job of monitoring infrastructure and application environments has grown more complex as the underlying technologies evolve. Nor is it surprising that the need to get monitoring right has expanded as our business reliance on IT grows ever deeper, so it is important to have a good grasp of the core tools at your disposal.

    What you might call the golden triangle of observability includes metrics, logs and traces. Each plays a specific role in infrastructure and application monitoring so you need to understand what they bring to the table.

    Metrics

    Metrics probably represents the most valuable of the three monitoring tools because:

    • So many resources are designed to spit out various bits of health and performance information (and there are loads of tools to collect this information).
    • They are efficient.
    • They are frequently generated.
    • They are easily correlated across elements of your infrastructure.

    Everything from operating systems to applications generate metrics which, at the least, are going to include a name, a time stamp and a field to represent some value. Since so many resources come ready to tell us about themselves, metrics is an obvious place to start when it comes to monitoring.

    Most all metrics will enable you to tell if a resource is alive or dead, but if the target is valuable enough you’ll want to be able to ascertain what is actually wrong with the system or going wrong.  As you can imagine, the latter will require detailed information about what is happening inside the system, so called white-box monitoring that relies on internal instrumentation.  The more rudimentary black-box approach draws conclusions about the health of a system based on externally visible indicators (is it responding to any system calls?).

    But perhaps the most important thing to understand about metrics is that last bullet about  being able to correlate metrics across infrastructure components.  Given the complex interdependencies common to IT environments today, the ability to stitch together metrics to get a bigger picture view is a real time saver. And it becomes even more critical as we move to cloud-native environments because of the dynamic nature of cloud  infrastructure and the ever-changing relationship between that infrastructure and the applications.

    An initial challenge of harnessing metrics is the variety of the information available and the number of tools needed to collect and make sense of that information. Then there is the question of how you store data in so many formats from so many resources. But the resultant upside more than makes up for the effort required to figure out how to harness the information.

    It is also worth noting that, given there is no standard API for metric collection, many organizations use agents to collect data that is either pushed to a central location for analysis or pulled by that central resource. Gartner says agents frequently referenced by customers include push agents Collectd and Telegraf, while Prometheus is cited as a tool to pull information from targets.

    Logs

    Logs are perhaps the second most important tool in the monitoring toolbox because virtually everything logs information about what they are doing at any given time. What’s more, logs tend to give more in-depth information about resources than metrics.  So, if metrics showed the resource is dead, logs will help tell you why it died.

    The problem with logs is there can be too much of a good thing. With everything in your environment tracking what they are doing and anxious to share that information, it is easy to see how that could result in a mountain of data. Instead of streamlining the monitoring process, you are simply creating a big new centralized haystack.

    And like metrics, differences in log formats and the abundance of tools available to collect and make sense of logs, complicates the job of getting the most out of this rich trove of material. There are, however, a number of common tools used for collecting logs, such as syslog and open source tools such as Fluentd.

    The trick to getting the most out of these tools is limiting what you collect to keep it manageable, and, where possible, to home in on common fields so you can more easily find the needles in the haystack.

    Traces

    Last but not least in the monitoring triangle is application trace data, which “traces” information about specific application operations. With so many application interdependencies these days, these operations will typically involve hops through multiple services (so called spans).

    Traces, then, add critical visibility into the health of an application end-to-end. They are, however, solely focused on the application layer and provide limited visibility into the health of the underlying infrastructure. So, even if you collect traces, you still need metrics to get the full story of your environment. APM tools feed trace information to a centralized metrics store, so traces provide a nice source of data for an app-centric view.

    The need for the viewpoint that traces can provide is exacerbated in container-based microservice architectures that are nothing more than a collection of stitched together services. These environments can be addressed with something called distributed tracing.

    Do You Need All Three?

    There is obviously overlap among metrics, logs and traces. But the quick answer to the question of whether you need all three types of monitoring tools is, It depends. The simpler your environment and the more tolerant you are of performance degradation and outages, the fewer tools you’ll need to keep things running. Basic metrics will probably work fine for you.

    Conversely, more complex environments that have to be up and running at all times or need to be fixed as quickly as possible will require a mix of tools that answer more than the question of, “Is it broken?” Metrics and logs will be base requirements.

    And finally, if your environment consists of a lot of intricately interwoven pieces, then adding traces will save you effort when it comes to birddogging problems. If you’re not there yet, but see containers and microservices playing a bigger role in your future, you’ll probably want to start getting familiar with trace tools today.

    Keep in mind that each of these tools requires storage considerations. Yes, there are options to support multiple tools from the same repository, but you’ll want to consider those needs as you build out your monitoring repertoire. And ultimately, you’ll want analysis and alerting tools that can span the environments, so keep that in mind as you consider the options.

    Together metrics, logs and traces make up the golden triangle of observability and will help you stay on top of the ever-churning IT world driving business today.

    — Apurva Dave
