Tag: logs

  • DevOps Chat: AI Log Analysis with Gabby Menachem, CEO, Loom Systems

    DevOps Chat: AI Log Analysis with Gabby Menachem, CEO, Loom Systems

    Log analysis has become a big data issue. As we collect and want to analyze more and more information, the amount of data to analyze seems to grow by leaps and bounds. One answer to this issue is AI Log Analysis (apply artificial intelligence). While I will spare you the obligatory “machine learning” references, there are companies that are bringing AI to this issue.

    One such company is a startup from Israel, Loom Systems. devopsy.kinsta.cloud sat down with Loom Systems CEO Gabby Menachem in this episode of DevOps Chat. As usual, the streaming audio of our conversation is below, with the written transcript of our conversation immediately below that. Enjoy!

    Alan Shimel: Hello, everyone. It’s Alan Shimel, editor in chief, devopsy.kinsta.cloud, for another DevOps Chat. On this episode of DevOps Chat, we’re joined by Gabby Menachem, who’s CEO of Loom Systems and comes to us today from Israel. Hello, Gabby, how are you?

    Gabby Menachem:  I’m great. Hi, Alan. Thanks for having me.

    Shimel: Thank you for being our guest today, Gabby. Gabby, I guess we should start with – I’m gonna imagine that folks in our audience are not familiar with Loom Systems, so would you mind giving us just kind of a quick background on Loom Systems?

    Menachem:  Sure. Loom Systems is a platform—a solution, actually, to predict and prevent problems in your digital business. We actually are able to analyze logs and semi-structured machine data for immediate visibility into the company’s digital environment, any environment going from legacy systems to the latest application, your homegrown application that you just wrote. And, by doing that, we can significantly reduce the cost and complexity of working with operational analytics on IT. And, using our tribal knowledge bank, which is called “TriKB,” we’re actually able to find issues proactively using log analysis and bring them to IT’s attention and help them resolve them in minutes, instead of hours or days.

    Shimel: Got it. So, Gabby, just to be clear, is Loom actually the log gatherer—in other words, gathering the logs—or is it just analyze logs that are provided from another solution?

    Menachem:  So that’s a great question and, for the most—in most environments, we’re not focused on gathering the logs, so we come to places, in most cases, where they already collect logs, although our solution can handle the collection of logs as well. What we focus on is the actual analysis, so we find that businesses today have a problem utilizing their personnel that they already have, in order to find a root cause and do root cause analysis of issues in the logs. And, as we all know, when you have a problem and with today’s digital transformation, you have to go into the logs in order to find issues that affect your customers. And so, by using Loom Systems, you’re able to get help with that root cause analysis and you get actionable recommendation on how to solve these issues in minutes. And that’s how you can actually use a solution that helps you with the analysis phase and not with the ingestion or things like that.

    We also provide a way to do collection and all the other features of a log management tool, but it’s not out focus and we’re, to be honest, in most cases, we’re happy to find that businesses have already put effort into looking at logs in a centralized manner. That kinda gives us the signal that they’re already operational and they’re looking at logs as a way to solve issues and find the ROI in that case.

    Shimel: Excellent. So, Gabby, give us an idea what kind of log gathering tools does Loom System integrate with. Is it Splunk and that type of thing?

    Menachem:  So we work, basically, with every tool in the market. I’m not aware of a customer that we went to that we weren’t able to connect in less than 90 minutes, so that’s our claim for fame and you can test us, if you want.

    Shimel: Mm-hmm.

    Menachem:  And it takes us—the main thing with our platform is that, from whatever source that you would stream logs from—it could be Splunk, as you said; it can be open-source tools like Logstash or proprietary tools that are Syslog, for example—and, from there to streaming information into Loom, what would happen is that Loom would parse the logs automatically and find anomalies and trends and can actually alert you on things before it affects your business. So we’re appealing more to the business layer, where we want to connect what IT is doing to what the business is looking for, in terms of understanding users’ behavior, anomalies that affect the customer experience, and, basically, our ROI, in most cases, is measured on preventing churn from customers that are actually looking for a better customer experience with all these businesses’ ongoing and digital transformation. Does that make sense?

    Shimel: Yeah, it makes total sense. So, Gabby, one of the probably most overused terms we’re hearing in the market today, but I don’t see it mentioned in the Loom Systems, is this idea of machine learning, if you will. And, you know, machine learning kinda goes hand in hand with AI and stuff like that. Is that kinda what Loom is doing then, in performing this analysis? Or something different?

    Menachem:  Yes. So the way that we actually are able to do all of that is based on machine learning and AI. We don’t want to use the hype of the words as much as we want businesses to understand that this is actually the future of being able to analyze data, so one of the key hurdles that we see or the barriers that customers experience is that, when you want to analyze information, first of all, you need to get a data scientist, which they’re hard to find these days, and you need to have a good methodology of how to analyze your data.

    And one of the key issues here is that Loom is able, through AI and through the heuristics that we’ve put in, to actually do this for you. So we’re trying to abstract away all the complexities of using machine learning and working with features that most data scientists do today, and, that way, we can actually use your, well, highly skilled personnel, but they are not now proficient with using these machine learning systems. So this is the way for you to use super advanced analytics and AI without having to go through extensive training or something like that. The machine would just act as if it’s a human and as if you’ve got a new IT person in your environment that can actually go through the logs all day, without getting tired, and just alert you, call you, and say, “Alan, come look at this. This looks interesting. And, by the way, when I saw this last, we had a problem with our database and we were able to fix it by applying this patch from Oracle,” for example.

    Shimel: Got it.

    Menachem:  Does that answer your question?

    Shimel: Yes, it does. So, Gabby, give us an idea of—and we realize Loom is a startup, but what is the target? Who is the target customer here?

    Menachem:  So we’re marketing to medium-sized businesses through enterprises. Mostly doing insight sales these days, less of an enterprise sale, per se, but what we’re doing is we’re going to these organizations and we’re talking to anyone from the CIO down through directors and IT leaders and DevOps, in order to explain to them that one of the biggest, most sought after solutions that they were always thinking about, which is “How do I actually find things – surface things that are of interest from my logs without any prior configuration?” So you don’t wanna do the big project of parsing your logs and explaining to a system what is important, what is not. You don’t wanna do all of this that is in the market today, which is based on supervised learning, where you have to give a lot of feedback and explain to the system how things should work. You just want the system to act as if it’s a human and understand by itself what is meaningful and what is not.

    And, with that approach of unsupervised learning with a few feedback loops that we employ, what you can actually get is a very sophisticated tool with a very simple approach to operating it, which I think is what IT operations is looking for all the time. We want the simplicity and—actually, we want the complexity of our environments to not transcend to the complexity of the tools that we use, so simplicity in the tools gives us better way to manage these problems. We don’t wan to suffer from alert fatigue and we don’t want to interact with systems that take years to learn and to know how to operate, and that’s the way that we’re actually able to give better customer experience for our customers and solve issues faster.

    So, today, when we go into a business, it takes us about 90 minutes, as I said, to install and get running. And you see the value from your Loom installation in the same day. Do this either on-prem or in our SAS, in AWS or in Azure, so you have all the possibilities there, and we go to both big businesses, like banks and insurance companies through retail and e-commerce, and down to businesses with 200 people. But our main audience is the medium businesses all over and DevOps leaders that are looking for the next generation of proactive alerting.

    Shimel: Got it. So, Gabby, in a lot of ways, this type of intelligence—you know, I come from a security background and we’re seeing this more and more in security, providing actionable intelligence, analysis of—because, I mean, the good thing about big data is it’s big. We have a lot of data; we’re seeing a lot of things. But trying to make heads or tails of it and boil it down to actionable intelligence is key; otherwise, we just drown in data. How did you guys kinda come up with the idea to do this?

    Menachem:  So, first of all, the big thing here is what you described—the fact that we were—a lot of the team was working in intelligence, in fact, before that, and we’ve seen a lot of this use cases where you’ve had to look at a lot of information and be able to sift through it and find interesting things, in order to bring them in front of a human that can make the business decision.

    So there’s a layering system, where you look at data as the lowest layer and on top of it there’s the what we call “information layer,” which is where all the tools today are. So it’s a way to have a mapping between data and visualization, so let’s take the number of errors that you see in your logs, for example—that could become a graph. And, on top of this graph, what people are doing today is they’re looking at it and figuring out if there’s some anomaly or a trend there that they should be looking at, and then they go back to the data and make sense to out of it. This is the third layer, which is called the “intelligence layer,” and this is where our tool operates. On top of this, there’s one more layer which is called “wisdom,” and that’s where you connect the intelligence layer, which tells you what is going on with a business decision that you have to make, and then you can take action.

    So an example would be—and sometimes we get this question of, “Why don’t you connect this to automation tool to actually resolve issues automatically?” And what we say is that resolving issues is a business decision. It’s not just about, you know, if it’s Black Friday and our system is finding that there are one percent of your users that are experiencing a problem, you don’t want the server to restart because you’re gonna lose a lot of business, so the business decision has to remain in the hands of DevOps leaders.

    And, coming back to why we started this business and how we came up with the idea, it’s basically—I think what happened in intelligence is actually happening in the commercial market, so big data is a new thing in our world, but it’s not a new thing in intelligence. It’s been there for 50 years. And, as the intelligence community grew and came to the conclusion that something had to be brought into a visualization tool, they built this information layer, and then the next phase was to actually build “smart systems,” as people call it today, to analyze information for you and come up with things that people just can’t handle, in terms of capacity. So the cognitive ability that we built into the solution perfectly aligns with what happened in the intelligence community, and now we’re bringing it to the commercial market, for the use of all these businesses doing digital transformation.

    Shimel: Makes sense. Makes sense. So, Gabby, we’re coming on the end of our time—as I mentioned to you, it goes fast. Where can people find out more about Loom Systems?

    Menachem:  So through our website, loomsystems.com, is the best way to get information. You can sign up there or you can even talk to us with a chat online. We provide free trials, so it’s very easy to start streaming information to our SAS business, and we can converse with you and start understanding your use case. We’re very fast to operate and you’d see value in the same day. I invite everyone to come talk to us and you can also meet us at a lot of the industry events. We’re gonna be in OpenStack next week and hope to see you there and talk to you.

    Shimel: Got it. Gabby, just so the audience knows, what is a typical engagement price-wise or how is it priced?

    Menachem:  So it’s based—today, it’s based on the number of instances sending information into Loom, so one of the differentiators, in the way we price this, is it’s not data volume-based, so you can actually send us as much information as you want, unlimited data, and we just count by the number of instances sending information into Loom. And the regular prices, they start at about, I’d say, $20,000.00 for the smallest amount, and most installations are in the $50,000.00 to $100,000.00 on annual deal.

    Shimel: Got it. Excellent. Well, Gabby, thanks for sharing this information with us today and thanks for being our guest on this episode of DevOps Chat. Continued success with Loom Systems and we’d like to hear more maybe, going in the future—if my mail program would stop making noise, we’d be okay. I apologize. Gabby, we’ll check back in on Loom Systems perhaps in a few months and see what kind of—what’s new, but until then, keep doing what you’re doing. This is exciting, kinda representing the future of where we are with analysis and using computers, so congratulations and continued success to you and Loom Systems. This is Alan –

    Menachem:  Thank you very much, Alan.

    Shimel: Thank you, Gabby. This is Alan Shimel for DevOps Chat and devopsy.kinsta.cloud. Thanks for listening, everyone. We’ll see you soon on another DevOps Chat.
    — Alan Shimel

  • 5 Reasons Why Companies Should Analyze Their Logs

    5 Reasons Why Companies Should Analyze Their Logs

    At first thought it might seem as though analyzing logs is something that only affects the IT portion of your business. However, nothing could be further from the truth. In reality, log analysis affects every aspect of your business. This includes finance, legal, human resources, sales and marketing, security and operations. In fact, with log analysis, you’ll discover issues either before or as they happen and avoid both lost time and unnecessary delays.

    There are many benefits to properly analyzing your logs. Your organization can increase revenue, reduce expenses, better manage employees, respond to incidents and even keep yourself out of legal hot water. Read on to learn about the five major business areas impacted by log analysis and why every business needs to analyze its log—and the sooner the better.

    Business Operations

    Probably the most obvious use of log analysis is in supporting business operations. These functions include the following:

    • Detecting critical system errors
    • Identifying key trends
    • Improving operational efficiency
    • Supporting service level agreements (SLA)
    • System troubleshooting

    Early indication of problems can pinpoint money-wasting processes. It also can mitigate risk in support of business continuity. This will help avoid service disruptions that can lead to unhappy customers and lost sales.

    Compliance and Legal

    Every organization has internal policies: security policies, employee policies, legal policies, etc. In fact, most organizations have regulations (such as HIPAA and Sarbanes-Oxley) they must adhere to. Often these regulations are imposed by the government. The only feasible way to ensure policies are followed and regulations are met is through log analysis.

    Log analysis simplifies compliance. It also supports audit requirements, litigation needs, subpoena requests and forensic investigations. In short, log analysis is the only way to ensure an organization stays out of legal trouble.

    Proper Resource Sizing

    One of the worst things any company can do is have the wrong amount of resources to support its business operations. From network bandwidth to storage capacity to CPU cycles, businesses have to get these quantities just right. Not enough resources in any area can lead to poor performance, frustrated customers and, eventually, lost sales.

    Of course, the easy thing to do is just overspec these resources. However, doing that leads to increased expenses, which adversely impact the bottom line. Using logs to determine proper resource sizing is the only way to ensure you have maximized your profits.

    The use of logs can also be used to verify third-party billing. For instance, your company can use your logs to make sure the amount of bandwidth you were charged for by your service provider is actually the amount you used. This, too, can benefit the bottom line.

    Sales and Marketing

    It may not seem as though log analysis can be used to directly impact sales and marketing, but it certainly can. For starters, log analysis can be used to quantify the effectiveness of a sales campaign. Information such as referring sites, pages accessed and conversion rates all can be used to tweak different aspects of the sales effort.

    Log analysis also can be used to optimize website performance in the support of a sales funnel. Information such as customer navigation, traffic loads and conversion errors can be used to improve the sales process. In fact, analyzing logs can be used as a revenue driver in any organization.

    Security

    One of the most important areas in any business today is security. Logs can be used to both proactively protect an organization, as well as forensically investigate security breaches.

    Proactively, logs can be used to accomplish the following:

    • Optimize blocking and filtering of incoming traffic
    • Maximize email virus protection
    • Monitor failed authentication attempts
    • Verify configurations in firewalls

    After the fact, logs can be used to do the following:

    • Assess security policy compliance
    • Initiate incident response
    • Investigate security breaches

    You cannot understand security risks or respond to security incidents without the ability to analyze your logs.

    In short, whether you were aware to it or not, log analysis impacts every department in your organization. It directly and indirectly impacts every company’s bottom line by increasing revenue, decreasing expenses and delighting customers.

    You now know that log analysis is not just a “back office” IT function. Every department in your company needs to use the intelligence contained in your logs to do their jobs better. It is why every business needs to analyze their logs, and now is the time to start.

    About the Author / Ariel Assaraf

    arielassarafAriel Assaraf is a co-founder and CPO at Coralogix. Previously Ariel was a GL at Verint and a Product manager at an elite Israeli intelligence unit.  He is into Software design, UX, growth hacking and basketball. Ariel holds a BEc in Economics and Math from the Open university of Israel. Connect with him on LinkedIn and Twitter

  • DevOps Chat: Christian Beedgen, CTO and co-founder of Sumo Logic

    DevOps Chat: Christian Beedgen, CTO and co-founder of Sumo Logic

    Christian Beedgen has years and years of experience in collecting large amounts of data and making it useful to Dev, Ops and security teams. I recently had a chance to sit down with Christian and talk about what is driving innovation in the data analysis market and how Sumo Logic is responding. While our conversation is short, Christian gives some great insights that I think you will find useful.

    Below is the streaming audio of our conversation and below that is the transcript so you can follow along.

    Enjoy!

    Alan Shimel:                Hi. This is Alan Shimel, devopsy.kinsta.cloud, here for another DevOps Chat. I’m very happy to be joined by Christian Beedgen, CTO and Co-Founder of Sumo Logic. Christian, I didn’t butcher your name too bad I hope.

    Christian Beedgen:     No, it’s quite fine.

    Alan Shimel:                Welcome. Christian, we had set this up some time ago that I wanted to interview you because there’s so much going on with Sumo Logic, but I realize maybe some of our listeners may not be familiar with the company yet though. So before we dive into some details, can you give us kind of a high level, a 50,000 foot overview of Sumo and what you guys are doing there?

    Christian Beedgen:     Absolutely. Sumo is a machine data analytics company. That’s a highfalutin way of saying that we’re doing log management. We have been around since 2010. The big differentiator that we brought to the market, among other things on a high level, is that we actually offer this as a service. So there’s nothing to install. It’s all focused on actually using the product to make sense out of your logs, out of your machine data for troubleshooting and analysis of application logs and everything up and down the stack basically.

    Alan Shimel:                Excellent. So logging as a service. And you’re right; the idea is a very 50,000 foot view of it. Christian, the dev-ops market of course is exploding and it’s a very hot area for tools vendor. Sumo Logic in particular, though, is always sort of at or near the top in terms of awareness among the dev-ops community. What do you attribute that to?

    Christian Beedgen:     Well, I think we are in a very fortunate position of having good product market fit basically. I come from this space of log management, as does my co-founder. We might not know much, but we certainly know a bit about how to build products that help people managing logs.

    Logs and anything that has to do with monitoring really are at the very center of any kind of operational activity. So it’s not a surprise to me that dev-ops folks are excited about what Sumo is doing, because it’s part and parcel of what they have to be able to do and I think we support it really well, and we end up in their toolbox more often than not.

    Alan Shimel:                Excellent. Christian, sort of the new messaging or new functionality that the Sumo folks seem to be really spreading right now is the idea of unifying logs with metrics. Can you give our audience an idea; what do you mean by that?

    Christian Beedgen:     I’m actually extremely happy to be able to talk about that because that has been cooking for a long time, and as of April we are now able to talk about it publicly. This goes back all the way in my mind to 2010. I’ve been wanting to do this for a very long time.

    From my own observation, of course at Sumo we’re running a pretty large scale distributed system, so we have a lot of insight into just from of our own sort of dog-fooding as to what we need in order to run a large scale system and in talking to customers and observing what they actually need in order to make their applications run better and troubleshoot them better and get them back in line better.

    Logs are certainly a very important part of that, but the other side of the coin when it comes to machine data are metrics. So what are metrics? Metrics are essentially time series data. It usually comes from the hosts. It starts with CPU, I/O metrics, network metrics, and then goes up the stack all the way into the applications, you know, how many logins per second, what’s your API response times, and those kinds of things.

    While those can be potentially captured in logs, logs are not necessarily the most efficient way of processing metrics. But metrics are extremely important and I think they kind of go together with logs in order to give you kind of a full overview as to what your systems are doing.

    We know about this need from our internal use, from our internal operations use cases, obviously, and we’ve heard it from customers as well that they don’t really like to do what we call sort of swivel chair analytics, where you have to like jump back and forth between different tools, one for metrics, one for logs, one for something else. We think we are in a good position to unify those things and this is why we are now basically bringing to market an additional metrics capability as part of Sumo Logic, and instead of building that as a second separate product, we decided that, hey, it’s really part of the same high level use case and sort of our unique proposition, value proposition there is, that we can do it in the same tool and we can kind of amalgamate the two different data sources and drive integrated use cases out of that, if that makes any sense.

    Alan Shimel:                Great. I just want to make clear to our audience. This is not officially released yet or it’s in a beta or early access form still or what is it?

    Christian Beedgen:     That’s correct. We have announced it. We announced it in April. We have obviously been working with design partners for a while. A number of our customers are actually using it as we speak, and we continue to get great feedback from them, and also, partially stuff that we now realize we probably still need to fix, you know, as usual when you’re deciding to roll out new functionality.

    We are currently planning to make this generally available by the end of July. So we’ll cross our fingers that we’ll hit that date. So it’s actually going to be in the market for everybody really, really soon. In the meantime, we allow folks to basically sign up to get onboard as early as possible and we’ve seen great interest in that as well.

    Alan Shimel:                Excellent. Now if any of our listeners who are not currently Sumo customers are interested in this, and I of course can see why they can, Christian, is there any place they can sign up for this or at least get more information, if not actually become sort of an early user or early access?

    Christian Beedgen:     Absolutely. Just to go SumoLogic.com and it’ll lead you there.

    Alan Shimel:                Great. Christian, if you don’t mind, we have a few minutes left and I want to sort of pivot a little bit. It’s basically my own thing. I actually just started writing – or finished writing a survey we finished up on containers and container technology. It certainly seems to be on the tip of everyone’s tongue. What are you doing? What’s your strategy around that? I want to ask a little bit about: does this pose a challenge for Sumo or a log is a log is a log?

    Christian Beedgen:     That’s actually a very good question. It actually turns out that we had to do a couple of things in order to stay ahead of the curve there, and that started in I think 2014. That’s kind of year that Docker broke, the way that I remember it. Then we started looking at what does this really mean, even for our own operations of course. But then there was a major voice coming from our customers, who of course jumped into this right away.

    It turns out that the way that you collect logs changes actually a little bit when you have the additional abstraction layer of a container. So we basically throughout 2015 wrapped our heads around that and figured out how to actually collect the logs from a containerized environment. There’s been a couple of iterations on that, of course obviously moving very fast, and they have also made some advances on how the logging works as far as Docker is concerned.

    But we now have first-party support for what I call sort of a comprehensive monitoring strategy for Docker. So that includes the logs as well as the metrics or what’s called stats in the Docker world, as well as these sort of Docker events and the additional metadata that can be queried out of Docker. So you know not just what the idea of your container is, but also what the images are that it’s running, et cetera. We can pull all of that into the Sumo and, on top of that, we have a really nice extension to Sumo that we call an app. That’s kind of our app for Docker that our customers are using.

    So it did change. The major change really came from the way that – technically speaking, the major change was that we had to do a couple of things in order to be able to collect they logs and the metrics, because that was basically the biggest change in terms of the low level stuff.

    At the higher level, the good news about the Docker stuff is I think that it provides a good amount of metadata, if you know how to get it, and mostly it’s with the Docker Inspect API that makes the analysis of the environment, which is now even more highly abstracted of course. You might not even know anymore which container runs on which source, et cetera. So there’s a lot of additional metadata that makes that actually really nifty. So I like that.

    Alan Shimel:                Very cool. Christian, we only have a few minutes left here, just another minute or two and I have two other things, two other questions on my list for you. Containers are certainly a very hot item. Dev-ops is very hyped. What do you think is next? What’s the next big thing?

    Christian Beedgen:     That’s one I think everybody is always thinking about that. There was a point when I realized what AWS Lambda actually was, and I was like, “Wow. That is really, really cool.” I don’t know yet exactly where it’s going to go, but I think it’s intuitive to me that in many ways Amazon has actually already invented the future after containers, and at the same time they were releasing the elastic containers. So I thought that was _____.

    Anyway, I think the term that has been emerging there is serverless, serverless computing. I think that is actually super-interesting, considering how complicated the stacks have become. It sort of adds yet another layer of abstraction, but basically one that destroys all the other underlying layers of the stack. I think that’s a really interesting thing that’s going on right now.

    Alan Shimel:                Sure, serverless computing for a no-ops age.

    Christian Beedgen:     There you go.

    Alan Shimel:                Let’s get rid of everything.

    Christian Beedgen:     Let’s make a t-shirt.

    Alan Shimel:                Yeah. Hey, once we get a t-shirt some VC will invest.

    Christian Beedgen:     There you go.

    Alan Shimel:                Anyway, Christian, last question because we are just about out of time. I often ask guests this. For people listening in, one book, if you can recommend one book to people that they should read that you find enlightening, helpful, must read, what would it be?

    Christian Beedgen:     The best thing that I’ve read recently is – oh, man, that’s a heavy-duty one. We are actually doing an internal book club on this and it’s been blowing people’s minds. There’s like matter all over the place. It’s called The Principles of Product Development Flow by a guy called Reinertsen. It’s kind of a second generation Lean applied to product development. The guy’s an academic. I love that book. I think it’s kind of mind expanding, so The Principles of Product Development Flow. That’s an awesome book.

    Alan Shimel:                If it’s on Amazon, I’ll try to include it in the show notes, so people can go look at it. Great. That’s a great suggestion and thank you. Christian, we’re over-time actually, but it’s okay, not too bad. I wanted to thank you for joining us on this edition of DevOps Chats. Continued success with Sumo Logic and we hope to check back in on you soon.

    Christian Beedgen:     Sounds good. Thanks for having me, Alan.

    Alan Shimel:                Okay. Christian Beedgen – and I know I always mispronounce his last name – but CTO/Co-Founder of Sumo Logic, thanks for being this week’s guest on DevOps Chat. This is Alan Shimel for devopsy.kinsta.cloud. Until next time, have a great day.

  • Loggly Derived Fields Add Structure To Unstructured Logs

    Loggly Derived Fields Add Structure To Unstructured Logs

    The Gist of Loggly’s Derived Fields Gesture

    A top log management product vendor, Loggly announced an update to its tooling last month in the form of its new Derived Fields. The vendor has drilled down past the summaries in its Dynamic Field Explorer interface into Derived Fields that use metadata to structure unstructured log data.

    Where traditional log management and analysis products have typically required you to create one-off regular expressions for custom analyses—expressions that you must build anew each time you want to put log data under a microscope—Loggly now enables you to use rules rooted in regular expressions that you create once to structure unstructured data when your systems first enter logs into the tool. You can look at resulting Derived Fields instantly, every time you need to do log analysis, according to Hector Angulo, Head of Products, Loggly.

    The necessity for the Derived Fields capability arises from the fact that logs that escape structured creation contain so much untapped value. Until now, Loggly’s approach has been to automatically apply structure to common log types. “But we find that more than one-third of customer logs are still not structured. Even worse, many of these logs were created by developers for their own use, without the expectation that others would need to rely on them for critical troubleshooting. As such, it can be really hard for everyone but the original developer to decipher what specific logs mean,” says Angulo. Derived Fields attempt to retrieve 100-percent of that value from the log data by making analysis possible for any team member.

    How Loggly Dogs Data Using Derived Fields

    Loggly absorbs data from common log types such as Apache or JSON. By adding metadata that describes unstructured log data and then “injecting” context and structure into logs or parts of a log, Loggly’s Derived Fields reclaim obscure developer logs. Fields that uniformly describe the same kinds of data elements across logs enable users to compare data within logs to see what is happening across a DevOps environment.

    Staff members who can create custom parsing rules based on regular expressions can set up the rules the DevOps teams will need at the start. Then, unless you come up with a new rule you want to add, your team members won’t have to create regular expressions again, and certainly not in order to search log data on the other end of that pipe.

    Using Derived Fields

    Using Loggly’s Derived Fields, you can drill down on a specific value in a field. Click on the field name and you can inspect all log events that have the same type of value. A summary chart above the individual event log will automatically refresh to summarize the events of the data from the given value, says Angulo.

    You can easily see other log events that share similar data or characteristics in order to arrive at insights about what is going wrong, or right with the software.

    How Derived Fields Help DevOps

    “Rather than starting with an empty search box, Loggly starts off with bird’s-eye-view summaries using Dynamic Field Explorer,” says Angulo. From there, you drill down to fine grain details.

    The time that Loggly’s Derived Fields save, time that it would normally take to create one-off queries for every analysis, is critical if you’re trying to solve a problem that is preventing end users from completing tasks and generating revenue for the business, says Angulo.

    According to Angulo, Derived Fields specifically help DevOps teams to:

    • Resolve issues faster because it is easier to spot the data that matters.

    • Perform advanced analytics even with legacy applications that send out unstructured, text-based logs that you cannot update or don’t have the bandwidth to update.

    • Extend advanced log analysis to more team members. You don’t have to be a regex wizard to gain insight from unstructured logs.

    • Finally, the intuitive, navigable summaries generated in Field Explorer equate to less training time, less time with reference guides, and more time on data analysis and problem solving.

    A Cautionary Note

    As with any DevOps tool update, the proof lies in how Derived Fields work in your development process. Loggly touts 5K customers using its existing product. I’m sure they’re not trying to chase anyone away.

    Are you using this tool? Do you have other input on this topic? See that empty comments field below?

  • Beyond Server Monitoring

    Beyond Server Monitoring

    The logs go in and the visualizations and insights come out. You suddenly have access to data you never had before—data that helps improve your operations and your DevOps environment. But is that where the value of log analysis stops? No! Extending log analysis benefits your entire organization, not just the development and IT Operation teams.

    (more…)

  • Log Data as a Valuable Tool in the DevOps Lifecycle (and Beyond)

    Log Data as a Valuable Tool in the DevOps Lifecycle (and Beyond)

    As many of us embrace DevOps, developers have to think beyond delivering code that is taken by “operations” to be deployed, run and monitored in production environments. DevOps instead focuses on breaking down silos within organizations and sharing the responsibility of development and operations such that developers are now more conscious of how their code will run in a production environment. They also play a critical role in the process of deploying, monitoring and operating the applications they write.

    Thus the responsibilities of developers can now span from development and testing, to deployment and monitoring, to gathering business metrics from production environments – i.e. they now follow a DevOps lifecycle rather than a development lifecycle. The focus of these responsibilities can change slightly depending on which stage an application is at in its maturity model. In this post, we first outline three high-level stages of an application’s maturity and then look at how logs can serve as a valuable tool at each of the different stages and in particular for teams following a DevOps methodology.

    The Stages of Application Maturity:

    1. Stage 1 – Initial system development and prototyping: When organizations embark on new projects, they usually have a small team iteratively develop an initial prototype before throwing the weight of a large development team behind it..This prototype is used to test any hypothesis and initial functionality; it limits risk and allows for an iterative feedback loop from early users. More and more often, prototypes are being quickly developed on cloud infrastructures where the initial development team plays the role of developing the system, selecting and managing the infrastructure, deploying the application, as well as putting in place initial monitoring for the running system. Only after an initial user group has used the system, provided feedback and helped prove a hypothesis will the system will move into a “go-live” state in the real world.
    1. Stage 2 – System going live: When an application moves from being a prototype to “going live,” an organization has made the decision that the project is worth pursuing and there is potential value in extending the system to a wider audience. This can involve investing in a larger development team, a larger infrastructure to handle real-user load, as well as marketing budgets to get the word out on this new offering. At this stage, focus can shift from initial concepts to building out more advanced and robust capabilities – ensuring service uptime, performance and reliability.
    2. Stage 3 – System generating value: If a system moves into a stage of creating value for the business, a number of new stakeholders can arrive on the scene with new requirements. Typically product managers and marketing teams will have requirements on how a new application’s features are being used, how an application’s marketing campaigns are tracking and how cohorts of users are flowing through the sales funnel. These new stakeholders are largely concerned with different business metrics and how they can be obtained from the running system.

    So where and why log data?

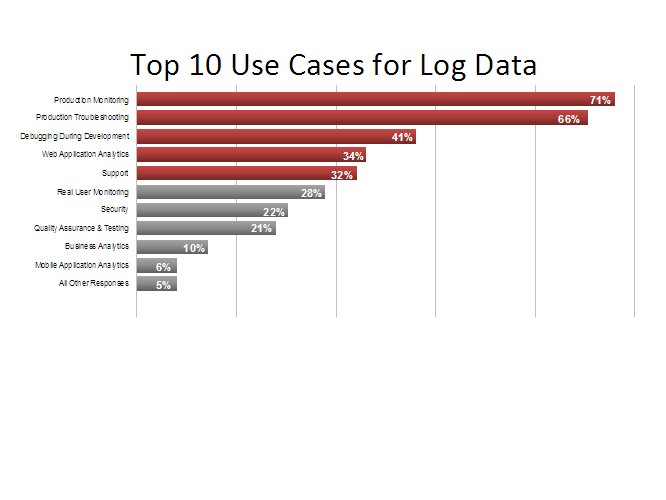
    While log data has traditionally been used by developers for debugging purposes (i.e. investigating exceptions stack traces), more recently log data is being applied for a much wider set of use cases.  A recent survey carried out across a sample of 25,000 log management users shows a breakdown of the following use cases:

    logos

    Results from a recent survey from a sample set across 25k users who were asked: “What are the top use cases for your logs?”

    As applications move across the different stages of maturity above, logs act as a valuable tool to assist with the insights required by the different stages of the DevOps lifecycle – e.g., during development activities, testing, production monitoring, and web and business analytics. In fact, logs provide a single data stream that can act as a common language across these different tasks.

    Because of this shift, it is important to look at how logs can be applied to assist with DevOps-related responsibilities during the different stages of application maturity:

    How logs are applied during application maturity stage 1

    The ability to apply agile development and testing are key during this phase such that early prototypes are iterated upon and hypothesis proved out:

    Logs as a debugging tool: Logs have always been a valuable debugging tool and continue to be so. They can capture events at different severity levels from every layer of the software stack (operating systems, web servers, databases, your software) and from across all devices (mobile devices, servers, routers, firewalls). During development, verbose logging can be enabled to give incredibly detailed information on the system as it executes. Today’s log management technologies are particularly useful as they allow you to utilize the benefits of verbose logging to easily cut through the noise and identify key events when exceptions occur. They also all allow for fast searching of key events in an extremely large volume of log data.

    Logs for system load and performance testing: Before a system goes live, system load and performance testing is often performed to give a level of confidence that real-world loads can be handled by the application. Load testing tools will often measure system response times to make sure that the system is performing well even under heavy loads. However, log data should also be analyzed during such tests to make sure high levels of exceptions are not being thrown and that the system is behaving “under the hood” as expected.

    How logs are applied during application maturity stage 2

    Production monitoring and troubleshooting can be a key focus during this stage of a system’s maturity given that any downtime can be particularly costly from a monetary and reputational perspective once a system goes live.

    Log for production monitoring: Production monitoring is fast becoming a leading use case for log data. Real-time processing capabilities of log management solutions now mean that log events can be parsed in real time, and important metrics can be extracted and visualized in high-level monitoring dashboards. Furthermore, real-time alerting can be applied to give notifications when important system events occur or particular thresholds are breached.

    Logs for production troubleshooting: Logs no longer simply contain exceptions and stack traces but are instead a blend of information from a range of different sources that can be correlated to allow for quick troubleshooting. This is especially important when there are issues in production. For example, logs will regularly now contain: server resource usage information, application performance metrics, feature usage information, exceptions and errors. This blend of information, which was traditionally only available by utilizing a number of other tools, is now available in a single location via a standard log management solution.

    How logs are applied during application maturity stage 3

    When an application begins to create value, product and marketing stakeholders will want to focus on usage and business metrics. While this information may go beyond the typical DevOps lifecycle, it is becoming more and more common for developers following a DevOps methodology to be tasked with gathering such information.

    Logs for web analytics: Analyzing website trends is not something typically associated with someone in a DevOps role and is usually the mainstay of marketing folks. However, developers are often engaged to collect this data for different parts of the organization. Logs provide a lightweight way to understand who is accessing an application, how often and from where. For starters, a lot of this information is already contained in web server logs without any additional instrumentation required. Furthermore, logs can give not only an aggregate view of web trends, but also allow the drill down to a per-user view to analyze behaviors at an individual user or account level.

    Logs for business metrics: Today’s log management technologies allow you to extract field-level values and can aggregate them and roll them up into high-level metrics dashboards. Thus,,logs can be used to not only understand a systems performance and usage trends, but also to aggregate business metrics such as signups per day, number of transactions, the value of those transactions, etc. However, the real benefit of using logs for metrics dashboards, in my opinion, is that they maintain the evidence. In other words, they allow you to easily validate any trends or changes in your system or business’ behavior. This has traditionally been a painful task, as it often involves engineering cycles/checking database tables, etc. Now, logs allow you to immediately drill down from a high-level view to the log-level to quickly view and understand the individual events that may have led to a spike in a key performance indicator.

    After spending many years talking to thousands of log management users, I am continuing to see logs become more and more critical to the different stages of an application’s maturity. The DevOps movement has greatly assisted with this because the same team or individual responsible for initial prototype development may also be responsible for production monitoring or gathering business metrics for that matter.  The value of logs is now being recognized early in the DevOps lifecycle, and the power of log data is quickly expanding across a range of different functions.

    This article is by Trevor Parsons, PhD, Co-founder and Chief Scientist, Logentries