Tag: logs

  • Observe Inc. Adds Tool for Exploring Distributed Traces

    Observe Inc. Adds Tool for Exploring Distributed Traces

    Observe Inc. this week added a Trace Explorer tool to its namesake observability platform that makes it simpler to search, analyze and visualize billions of traces.

    Traces are being used with greater frequency to track how resources are being invoked across increasingly distributed computing environments. That capability provides DevOps teams with a level of insight into workflows that goes well beyond the logs and metrics that almost every IT team routinely collects.

    Observe Inc. CEO Jeremy Burton said the challenge now is providing IT teams with tools that make it simpler to affordably manage traces at scale to reduce mean time to remediation (MTTR). The Observe platform enables IT teams to store the traces they run in a data lake from Snowflake for 13 months versus other platforms that only store a trace for a few days, which then requires IT teams to rerun the same trace multiple times each time they launch an investigation.

    The overall goal is to encourage DevOps teams to launch more investigations to improve application performance by making traces readily available using low cost S3 storage from Amazon Web Services (AWS) that is accessed via the Snowflake data lake that makes it simpler to apply artificial intelligence (AI) to telemetry data.

    That approach makes it economically feasible for DevOps teams to not just resolve an incident but also provide the level of investigation required to accurately identify its root cause, said Burton. Because the cost of storing telemetry data is so high, DevOps teams that employ other observability platforms are not able to thoroughly investigate incidents because they lack access to telemetry data that their organization decided not to store because of cost concerns, he added.

    Most organizations are still mastering the nuances of observability platforms that enable them to query telemetry data that, in addition to being easier to collect using open source OpenTelemetry agent software, is also increasing in volume thanks to the rise of microservices-based applications. Each microservice now generates its own telemetry data that needs to be analyzed and stored. As microservices make application environments more complex, the need for tools to analyze all that telemetry data becomes more pronounced.

    As businesses become more dependent on software to operate, it’s now more than apparent that legacy approaches to monitoring IT metrics are no longer sufficient, said Burton.

    It’s not clear how quickly organizations are adopting observability platforms, but there is already no shortage of options. Given the current state of funding for startup companies in the IT industry, IT teams would be well-advised to research the level of funding the providers of these platforms have before deciding which vendor to rely on, noted Burton. Last year, Observe Inc. raised an additional $50 million in funding.

    Regardless of the observability platform selected, the one thing that is certain is that observability platforms infused with AI are changing the way IT is managed. The issue IT teams often encounter now is convincing the organization to fund the acquisition of these platforms at a time when budget resources in many organizations are already being stretched thin.


  • Cisco Extends Scope and Reach of Observability Platform

    Cisco Extends Scope and Reach of Observability Platform

    Cisco this week expanded the scope of its observability platform by adding predictive and generative artificial intelligence (AI) capabilities along with log analytics and a Core Web Vitals tool to make it simple to ensure web pages don’t lose their search engine ranking because of poor user experience.

    In addition, Cisco is now leveraging extended Berkeley Packet Filters (eBPF) in the kernel of Linux operating systems to provide visibility into Kubernetes workloads and a session replay capability for cloud-native applications. In addition, Cisco has allied with Komodor, a provider of a Kubernetes management platform, to gain additional visibility into these environments.

    Cisco also added digital experience monitoring (DEM) capabilities based on real user monitoring (RUM) and the full-stack observability it provides following its recent acquisition of Accedian, a provider of an analytics platform for monitoring end-user experiences.

    Finally, Cisco added a Data Security Posture Management (DSPM) Observability module to the company’s Business Risk Observability platform based on the same core platform.

    Announced at a Cisco Live EMEA event, these latest updates are part of an ongoing Cisco effort to extend the reach of its observability platform well beyond DevOps workflows.

    Gregg Ostrowski, executive CTO for Cisco AppDynamics, said as part of that effort, Cisco is making it simpler to aggregate telemetry data for the AI for IT operations (AIOps) capabilities it provides by pulling directly from platforms such as Cisco ThousandEyes and Cisco DNA Center as well as from third-party partners such as VMware, Zabbix and ServiceNow. Similarly, Cisco is now leveraging eBPF to collect data from Kubernetes environments.

    Ostrowski added that the overall goal is to reduce the amount of instrumentation effort that IT teams would have to undertake to instrument highly distributed IT environments.

    There will still be a need to instrument applications, but the collection of telemetry data from the underlying IT infrastructure environment is going to be increasingly automated, he noted. In the meantime, it’s become less expensive to instrument applications using open source OpenTelemetry agent software, added Ostrowski.

    In general, Cisco, in addition to enabling organizations to rationalize existing tools, is also making a case for improving collaboration by, for example, making use of natural language capabilities enabled by generative AI to launch queries and provide summarizations.

    At the same time, Cisco is partnering to add additional capabilities, such as the ability to monitor machine learning algorithms via an alliance with Aporia and AS/400 systems via an alliance with Perform IT.

    Ultimately, Cisco is betting that observability across the entire enterprise IT environment is going to become more unified as organizations increasingly look to correlate business processes with specific IT events, including indications of cybersecurity breaches. It’s not clear how far down that path enterprise IT organizations are just yet, but given the total cost of observing and monitoring IT environments today, there is more pressure than ever to find more cost-effective approaches to holistically managing IT. The challenge, as always, is unifying all the existing fiefdoms in IT organizations that have already embraced a wide variety of tools and platforms they are hesitant to give up.

  • Observe Inc. Brings Generative AI to Observability

    Observe Inc. Brings Generative AI to Observability

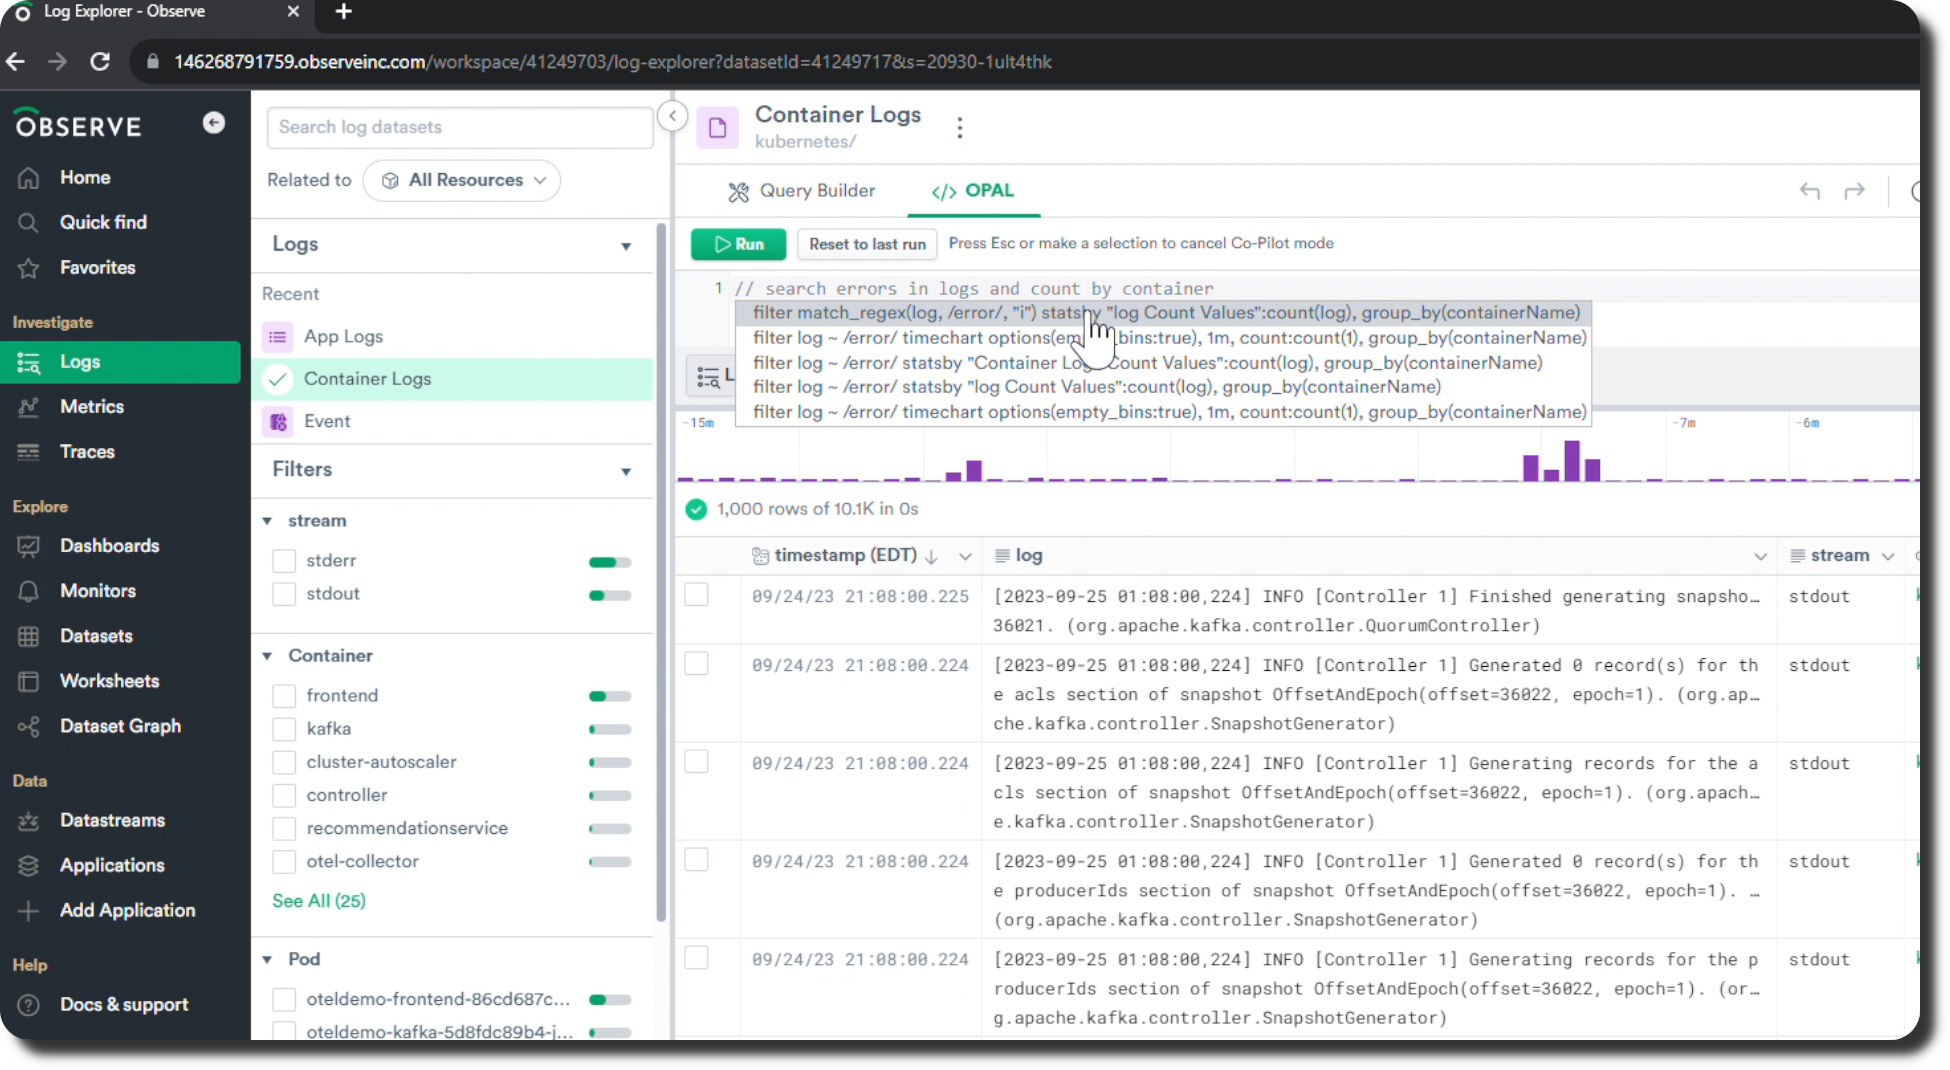
    Observe, Inc. today revamped the Hubble user interface to its observability platform that has been infused with generative artificial intelligence (AI).

    Fresh from raising an additional $50 million in funding, Observe CEO Jeremy Burton said as the company’s software-as-a-service (SaaS) platform continues to be infused with AI using multiple large language models (LLMs), it’s becoming apparent that observability is rapidly becoming democratized.

    Most IT organizations still rely primarily on legacy monitoring tools to track a set of predefined metrics. Observability platforms have arisen to aggregate metrics, logs and traces to enable DevOps teams to launch queries and surface the root cause of performance issues or IT incidents. The challenge is that most observability platforms have required IT teams to master a proprietary query language such as Observe’s RegEx.

    However, with the rise of generative AI tools, it is now possible for IT professionals of all skill levels to employ a natural language chatbot to generate a RedEx query, noted Burton. A RegEx generation tool also parses data to add structure to logs on-the-fly, and there is also an OPAL Co-Pilot that generates OPAL code in response to natural language inputs.

    Observe

    The Hubble interface furthers those capabilities by simplifying the onboarding experience anytime there is a new member added to an IT team, he added. Hubble also expands the range of data access options available, including a public application programming interface (API), a command line interface (CLI), export to CSV and data sharing to the Snowflake cloud platform.

    IT teams are also coping with an explosion of telemetry data generated by modern distributed applications based on microservices architectures. Legacy observability and monitoring tools were not designed for these data volumes, so when there is an incident, the mean-time-to-resolution (MTTR) is increasingly extended. In contrast, the Observe platform now features a ‘Live’ mode that enables data to be queried in 20 seconds or less from when it was created.

    Other capabilities include an assistant embedded in Slack to help users troubleshoot issues and summarize threads for incident response.

    While it’s still early days as far as the adoption of observability platforms are concerned, there is already no shortage of options. The pending acquisition of Splunk by Cisco next year will cause more organizations to reevaluate their IT management options, so the pace at which organizations are transitioning to cloud-hosted observability platforms should increase, noted Burton. Even after the merger is completed, it might be several more months before Cisco integrates its AppDynamics platform with the observability platforms that Splunk added to its IT operational analytics platform, he added.

    In the meantime, IT environments are only going to become more complex. It won’t be feasible for most IT teams to manage highly distributed computing environments without some help from AI. The challenge, as always, will be finding the budget dollars needed to deploy an observability platform before the number of increased IT incidents makes the need for one painfully obvious.

  • Mezmo Simplifies Management of DevOps Telemetry Data

    Mezmo Simplifies Management of DevOps Telemetry Data

    Mezmo has added additional capabilities to streamline the flow of telemetry data within DevOps workflows as part of an effort to make it simpler to surface insights and reduce the total cost of observability.

    The company has also added integrations with more data sources to the Telemetry Pipeline platform, along with controls that make it simpler to optimize data storage and usage. For example, an Events-to-Metrics Processor capability identifies and extracts metrics from logs to make them easier for third-party tools to consume.

    Mezmo CEO Tucker Callaway said these additions collectively make it simpler to surface insights that will make DevOps workflows more efficient. Previously, the company added capabilities such as rollback and redeploy, sequential parsing, error history management and data sample management to enable DevOps teams to manage telemetry data more efficiently.

    In effect, Mezmo is making it easier to apply engineering best practices to the massive amounts of telemetry data generated across DevOps workflows, he noted.

    No one knows for certain if all that data will require the addition of data engineers to DevOps teams, but as DevOps continues to evolve, it’s clear there is a need to cost-effectively manage data at scale. DevOps teams that embrace observability are quickly discovering that storing logs, traces and metrics for an extended amount of time can quickly become cost prohibitive. Naturally, there’s a lot more sensitivity to those costs during challenging economic times.

    In theory, of course, various forms of artificial intelligence should automate data engineering best practices, but in the meantime, there simply isn’t enough data engineering expertise available. The need for a platform to optimize the flow of telemetry data across DevOps workflows is becoming more acute.

    It’s not clear how quickly DevOps teams are embracing observability, but it’s clear that relying on predefined metrics to monitor IT environments is no longer sufficient. DevOps teams need to be able to query telemetry data to, for example, identify bottlenecks created by dependencies between microservices. Resolving those issues can’t be slowed down by a lack of data to query. Most problems can usually be traced back to a recent update to an application, but there are always going to be some issues that require access to historical data. That historical data should be quickly and easily available, especially since application downtime directly equates to lost revenue for many organizations.

    Observability, regardless of cost, is rapidly becoming a requirement for DevOps teams’ success as application environments become more complex in the cloud-native era. Dependencies between the microservices that make up those applications are too difficult to track and analyze without the aid of an observability platform. The challenge is not every observability platform provider is equally concerned about how much it costs to store all that data. Striking the right balance between the amount of telemetry data collected and the cost of storing it has become a much larger concern.

  • Datadog Updates Aim to Improve Logging, Testing Efficiency

    Datadog Updates Aim to Improve Logging, Testing Efficiency

    At its recent DASH 2023 conference, Datadog revealed Flex Logs and Intelligent Test Runner, two major new capabilities aimed at improving logging and testing efficiency for engineering teams.

    Omri Sass, director of product management at Datadog, said Flex Logs introduces a new middle tier of log storage between real-time querying and cold archives. As Sass explained, this provides a cheaper option for retaining logs beyond the typical two weeks for occasional analytics and investigations. By decoupling storage from compute for reading logs, teams can independently scale each based on their needs. This enables retaining rich log data for months or years to uncover long-term trends, he said.

    In addition, Sass noted that Flex Logs helps address common log analysis limitations around storage costs and rehydrating archives. The feature better aligns log pricing with specific use cases beyond just troubleshooting. According to Sass, this evolution in log storage tiers will likely shift more logs from legacy on-premises systems to its cloud platform.

    The second capability, Intelligent Test Runner, leverages observability signals to optimize CI test suites. As Sass explained, comprehensive test automation in CI pipelines often increases deployment times and flakes. Intelligent Test Runner inspects code changes to determine associated tests, ignoring irrelevant ones, which helps avoid long wait times for minor changes just to exercise unaffected areas.

    By tapping into existing telemetry around code commits, test health and runtimes, the feature adapts testing to each code modification. Sass explained that observability data has matured enough to enable real-time optimization like this. The end result is faster CI validation, so engineering teams can ship updates more rapidly.

    Sass highlighted how Flex Logs and Intelligent Test Runner are Datadog’s attempts to address real pain points developers face around managing log data life cycles and CI speed bumps. Sass said he believes this combination of depth in core disciplines like logs and application performance monitoring (APM), along with expanding into adjacent developer workflows, is key to solving these issues through innovation.

    Looking to the future, the observability space continues to evolve rapidly as emerging technologies and practices expand monitoring beyond traditional IT infrastructure. Companies handling modern workloads expect their observability platform to provide comprehensive visibility as development toolchains and architectures grow more complex, with the next generation of observability likely incorporating advanced analytics, automation and AI to help engineers tame systems at ever-increasing scale and speed. 

  • Webb.ai Launches AI-Based Continuous Root Cause Analysis

    Webb.ai Launches AI-Based Continuous Root Cause Analysis

    Webb.ai today opened an early access program access to a Continuous Automated Root Cause Analysis platform that uses artificial intelligence (AI) combined with a knowledge graph to dynamically keep track of and analyze changes to IT environments.

    Manish Gupta, CEO of Webb.ai, said the platform uses a mix of machine learning algorithms and generative AI capabilities based on large language models (LLMs) to aggregate alerts into higher-order insights that are presented in natural language to members of a DevOps team.

    That approach differs from legacy approaches because it tracks causal relationships between changes versus relying on probabilistic models that tend to create a lot of false positives, he noted.

    Webb.ai is also taking advantage of Kubernetes clusters to enable its platform to scale up and down as needed when analyzing data, added Gupta. That platform is also more efficient than other approaches to observability that require IT teams to store massive amounts of data. In contrast, the Continuous Automated Root Cause Analysis automatically surfaces anomalous events that DevOps teams can choose to save rather than requiring them to save all the metrics, logs and traces that would otherwise need to be tracked, he noted.

    Most IT incidents can be traced back to the most recent changes made to an IT environment. The challenge is as IT environments have become more complex, it’s not feasible for humans to keep track of those changes without relying on AI and a knowledge graph, said Gupta.

    As businesses become more dependent on software to drive digital processes, the cost of downtime is exponentially increasing. The need to identify the root cause of an IT incident as fast as possible has become a critical requirement, he added.

    Webb.ai doesn’t see AI technologies replacing the need for DevOps professionals and site reliability engineers (SREs) for at least another 10 to 15 years. In the meantime, many tasks that today are completed manually will be increasingly automated, said Gupta. A DevOps engineer dragged out of bed at 2:00 A.M. to address an issue does not want to have to sift through alerts. Instead, generative AI tools will summarize the issue at hand with recommendations on resolving it, noted Gupta. In effect, DevOps teams will be augmented by AI so they can manage IT environments at even higher levels of scale, he said.

    There is always going to be some sense of fear and loathing when it comes to AI, but ultimately, AI should reduce the burnout rates that today adversely affects any organization’s ability to retain DevOps professionals. Far too much time is spent trying to identify the root cause of a slowdown in a cloud-native application’s performance that could be caused by any number of issues involving one dependency or another. The frustrating thing, of course, is that while it may take days to identify the root cause of an issue, it often takes just a few minutes to resolve.

  • Mezmo Adds Free Community Plan for Managing Observability Data

    Mezmo Adds Free Community Plan for Managing Observability Data

    Mezmo this week added a free trial and a community plan for the Mezmo Telemetry Pipeline service to make it simpler for DevOps teams to store and manage the large amounts of telemetry data they are collecting.

    Mezmo CEO Tucker Callaway said as more DevOps teams embrace observability to minimize disruptions to application environments, they are struggling to manage the explosion of data being created. The Mezmo platform makes it possible to apply data engineering best practices to manage that data using a set of drag-and-drop visual tools, he added. A set of data transformation tools also makes it simpler to extract metrics embedded in the logs, summarize events and metrics and then forward those metrics to downstream platforms for analysis.

    The free edition of the platform makes it possible for organizations to begin to apply those capabilities without any upfront costs required, noted Callaway.

    It’s not clear to what degree DevOps teams may need to add data engineering to manage all the telemetry data being collected. It’s already apparent that the cost of storing and managing all that data is becoming a significant issue as more applications are instrumented. In fact, it’s nearly impossible to manage cloud-native applications without being able to observe interactions between the microservices used to construct them.

    Log management has always been a challenge, but with the addition of traces, the amount of telemetry data being collected to surface metrics has increased. The Mezmo platform makes it possible to set a daily or monthly hard limit on the volume of logs stored or, alternatively, set soft daily or monthly quotas that can apply throttling logic to ensure mission-critical log data will continue to flow.

    DevOps teams can also make use of soft limits to reallocate storage resources from one team to another based on how much log data might be generated for a specific amount of time.

    Reducing storage costs has naturally become a higher priority during challenging economic times, so there’s a lot more pressure for DevOps teams to be more efficient. Finance teams are reducing costs by, for example, applying quotas to the amount of storage resources being made available to individual DevOps teams. The days when cloud storage resources were made available indiscriminately are over.

    It’s not clear how quickly DevOps teams are embracing observability, but it is certain that relying on predefined metrics to monitor IT environments is no longer sufficient. DevOps teams need to be able to query telemetry data to, for example, identify bottlenecks that are often created by dependencies between microservices. The issue is striking a balance between the amount of data being collected and the cost of storing it all.

    Regardless of approach, observability is rapidly becoming a requirement for DevOps teams to succeed. In fact, there is already no shortage of observability platforms to choose from. The issue is that not every observability platform provider is equally concerned about the cost of storing all the data being collected.