Tag: KPIs

  • Tasktop Adds Dashboard to Surface VSM Insights

    Tasktop Adds Dashboard to Surface VSM Insights

    Tasktop today unveiled a dashboard that it promises will simplify tracking of key performance indicators (KPIs) spanning multiple projects.

    In addition, the value stream management (VSM) platform provider revealed it has garnered an additional $100 million in funding.

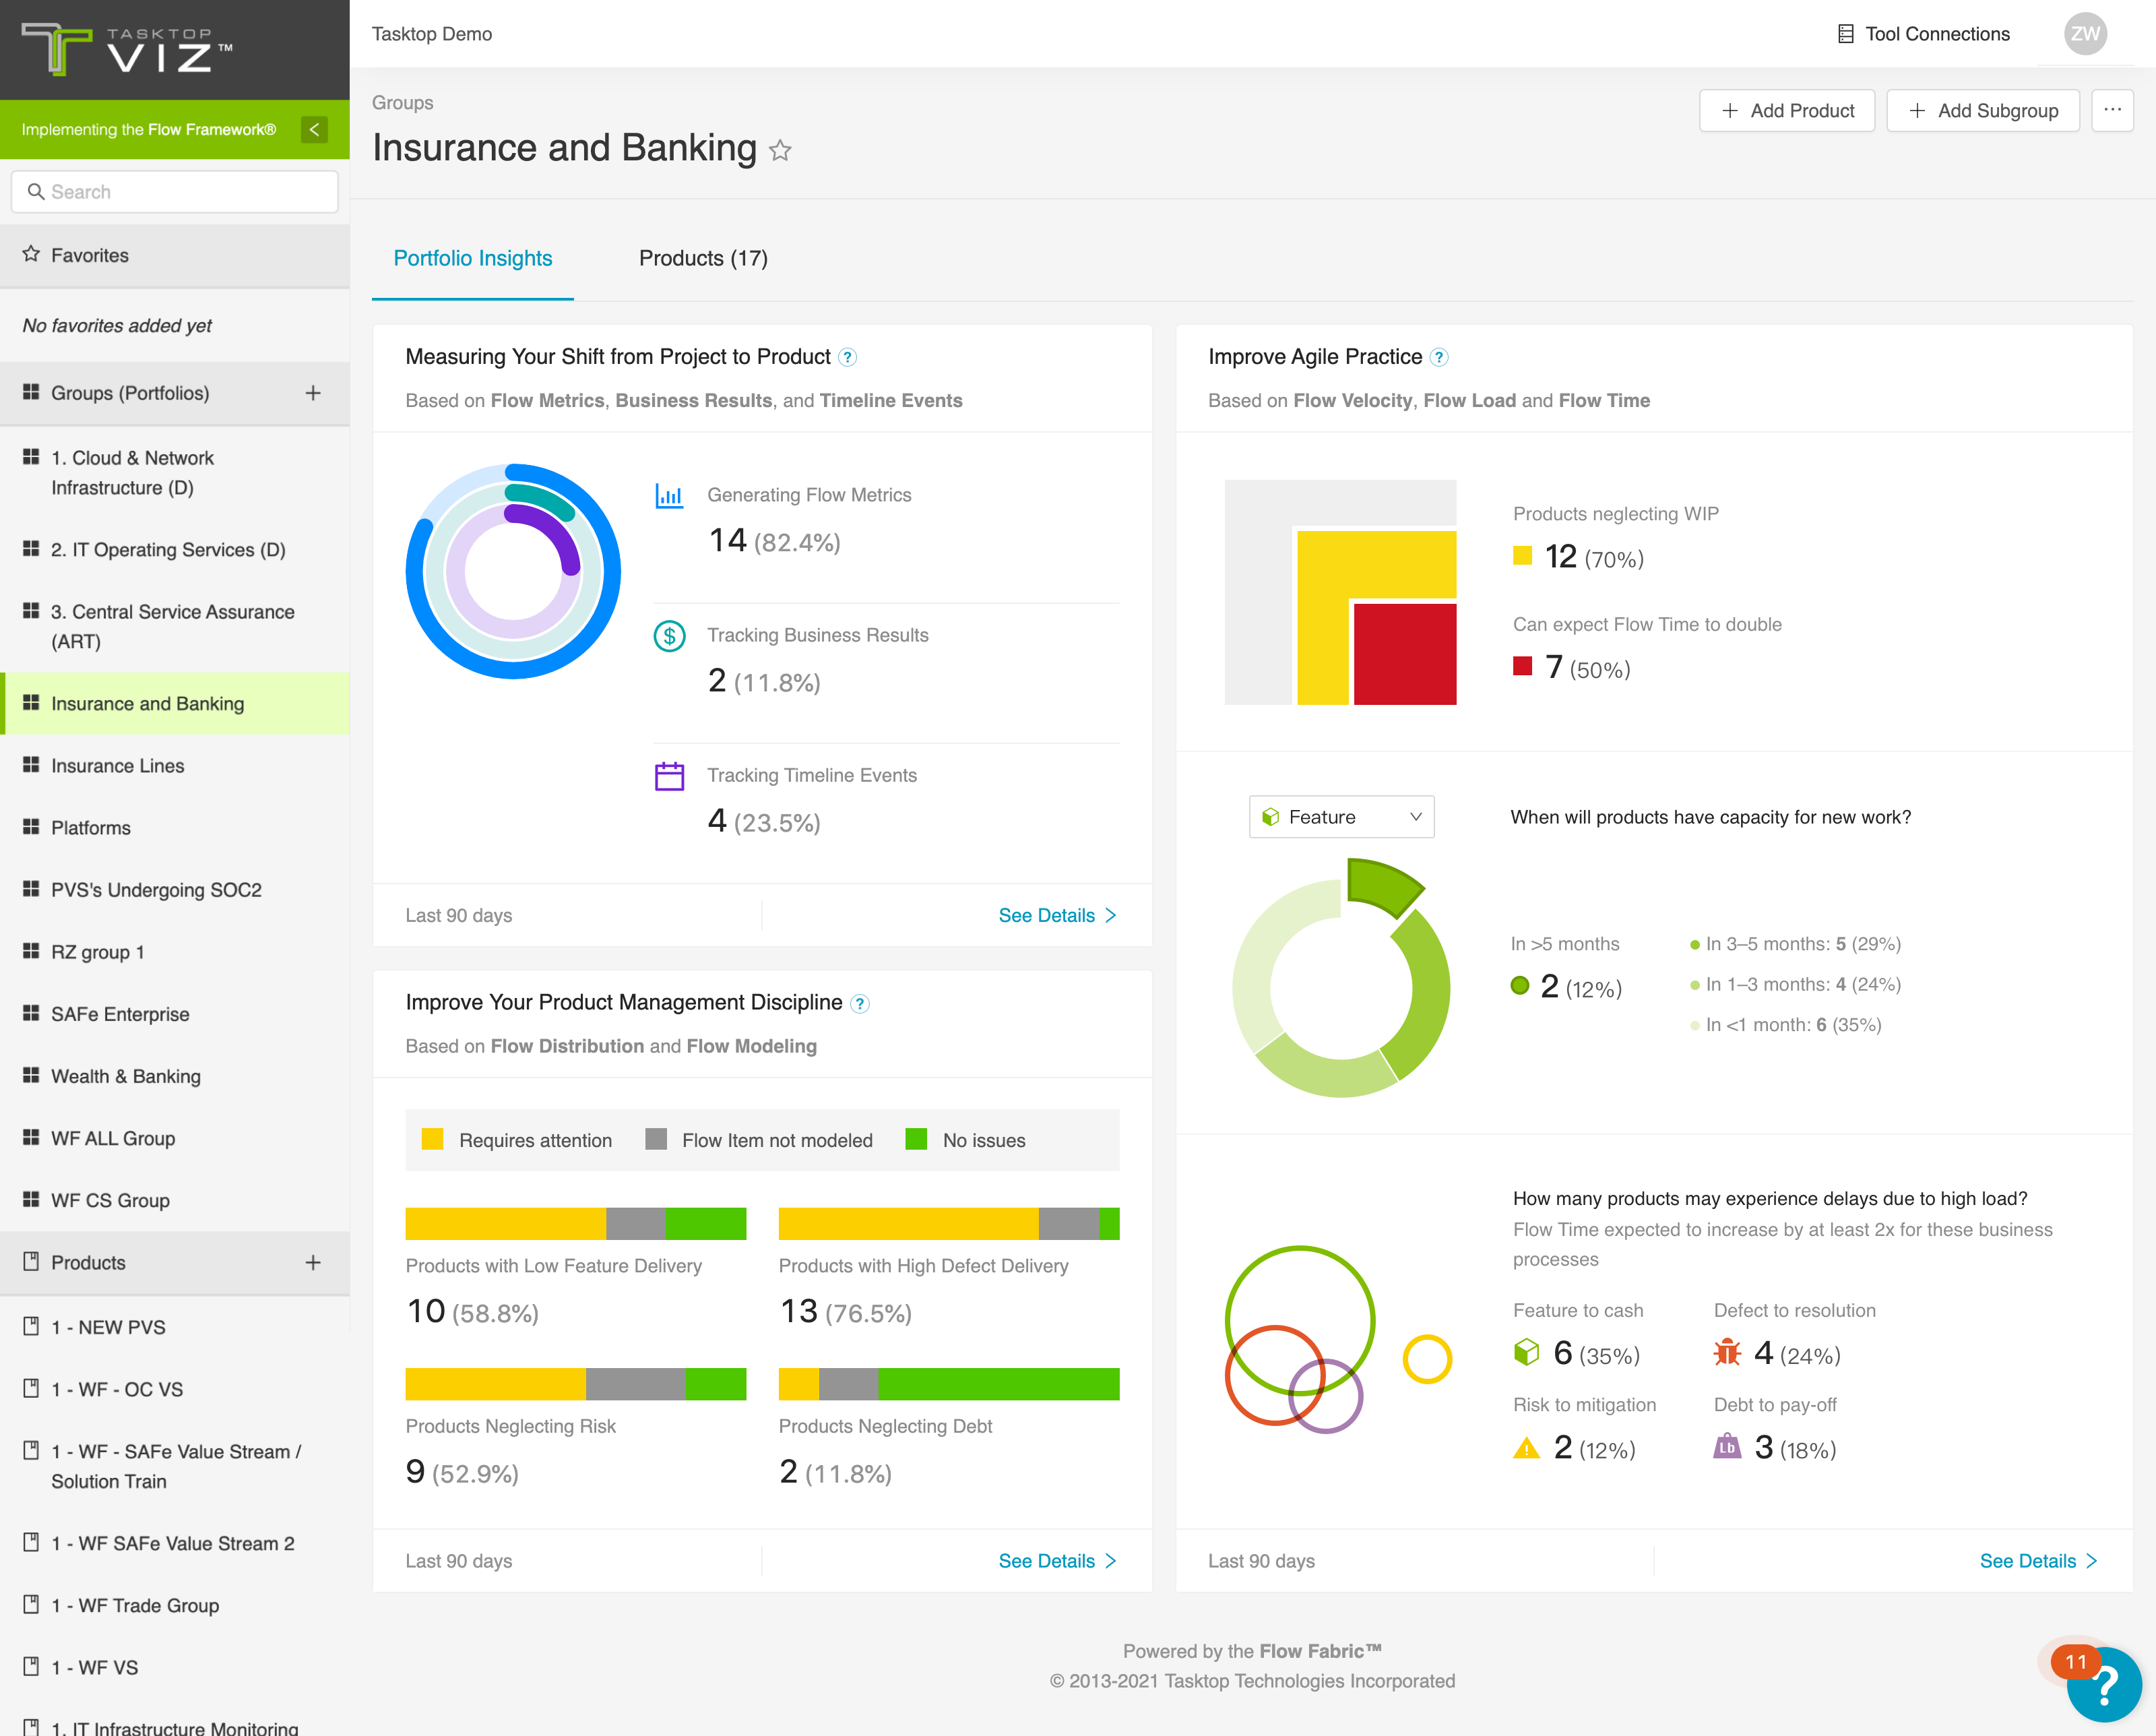
    Tasktop CEO Mik Kersten said the Tasktop Viz VSM Portfolio Insights dashboard makes it simpler to surface the insights that the company’s VSM platform aggregates as it collects metrics and analytic data from the tools and platforms that make up a DevOps workflow.

    Organizations are then better able to determine the impact any change to the rate at which an application is being developed will have on the business, noted Kersten. IT and business leaders can also more easily identify how constrained resources or persistent quality control issues might be adversely impacting those business goals, added Kersten.
    As a DevOps discipline, VSM is still relatively new. However, Tasktop claims more than half of the Fortune 100 employ its VSM platform. Customers include BMW, CGI, E*Trade and T-Mobile. Despite the economic downturn brought on by the COVID-19 pandemic, the company reports it saw a 30% increase in revenues driven mainly by organizations that have accelerated multiple digital business transformation initiatives. A recent Forrester Consulting Total Economic Impact Study indicated organizations realize a potential 640% return on investment over a three period after implementing the Tasktop VSM platform.

    Tasktop is also a founding member of the Value Stream Management Consortium, which is seeking to promote adoption of VSM platforms to close the divide that often exists between individual DevOps projects and the strategic business goals of an organization.

    The concept of value stream management traces its lineage back to lean manufacturing methods, which called for each step of a manufacturing process to be continuously measured. As software development has evolved from being a craft to a process that is automated as much as possible using DevOps best practices, the need to monitor the impact of, for example, missed software development deadlines on the business has become more acute as organizations appreciate just how dependent they are on software.

    VSM platforms automatically take technical metrics, gathered via a DevOps process, and match them to a set of key performance indicators (KPIs) defined by business leaders. The challenge many organizations still face is, first, making sure they have the tools in place to collect the appropriate technical metrics and then identifying the KPIs that truly matter to the business. Once those metrics are gathered and KPIs established, organizations are able to apply advanced analytics to optimize allocation of resources that include people, platforms and processes, noted Kersten.

    It may be a while before VSM becomes pervasively applied with organizations. However, those organizations that find a way to consistently deliver quality applications, on time, that have a greater impact on the business will inevitably start to outperform rivals. The challenge and the opportunity is to bring a level of discipline to bear that ensures that goal is always achieved.

  • Measuring the Business Benefits of AIOps

    Measuring the Business Benefits of AIOps

    Staffing levels within IT operations (ITOps) departments are flat or declining, enterprise IT environments get more complex by the day and the transition to the cloud is accelerating. Meanwhile, the volume of data generated by monitoring and alerting systems is skyrocketing, and Ops teams are under pressure to respond to incidents more quickly.

    Faced with these challenges, companies are increasingly turning to AIOps – the use of machine learning and artificial intelligence to analyze large volumes of IT operations data – to help automate and optimize IT operations. But before investing in a new technology, leaders want assurances that it will bring value to end users, customers and the business at large.

    Leaders looking to measure the benefits of AIOps and build KPIs for both IT and business audiences should focus on key factors such as uptime, incident response and remediation time and predictive maintenance to prevent outages that could affect employees and customers.

    AIOps KPIs include employee productivity, customer satisfaction and web site metrics such as conversion rate or lead generation. AIOps can help companies cut IT operations costs through automation and rapid analysis; it can support revenue growth by enabling business processes to run smoothly and deliver excellent user experiences.

    Specific IT and Business Benefits

    AIOps can digest operational data and spit out actionable recommendations for keeping important systems running at peak efficiency. These are the most-cited benefits of the technology:

    • Alert management: In most cases, the first problem AIOps systems will address is reducing the volume of noise: the torrent of alerts that inundate IT operations. AIOps uses clustering and pattern matching algorithms to eliminate as much as 90% of false alarms and other redundant or irrelevant alerts, making it far easier for staffers to focus on what really matters.
    • Incident prioritization and routing: AIOps systems can learn, over time, which types of alerts should be sent to which teams, reducing redundancy and confusion when, say, networking and database teams both get the same alert related to an incident.
    • Event correlation: AIOps can correlate alerts and event data to identify the root cause of an outage or application slowdown so that IT teams can respond faster.
    • Advanced anomaly detection: AIOps systems can identify anomalies to proactively detect abnormal conditions and relate them to business impact. For example, AIOps can predict if a system will run out of disk space based on projected growth or seasonal patterns, even if the growth is non-linear. Or, if there’s a sudden increase in the number of failed server requests, the technology can determine whether the server in question is handling a mission critical task or simply performing routine backups.
    • Automation: AIOps can be used to handle routine tasks such as backups, server restarts and other low-risk maintenance activities which otherwise involve heavy manual effort.
    • Predictive analytics: A more advanced use case could involve predicting events before they happen – such as detecting when network bandwidth is reaching its limit or storage capacity is nearing threshold.

    Seven KPIs for AIOps

    These common KPIs can measure the impact of AIOps on business processes:

    1. Mean time to detect (MTTD): This KPI refers to how quickly it takes for an issue to be identified. AIOps can help companies drive down MTTD through the use of machine learning to detect patterns, block out noise and identify outages. Amid an avalanche of alerts, ITOps can better understand the importance and scope of an issue, which leads to faster identification of an incident, reduced downtime and better performance of business processes.
    2. Mean time to acknowledge (MTTA): Once an issue has been detected, IT teams need to acknowledge the issue and determine who will address it. AIOps can use machine learning to automate that decision-making process and quickly make sure that the right teams are working on the problem.
    3. Mean time to restore/resolve (MTTR): When a key business process or application goes down, speedy restoration of service is key. ITOps plays an important role in using machine learning to understand if the issue has been seen previously and, based on past experiences, to recommend the most effective way to get the service back up and running.
    4. Service Availability: Often expressed in terms of percentage of uptime over a period of time or outage minutes per period of time, AIOps can help boost service availability through the application of predictive maintenance.
    5. Percentage of automated versus manual resolution: Increasingly, organizations are leveraging intelligent automation to resolve issues without manual intervention. Machine learning systems can be trained to identify patterns, apply solutions, such as previous scripts that were executed to remedy a problem, and take the place of a human operator.
    6. User Reported versus Monitoring Detected: IT operations should be able to detect and remediate a problem before the end user is even aware of it. For example, if application performance or web site performance is slowing down, ITOps should get an alert when the issue can be measured in milliseconds; they can then fix the issue before the slowdown worsens and affects users. AIOps enables the use of dynamic thresholds to ensure that alerts are generated automatically and routed to the correct team for investigation, or automatically remediated when policies dictate.
    7. Time savings and associated cost savings: The use of AIOps, whether it’s to perform automation or more quickly identify and resolve issues, will result in both operator time savings and business time-to-value improvements. These have a direct impact on the bottom line.

    These seven AIOps KPIs can be correlated to business KPIs around user experience, application performance, customer satisfaction, improved e-commerce sales, employee productivity and increased revenue. ITOps teams need the ability to quickly connect the dots between infrastructure and business metrics so that IT is prioritizing spend and effort on real business needs. In the future, as machine learning matures, AIOps tools may even recommend ways to improve business outcomes or provide insights as to why digital programs did or did not succeed.

  • Improving Mainframe Agility With DevOps

    Improving Mainframe Agility With DevOps

    Mainframe workloads were on the rise even before the coronavirus pandemic, and transaction-processing mainframes became vital as lockdowns went into effect and every aspect of business and personal life occurred online. Mainframes are reliable, secure, highly available and affordable, and it is essential for organizations to ensure their mainframe can achieve peak agility to enhance profitability and improve customer experience.

    There are four areas of focus for DevOps teams who want to improve mainframe agility: teamwork, cloud services, KPIs and automation. Let’s look more closely at each one.

    Encourage Teamwork Between DevOps and Mainframe Ops Teams to Improve Agility

    It’s vital that mainframe ops teams work seamlessly with DevOps teams to ensure adoption of best practices in both areas, where practical, and that those best practices are adhered to. No matter how skilled your DevOps team, they must always be open to learning from mainframe professionals, operational and cybersecurity experts.

    To truly empower everyone on your team to achieve maximum mainframe agility, mainframe code must translate within the larger, multi-platform DevOps toolchain. If DevOps and mainframe code are not in sync, mainframe code could slow down software development lifecycles. Important processes, such as diagnostics, test execution and source code need to be integrated to enable DevOps teams to achieve better productivity.

    Enterprise DevOps is shifting focus away from software development exclusively to encompass surrounding processes within organizations. Successful DevOps teams must be able to work with cybersecurity experts and mainframe ops teams throughout the coding life cycle to ensure that everyone is on the same page and applications are functioning optimally.

    Decide Whether to Move Entirely to the Mainframe or Integrate Cloud Services with On-Premises Mainframes

    Scaling your organization for growth by migrating entirely to the cloud is not necessarily the right choice for everyone. In some cases, moving away from the mainframe’s core systems can be costly and unnecessary.

    Cloud-based services don’t have to be eliminated entirely, either. The cloud can and should be used for business processes that could benefit from real-time data updates, easy team collaboration and seamless integration with other software and tools. Mainframes excel at functions that require reliable, secure transactions.

    Whatever decision your organization makes, it must be communicated and agreed to at all levels. A customer-centric approach is ideal here, where the needs of the business are considered, but a seamless customer experience is prioritized.

    Establish Measurable KPIs

    Achievable and measurable key performance indicators (KPIs) are essential to monitoring your progress as an organization. KPIs for mainframe functionality usually include an availability rate of 99.999%, which roughly translates to downtime of less than 5.6 seconds per year. KPIs also generally measure time windows for batch completions. Software delivery velocity, efficiency and quality should be evaluated, but make sure you’re not prioritizing one of these metrics at the expense of another.

    There are more nuanced goals that need to be prioritized, too. Continuous improvements in software delivery are harder to quantify, but no less important. By fostering a collaborative environment where communication is key and teamwork is valued, your organization can create a better product or deliver better services for developers and customers.

    Use Automation Whenever Possible for Mainframe Agility

    Automated testing and AI-enabled processes can solve problems in real-time and free your DevOps teams to focus on larger issues. Mainframe ops teams can save their organizations money by relying on automated processes, which can also reduce personnel costs.

    Despite the benefits of automation, mainframe code is often removed from automated processes commonly applied to DevOps toolchains. Javascript, for instance, is one of the most commonly used programming languages due to its platform independence. It’s an essential tool for DevOps developers to enable the smooth configuration and installation of applications.

    But as infrastructures grow more complicated and surface areas expand to accommodate more users, operations teams can feel overwhelmed. With the continuous pressure to create new and better software on accelerated timelines, DevOps teams can unwittingly introduce vulnerabilities in Javascript coding as they speed through the software development and delivery pipeline.

    Automated mainframe diagnostics and optimization tools are vital to improving both the customer and developer experience.  Comprehensive and accurate data presented to mainframe ops teams in real-time can detect vulnerabilities and to find and fix potential issues.

    Ultimately, the mainframe is here to stay, with 93% of software experts citing the strength, reliability and scalability of the platform. Mainframes form the backbone of most monetized applications and websites, so it’s no surprise that mainframe agility has become a top focus for many IT departments. No matter how sleek and flashy your application is, if customers have a bad experience at the transactional level of the process, it could mean lost sales.

  • Maintaining Exceptional Quality Despite Shrinking Delivery Deadlines

    Maintaining Exceptional Quality Despite Shrinking Delivery Deadlines

    My first article in this series focused on the need for continuous improvement across three key dimensions of software development–velocity, quality and efficiency. While these are all equally important, in this piece we’re going to focus more specifically on quality.

    The past few months—what you might call the summer of outages—have been troublesome for many of the internet’s biggest players. Google, Apple and Cloudflare, as well as Facebook, Twitter and LinkedIn, have all experienced bouts of unplanned downtime, sometimes even multiple bouts in quick succession. Is this all just a matter of coincidence and bad luck? Perhaps, but peeling back the layers reveals an increasingly painful reality of modern DevOps life.

    While the root causes of these outages were varied, several were blamed on software glitches. This suggests software rollouts may be happening before they are comprehensively battle-tested and ready for production-level systems. This is never a good idea, especially when you’re dealing with high-profile services supporting millions of users worldwide. In these cases, software-related stumbles are that much more damaging.

    When software is rolled out prematurely, a cardinal rule of development is broken in that we, the end-users, become the unwilling guinea pig for poor-quality applications. No matter the pace of rollouts, an unwavering focus on quality needs to be maintained, and automation, integration and measurement can be the keys to ensuring this.

    Automation

    Automation refers to a pre-programmed process that executes tasks with minimal human intervention. The more you automate, the higher your quality should be. Avoiding manual intervention decreases the likelihood of less optimal techniques or human mistakes, both of which can lead to poorer application quality and customer satisfaction. Essentially, automation enables the best techniques and practices to be quickly and easily replicated.

    Consider the example of automated unit and functional testing. If you can automate the execution of the best testing scripts incrementally across code units and functions, you can test more accurately, not to mention more quickly. The benefits will increase exponentially with the additional layers of testing you can automate. We recently worked with a customer who realized an overall ROI of 467% from their investment in automated unit testing.

    Integration

    Modern applications are increasingly componentized, spanning multiple platforms. Consider an e-commerce application, where the front-end may reside on a system of engagement (such as a web server) while the back-end transaction ultimately occurs on a system of record, such as a mainframe.

    High-quality, end-to-end digital services ultimately depend on all critical components being universally and automatically included and prioritized in DevOps pipelines. Similar to automation, this is because any time manual effort is introduced into the integration process, you increase the chances for error and consequently, the risk of a particular code segment lagging behind others.

    The end result? More defects making it into production in the sprint to the finish line. It’s like the famous I Love Lucy chocolate assembly line episode, which offers a humorous visual interpretation of the chaos that erupts once human intervention is introduced into a process.  Ideally, seamless toolchain integrations, across multiple application-leveraged platforms, can be utilized to maximize quality outputs leveraging DevOps technologies you’re already using, such as JIRA, Jenkins and SonarQube.

    Measurement

    Improving quality depends on development teams constantly improving their methods. This can be achieved through ongoing measurement against key performance indicators (KPIs).

    The challenge is establishing relevant KPIs, and we have seen many development teams fail at this. The most effective KPIs are those that translate to real business impact. For example, “number of bugs released into production” is a commonly used metric, but it does nothing to convey the bottom-line cost of those bugs. A more effective metric would be the cost of resolving defects, with success being declared when the organization reduces the amount of money spent on fixing bugs.

    The cost of fixing a bug is much less when it takes place earlier in the software development lifecycle (for example, in the coding and unit testing phases) than when the software is near or already in a production state. When a development team can consistently show it is reducing costs through earlier identification of bugs, this puts them in a stronger position to justify investments in better testing and analysis tools.

    Conclusion

    We’ve long known about the challenges DevOps teams face to balance velocity and efficiency with a high degree of software quality. It’s like asking a circus performer to sprint across a tight rope. It may seem unfair, but the need to release high quality software faster and faster, while staying within budget, is not going to abate any time soon.

    The recent spate of outages has taught us that even the biggest and the strongest in the industry are not immune to immense speed pressures, and the quality stumbles that often result. Automation, integration and measurement can help development teams in their ongoing quest to meet the seemingly conflicting requirements of improving quality, velocity and efficiency—at the same time.

    — Rick Slade

  • DevOps Tools Democratize the View From Both Sides

    DevOps Tools Democratize the View From Both Sides

    How modern product decisions platforms marry the key metrics of features changes to organizational KPIs

    In 1967, Joni Mitchell released one of her most iconic songs, “Both Sides Now.” The song was inspired by the book, “Henderson the Rain King,” in which author Saul Bellow writes about flying to Africa and looking out the plane window, “Look at those clouds down there; it’s very strange to look at the clouds from up above them. I remember as a boy having dreamed up at clouds a lot and having seen the cloud from both sides now, I suppose I shouldn’t really be amazed by anything.”

    Although not her intention and slightly before its time of popularity, the song speaks quite accurately to the tensions between idealized DevOps and the reality on the ground that many organizations are struggling through. On paper, the core tenant of DevOps is about cooperation, seeing problems and processes from multiple team members’ perspectives from each side, but this is easier said than done.

    “But now old friends they’re acting strange
    They shake their heads, they say I’ve changed
    Well something’s lost, but something’s gained
    In living every day.”

    The Unicorns and the Rest of Us

    Some of today’s most successful and disruptive companies—including Google, Netflix and Facebook—have taken their market-leading positions precisely because they have developed strategy and culture around DevOps. It has been part of the company DNA since the beginning and every employee is bought into it. This means fast, agile development and experimentation is part of the culture.

    While many companies would like to capture some of the benefits that unicorns have realized from implementing these development methodologies, for many, this simply is not an option. There is legacy infrastructure, processes and people—who are sometimes the hardest to change. Often DevOps is embraced in small pockets of a company, by teams with newer members working on new projects. The mindset shift that needs to happen to have DevOps—and everything that comes along with it—become part of a company’s culture takes time, commitment and perseverance. However, a good way to start is by demonstrating the fresh, diverse perspectives that can be gained through experimentation and progressive exposure to encourage wider adoption.

    Leveling Up

    One of the ways modern app delivery, operations and business management teams at organizations all along the adoption spectrum are achieving governance, operational awareness and control at speed is by wrapping new code deployments in feature flags and using a centralized platform to control progressive exposure to users.

    By themselves, feature flags are not new. What is new is the centralized and externalized control plane as a service and, newer still, the idea of observing system and business KPIs at the user session or request granularity level for feature flag-controlled decisions.

    When something is rolled out to 5% of the users, it is not likely to light up global ops or business metrics dashboards, even if it is a bit broken—and that makes people cranky. If instead, tools are in place to monitor the KPIs within that 5% population and compare it to the other 95% looking for divergence, you have a much more powerful early warning system.

    These new centralized platforms also extend observability to stakeholders beyond the few wizards driving orchestration and ops teams watching dashboards. An anti-pattern to the local control autonomy spiel modern DevOps patterns call for, this wider visibility protects against local optimization traps in which one team improves its KPI while degrading other KPIs it doesn’t know or care about.

    It can be beneficial to have the idea of key metrics tied to a feature and organizational metrics that look after larger organizational concerns. This inspiration can be traced back to what LinkedIn does with its XLNT experimentation platform, where it calls the organizational metrics “guardrail KPIs.” By always tracking a set of metrics that are critical to the business as a whole, organizations gain a clearer view of the impact that both the granular updates and the larger rollouts are making to the business.

    As Joni said in all her wisdom:

    “I’ve looked at life from both sides now
    From up and down, and still somehow
    It’s life’s illusions I recall
    I really don’t know life at all.”

    No team or organization can know everything all the time, but we can build in visibility to the process of rolling out functionality to our users and create a shared vision of our intentions and the results we achieve. I would argue that if you do look at DevOps from both sides, up and down, you will know the benefits.

    — Dave Karow

  • Digital Transformation: Measuring What Matters

    Digital Transformation: Measuring What Matters

    As enterprises strive to digitize their organizations, whether it’s digitally transforming aspects of sales and marketing, customer interactions or supply chain, they’re undergoing a wholesale revamp of traditional businesses into digital business models. While some companies are just getting started, as we covered earlier this month in Digital Transformation: Coming from Behind, the bulk of those enterprises that have already embarked on digital transformation efforts—70% according to some findings—fail to meet their objectives.

    How do enterprises flip such statistics around? We reached out to a group of experts to find out, and collected their thoughts on how organizations can attain better digital transformation results through better quantification of their efforts.

    It sounds simple enough, as Cyril Attia, CEO at BeMyApp puts it: Success should be measured in alignment with the key performance indicators (KPIs) of the business. He said, when advising his customers, he makes certain “one of the main focuses is to identify if these efforts are directly related to bringing in or maintaining clients which ultimately have an impact on the bottom line.”

    Stay Focused on Core Business Objectives

    Not staying focused on core business goals is at the essence of the challenge. “One of the reasons that digital business transformation is so ambiguous, and in an overall sorry state, is that the objectives are not clear,” said AgilePoint CEO Jesse Shiah. Organizations should make themselves clear about their desired outcomes and what it is they specifically seek to improve, he said, adding this is best achieved by tying digital transformation initiatives to key performance indicators that can best determine the health of the business.

    “Through your efforts, are you making progress against those goals, do you need to adjust course? Once you’ve found a successful formula, think about how that success can be replicated in other areas of the business,” he said.

    Kyle Hutchins, a senior director at business and technology consulting firm West Monroe Partners, agreed. The key to initial success is identifying the right KPIs, starting small, and proving out the viability of the idea, he said.

    “Success metrics should be tied to your overall business strategy and not live as a standalone set of KPIs. Once you have a short list identified, ensure you are tracking the progress and able to measure the impact,” Hutchens noted. “When you have a win, share the success broadly within the organization, tie (it) back to your digital vision and use that as an entry point into other areas of the business.”

    Shift to Value-Based Measures

    Dave West, CEO and product owner at Scrum.org contended that, when it comes to measuring digital transformation success, traditional motion metrics such as velocity, as well as efficiency on time and budget measurements, should be replaced with external value-based measures that will establish the baseline that the effectiveness of change will be measured against. “For each value stream or customer aligned team, the measures will be unique. For instance, value for one customer might be a net promoter score; for another, it might be direct revenue. However you measure value, there are three types of things that should be considered: current value, time to value and innovation,” he said.

    West defines current value as to how one directly measures the current value of your product and can include measures such as numbers of users, revenue, profitability and brand. While time to value ratios, how long it takes to deliver from an idea to its implementation? When it comes to measuring innovation, West says, innovation should be measured as the percentage of new stuff versus fixes/infrastructure being changed when a release is made.

    Attia added that such effective KPIs will indicate if outputs are being achieved faster or cheaper, ultimately decreasing overall costs and improving profits.

    Hutchins said there isn’t a single list of magical KPIs, and points to a set of questions (suggested by Gartner firm) designed to help create digital KPIs:

    • What is being measured?
    • Where are we today?
    • What is our target goal?
    • What is the desired business outcome or benefit?
    • What is our balance point?

    Craig Besnoy, program director and digital strategy consultant at Mindtree, has a straightforward way he suggests companies look to track their success. That’s by the internal popularity of the program. “Companies should track their success based on the number (of) departments in the organization that are requesting access to the digital transformation program,” he said. “Once the organization experiences the increased efficiencies and revenue that digital transformation can bring, managing the requests will be the biggest challenge.”

    — George V. Hulme

  • ‘DevOoops’ Moves: Poorly Defined KPIs

    ‘DevOoops’ Moves: Poorly Defined KPIs

    DevOps’ ultimate aim is to create efficiencies in the software delivery process. But, it doesn’t always work out that way. Sometimes DevOps initiatives lead to mistakes—something we lovingly call a “DevOoops.” CloudBees recently polled some colleagues and came up with five examples of a DevOoops in action. The following is a discussion submitted by product marketer Juni Mukherjee about poorly defined key performance indicators (KPIs).

    Scenario:

    How we define KPIs can change the game. For example, one quality engineering team defined the number of tests executed per sprint as a success metric. Humans are driven by incentives and the natural tendency of the team was to add more and more tests without even considering archival of outdated ones. Think of this: We could have a larger impact with fewer tests and, more importantly, fewer tests lower the test cycle time. So, instead of sheer quantity, we should focus on the coverage and effectiveness of tests. Similarly, a release engineering team defined the number of releases per sprint as a success metric. The number of releases reflects on velocity for sure. However, releases move bits from point A to point B without assessing the value added to business. It is critical to tie a business KPI (such as the number of new customers acquired, percentage of revenue increase, etc.) to velocity, such that we know we are investing in valuable speed and not suicidal speed.

    Management consultant Peter Drucker boiled his whole philosophy down to the following few words: “If you can’t measure it, you can’t improve it.”

    Successful DevOps leaders take this saying to heart. To understand where they’re going, how to get there and ultimately how far they’ve come, these leaders know how critical it is to establish KPIs that fit the overall objectives of their DevOps transformations. KPIs provide appropriate and continuous insight—and they plot a route to help you get to your destination.

    The big question is: Are you measuring the right things? If not, you could be spinning their wheels.

    To avoid this “DevOoops” scenario, you need to start by establishing KPIs that not only align to your objectives but can also be established so that they create a continuous feedback loop. As the project progresses, as you mature and learn more, you will likely need to maintain, monitor and possibly adjust and update these KPIs.

    What would be an appropriate test coverage goal? Teams all want to improve quality. But by how much? Seventy percent? Eighty percent? One hundred percent? This is an example of a KPI that needs to be considered in the context of your application as well as measured against your real objective.

    You can have 70 percent test or code coverage, but if that’s just treated as a measure to test as much code as possible, you may miss the mark. If you are covering 70 percent of the wrong code and the 30 percent that’s missing is critical code, you’ve put in significant effort with the risk of little or no return on quality level.

    In terms of your goals, increasing and monitoring test coverage may be an indicator of quality, but it may not measure your actual quality of work. In this case you want a KPI that’s measuring the outcome rather than the activity. Look at what is severity 1 and severity 2 defect rate in production. You can see code coverage get to 90 percent, but if you’re not seeing a decrease in severity 2 defects, you won’t really be seeing an improvement in our code coverage metric.

    Takeaways: 

    • You’re not implementing DevOps just to say you’re doing it; you need to develop goals and objectives for your initiative and align to them.
    • Once goals are defined, you need to align KPIs and success metrics to those objectives. Properly defining these success metrics and KPIs will dictate what gets prioritized when building pipelines.

    — Brian Dawson

  • How Nailing Predictability Can Double the Size of Your Business

    How Nailing Predictability Can Double the Size of Your Business

    In a rapidly changing world, predictability has never been more powerful. It’s also never been so underrated. While it is easy to think about predictability in terms of repetition or even monotony, predictability in business means being able to correctly estimate how long it will take to complete a project and how risky it is. But maintaining predictability means a few other crucial things: better allocation of resources, less overspend on projects and a deeper understanding across teams on what’s happening with a project. All of this leads to one thing every business ultimately has their eye on: profit.

    One of the biggest pain points in business is delivering projects on time and on budget. Your latest project might be innovative and essential to the future success of your firm, but the truth is, there’s every chance it will cost more than you think—despite your best budgeting efforts—and take longer to complete. In fact, a study found 66 percent of projects in the software industry were not completed on time, 33 percent were blowing their budgets, and 17 percent were not returning the value stakeholders expected. When we’re looking at 17 percent of projects having the potential to take the entire company down with them, it’s not something to be taken lightly.

    This continues to be a massive problem for the software industry. What is needed is more transparency and higher levels of predictability built into processes, which can eliminate obstacles such as project overspend, delays and unhappy customers. I know this from personal experience. We managed to increase the predictability of our core processes by 102 percent in nine months, and as a result, half of our new contracts have been from referrals made by satisfied customers, that in turn received more accurate quotes and time frames for their projects with us.

    To achieve this, you will need to establish KPIs that define predictability and then design tools which consolidate and capitalize on this data. It won’t be easy, but you will have more control than ever before—which is the perfect foundation for innovation. It had always been one of our goals to become more predictable and put the necessary tools, processes and metrics in place when COO Marek Talarczyk made it a priority in January 2017. When you can accurately measure how long something will take, and how risky it is, you can plan costs and revenue, and thus become a valuable partner for other business entities. There will also be fewer problems for key stakeholders, which leads to increased customer happiness and trust. Once your predictability data is consolidated on a single platform, you will also be able to use it to make better hiring decisions in the future, or—as we did—develop a traffic light system which uses a machine learning algorithm to identify which projects are likely to have issues, and then isolates the potential cause. Tools such as this helped us almost double in size in 18 months. Before we made this effort, we were often wasting time and money dealing with project crises.

    Most importantly, companies who can help other companies become more predictable will lead the way in software, design and digital transformation. It means they can develop a precise plan for their business and marketing strategy in advance of the product launch—which is not based on a best-case-scenario guess, but reliable data. There will also be fewer awkward, dissatisfying meetings about cost blow-outs; your key stakeholders can prepare for the costs of development and won’t be surprised by the sudden need for extra budgeting.

    Just remember, the goal is to make accurate predictions on how your projects will play out—and not judge team members based on the KPIs generated by these new tools. Overcoming this concern was one of the first hurdles we faced, but it’s simply a matter of explaining your true intentions. It’s all about solving problems, while predicting challenges and obstacles.

    — Wiktor Schmidt

  • 5 Ways KPI Analysis Helps DevOps

    5 Ways KPI Analysis Helps DevOps

    Four Vs drive big data solutions: volume, velocity, variety and veracity. Volume and velocity are technical considerations usually receiving a healthy dose of attention among architects and coders. However, variety and veracity often determine success or failure, and they tend to sneak up on teams who haven’t fully considered them. Key performance indicator, or KPI, analysis can head off variety and veracity problems before they escalate.

    When some folks say “KPI analysis,” they mean KPI monitoring and evaluation—the business intelligence perspective. I’m talking about a DevOps analysis discovering which KPIs should be monitored and what data is needed. One step in this analysis traces each desired KPI back through necessary transforms to its required data sources, often termed as facts. Such an analysis clarifies variety and quickly establishes a path to veracity.

    From a strategy perspective, KPI analysis can also mitigate the symptoms of “big bad data” that devour an organization, consuming people and resources rapidly. Here are five ways KPI analysis helps DevOps teams get a handle on big data.

    1. It prevents over-measuring. If you don’t know what you’re looking for, more data probably won’t help you find it. Teams experiencing FOMO (fear of missing out) expand their data gathering, hoping more variety uncovers something interesting. Once your KPIs have been discovered and fully analyzed, stop exploring and start exploiting. Stick to monitoring KPIs directly driving the most impact for your business.
    2. It minimizes bloating. In any computational system, the most expensive operation is moving data. Simply moving stuff around eats processor, network and storage bandwidth. Even with cost-effective storage available, unnecessary data means a bloated infrastructure and less efficiency. KPI analysis identifies a minimum spanning set of data sources. A workload-optimized solution then concentrates on efficient algorithm implementations, yielding results aligned with your KPIs.
    3. It stops wallowing. Allowing people too close to raw big data is extremely dangerous. Off-the-shelf analytics tools often carry a lot of non-KPI variables with them. Cloud-based martech tools are some of the biggest offenders; they are essentially showing off how many ways they can expose their underlying data. Avoiding the temptation to wallow through intriguing but ultimately irrelevant data saves precious brain cells. Customize reports and optimize dashboards around your KPIs.
    4. It de-obfuscates conversations. Nope, not talking about JavaScript here. We want everyone in the organization talking about the same KPIs and only those KPIs. You’ve seen those presentations where someone tries to dazzle an audience with mostly meaningless charts and graphs. Obfuscating your KPIs underneath a pile of other observations wastes time and risks defeating the purpose. Trust your KPIs and focus all organizational conversation on those.
    5. It thwarts non-causality. This is one place where data scientists and analysts really earn their money. Part of a solid KPI analysis determines causality—if your data sources change by some amount, the KPI needle responds by a quantified amount. Understanding those relationships is critical in avoiding false conclusions from data. If your KPI isn’t moving despite changes at the data sources, or your KPI is changing and the obvious data sources aren’t, step back and look at causality and transforms again.

    If you’re seeing these symptoms developing in your organization, it might be a sign automation was rushed in before KPIs were completely analyzed. At that point the toughest symptom to deal with is bloating. You may be stuck with a sized and funded infrastructure, and you really shouldn’t throw out good data already captured. Ongoing KPI analysis can lead your team to optimizations moving forward.

    Ideally, KPI analysis is performed upfront and these symptoms never develop. Realistically, complex systems have cycles of learning before their behavior is fully understood. Even a good upfront analysis may benefit from a revisit as trends start becoming apparent. When KPIs are rolled up periodically, you’ll need a minimum of six periods of results before expected causality is confirmed, maybe more. If that period is monthly, you’ll need ample patience.

    You’re spending too much on a big data solution to afford a big bad data outcome. KPI analysis is an important step, one DevOps teams with both technical and business expertise can excel at with some practice.

    — Don Dingee

  • Predictable Progress: Tracking DevOps Maturity Metrics

    Predictable Progress: Tracking DevOps Maturity Metrics

    As DevOps methodologies continue to evolve, we’re naturally seeing an increased emphasis on the cultivation of related maturity metrics.

    For instance, in the 2016 State of DevOps Report, researchers with DORA took an initial stab at creating relevant ROI measurements.

    Similarly, a new report issued by researchers Coleman Parkes, sponsored by CA Technologies, offers additional evidence that as agile and DevOps processes continue to expand, today’s practitioners are increasingly employing metrics to optimize their efforts.

    The report, titled, “Accelerating Velocity and Customer Value with Agile and DevOps,” finds some form of adoption among nearly every enterprise, with 87 percent having adopted agile to some degree and 73 percent leveraging DevOps.

    Related to the overall maturity of these practices, those organizations that are moving to embrace the techniques most broadly are predictably seeing greater returns. Yet, despite the widespread adoption, only a third have deployed either practice widely, according to the research.

    Percentage of Advanced Adopters Reporting Improvements in Customer Experience


    Based on a survey of 1,770 senior business and IT executives, the study also closely investigates the specific KPIs that organizations are using to gauge how agile and DevOps initiatives are translating into customer interactions.

    Most notably, “advanced” agile and DevOps adopters have observed more than an 87 percent improvement in overall customer experience, compared to “basic” adopters.

    In terms of how those efforts are affecting business drivers, Coleman Parkes finds:

    • Advanced agile practitioners are experiencing a 40 percent improvement in time-to-decision, compared to 33 percent for basic users.
    • Advanced DevOps adopters have noted a 42 percent improvement in speed-to-market, compared to only 24 percent for basic practitioners.

    Key Performance-Invoking Indicators

    To that end, the research highlights specific KPIs that organizations are using to measure the impact the agile and DevOps practices are having on customers. In fact, the study finds that between two thirds and three quarters of all the organizations surveyed have established such measurements.

    At least half of these focus on business or customer-related metrics, reflecting how “critical software has become to businesses’ ability to achieve their core mission,” Coleman Parkes researchers note.

    Among the mostly widely invoked metrics, include:

    • Business growth (specifically revenue): over 73 percent
    • Operational or process efficiency: over 73 percent
    • Employee productivity: over 73 percent
    • Customer experience: over 71 percent
    • IT-related costs: over 71 percent
    • Speed-to-market: over 71 percent
    • Customer satisfaction (via NPS): over 70 percent
    • Time-to-decision: over 70 percent
    • Quality of development: over 70 percent
    • Employee retention: over 64 percent

    If increasing applications delivery speed and overall organizational velocity are, in fact, the primary goals of engaging agile and DevOps, the research bears out that the techniques are having the desired effect. After all, the survey finds that time-to-decision and speed-to-market are being accelerated among approximately a third of the organizations studied.

    Related to other notable KPIs, Coleman Parkes highlights that a full three-quarters of adopters have moved the needle on overall customer experience, along with employee recruitment and retention, a significant benefit that was also highlighted in the State of DevOps Report.

    Along with positively impacting customers, the reality is clearly that agile and DevOps are also making a big difference in allowing companies to improve the atmosphere for their workers—a huge benefit when you consider the shortage of talent in IT today, and how much it typically costs to attract new employees, just as DORA’s researchers noted.

    Other key findings by Coleman Parkes include “before and after” metrics that many organizations are observing related to their continued adoption and advancement of the involved methodologies themselves.

    I encourage you to download the entire report, and leverage it to measure how far you’ve come with Agile and DevOps transformation—and where you may need to re-examine your efforts.

    — Aruna Ravichandran