Tag: DevOps metrics

  • Sumo Logic Extends Observability Reach to AWS Lambda

    Sumo Logic Extends Observability Reach to AWS Lambda

    At the AWS re:Invent conference this week, Sumo Logic announced that in addition to collecting log data, metrics and traces, it now can collect telemetry data from the Lambda serverless computing service provided by Amazon Web Services (AWS).

    In addition to collecting telemetry data, Sumo Logic also revealed that the Sumo Logic Continuous Intelligence Platform hosted on the AWS cloud can now analyze how functions used on the AWS Lambda service perform during transactions.

    That data can then also be correlated against the performance of other AWS services that Sumo Logic tracks via integrations with the AWS CloudWatch and AWS CloudTrail monitoring services.

    George Gerchow, chief security officer for Sumo Logic, said the company is making extensive use of the OpenTelemetry agent software created under the auspices of the Cloud Native Computing Foundation (CNCF) to make it simpler to instrument IT environments. That data is not only being used to improve application performance but also to surface anomalies indicative of a security breach, he added.

    As part of this ongoing security effort, Sumo Logic this week also added Sumo Logic AWS Quick Start integrations for rapid access to security and compliance insights along with support for Amazon Inspector, a vulnerability management service provided by AWS.

    AWS this week named Sumo Logic as its independent software vendor (ISV) partner of the year. The two companies have a longstanding relationship that began with Sumo Logic’s decision more than 10 years ago to build a monitoring platform hosted on the AWS cloud.

    As IT monitoring tools continue to evolve into observability platforms, Gerchow said it’s becoming much easier to leverage machine learning algorithms and open source agent software to identify the root cause of an issue before it results in a major disruption.

    Most IT teams today are still relying on legacy monitoring tools that only tack a set of predefined metrics to identify when a specific platform or application is performing within expectations. The metrics tracked generally focus on, for example, resource utilization. In contrast, observability combines metrics, logs and traces—a specialized form of logging—to instrument applications in a way that makes it simpler to troubleshoot issues.

    Observability, of course, in one form or another, has always been a core tenet of DevOps best practices. Initially, DevOps teams focused on continuous monitoring as the most effective way to proactively manage application environments. However, it can still take days (and sometimes weeks) to discover the root cause of an issue. Observability platforms promise to make it easier to manage IT environments even as the overall complexity of those environments continues to increase.

    It’s not clear at what rate IT organizations will be transitioning to observability platforms. However, it generally takes only one major outage before IT organizations start looking for better tools to manage their IT environment. As those IT environments become more complex, the probability that there will be a significant disruption is now higher than it’s ever been. The challenge and the opportunity is to find a way to instrument applications more widely; the expectation being that an observability platform will be able to analyze telemetry data to reduce the number of issues that lead to service disruptions.

  • LogicMonitor Introduces Unlimited Log Data Retention

    LogicMonitor Introduces Unlimited Log Data Retention

    LogicMonitor today announced it will provide an option that allows IT organizations to retain an unlimited amount of log data on its software-as-a-service (SaaS) platform.

    Tej Redkar, chief product officer at LogicMonitor, said one of the issues that is holding back advances in observability is the cost of storing log data. LogicMonitor has decided to remove that issue by allowing IT teams to store log data on its LM Logs service for as long as they require, Redkar said.

    That data will also always be readily available as hot storage with no need to wait for data that has been stored offline to be rehydrated, he noted. Instead, that data is readily accessible alongside the metrics and distributed tracing data that LogicMonitor also collects, said Redkar.

    In general, LogicMonitor is making a case for centralizing observability for the entire IT organization via a SaaS platform infused with machine learning algorithms that automatically surface anomalies in real-time based on millions of events captured via log data. The issue many organizations encounter today is silos of decentralized observability data that are more complex to maintain while providing less visibility at a higher total cost, said Redkar.

    The LogicMonitor platform, in contrast, is designed to be equally accessible to, for example, a network operations team as it is to a DevOps team, he noted.

    Not every organization needs to store log data forever, but Redkar said as IT management continues to evolve, more organizations are moving toward storing metrics, traces and logs for longer periods of time. The rise of open source agent software is also making it less costly for organizations to capture that data in the first place.

    It’s not clear to what degree other providers of observability platforms will provide unlimited retention of data, but as the cost of storing data in the cloud continues to drop it’s apparent that billing IT organizations for storage costs is becoming untenable. There is always going to be some cost associated with storage, but it’s not enough to charge extra beyond the core cost of the service. The only thing accomplished by billing separately for storage is discouraging IT teams from storing the data required to both attain observability and better train the machine learning algorithms that surface anomalies.

    Observability, in one form or another, has been a core tenet of DevOps best practices for years. Initially, DevOps teams focused on continuous monitoring as the most effective way to proactively manage application environments. Observability platforms infused with machine learning algorithms make it possible to correlate events so that analytics tools can more easily identify anomalous behavior in real-time. Armed with those insights, it becomes a lot simpler for IT teams to resolve issues faster.

    In fact, there may even come a day when the so-called “war room” meetings that are convened to identify the cause of an IT issue via a painstaking process of elimination are no longer required. In the meantime, however, the total number of IT incidents that actually lead to disruption should steadily decline, even as IT environments become more complex.

  • Allstacks Adds Free Dashboard to Track Software Dev Benchmarks

    Allstacks Adds Free Dashboard to Track Software Dev Benchmarks

    Value stream intelligence platform provider Allstacks today added a free live dashboard populated with anonymized data that DevOps teams can use to benchmark their own progress.

    Hersh Tapadia, Allstacks co-founder and CEO, said the company is making this data available to make it easier for DevOps teams to uncover bottlenecks in their software development processes.

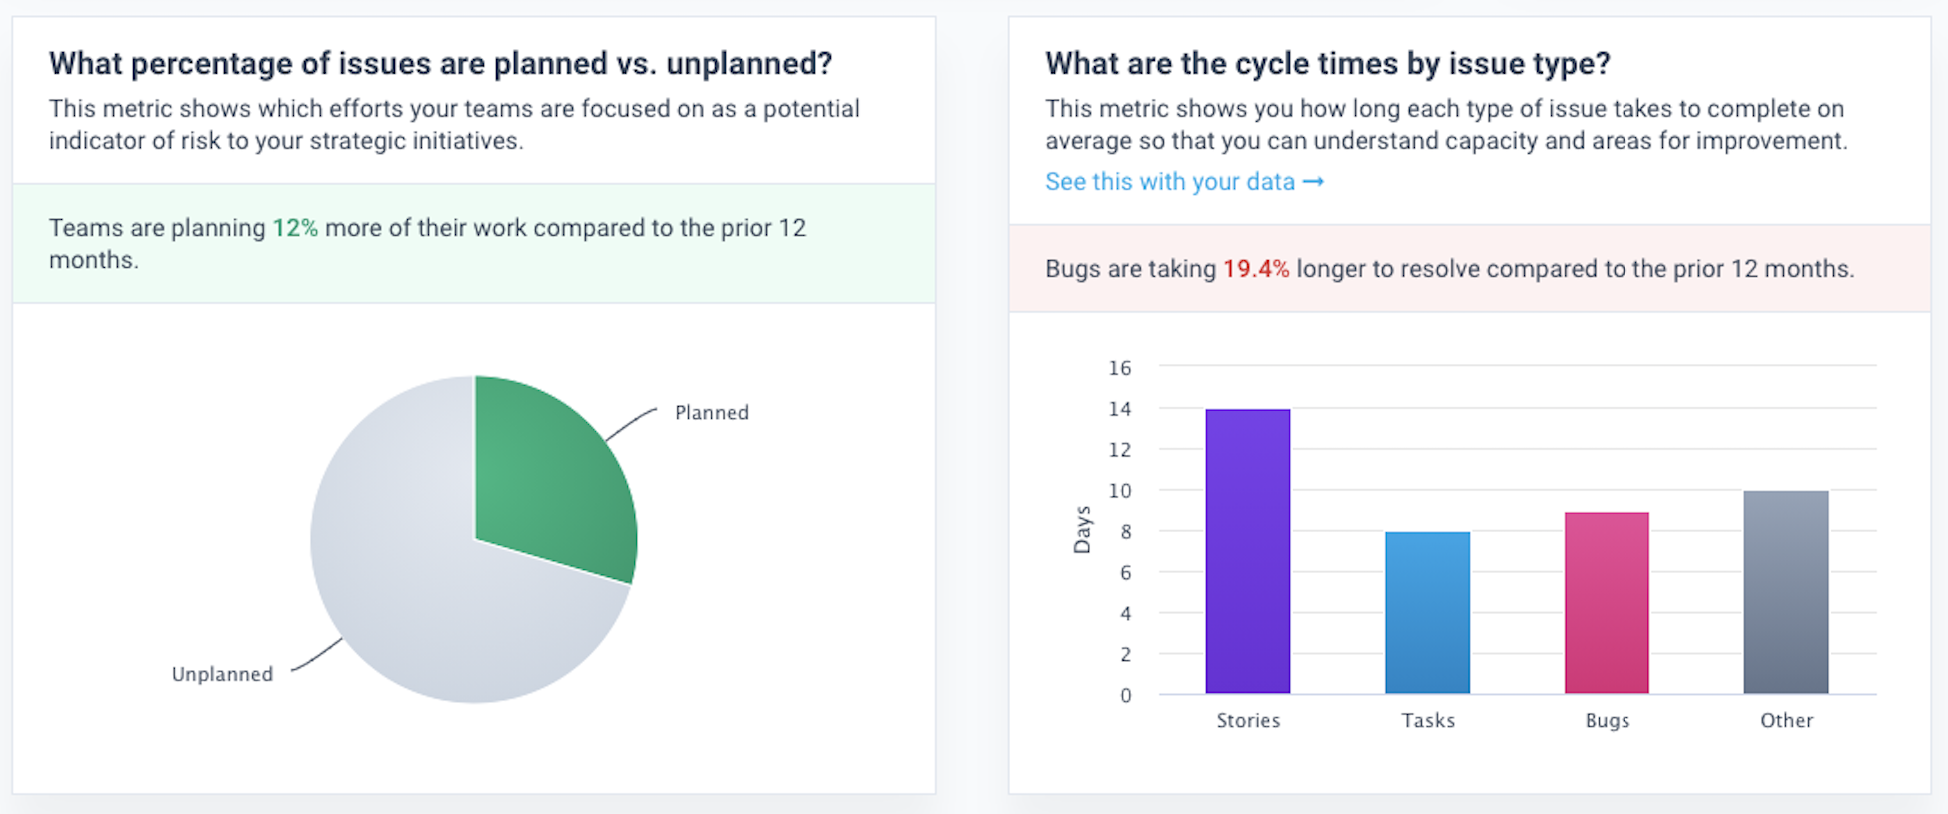
    As part of that effort, the dashboard includes pre-configured benchmarks for the following:

    How many days per week do benchmark teams write code?
    What percentage of issues are planned versus unplanned for benchmark teams?
    What are the cycle times per issue type for benchmark teams?
    What types of code do benchmark companies produce?
    What is the average commit size for benchmark customers?

    Allstacks

    Allstacks has committed to making 12 months of data publicly available on the dashboard and said it will update that data on an ongoing basis. Allstacks customers, however, can also access five years of data to compare historical trends.

    Tapadia said Allstacks plans to add additional benchmarks to a dashboard that can collect data via the various application programming interfaces (APIs) that most DevOps tools now routinely provide. The overall goal is to increase transparency into software development processes, he said.

    Allstacks’ value stream intelligence platform uses machine learning algorithms and artificial intelligence (AI) models to identify projects that are at risk of not meeting delivery goals. That data is then used to analyze the impact those missed deadlines are likely to have on various business objectives.

    Value stream management platforms automatically take technical metrics, gathered via a DevOps process, and match them to a set of key performance indicators (KPIs) defined by business leaders. The challenge many organizations still face is making sure they have the tools in place to collect the appropriate technical metrics and then define the KPIs that truly matter to the business. Once those metrics are gathered and KPIs established, organizations are then able to apply advanced analytics to the massive amounts of DevOps data they collect.

    The concept of value stream management traces its lineage back to lean manufacturing methods, which called for each step of a manufacturing process to be continuously measured. As software development has evolved from being a craft to a process that is highly automated using DevOps best practices, an appreciation for the value of monitoring the impact of missed software development deadlines on the business has grown as organizations realize how dependent they are on software.

    As a result, more organizations realize there is a clear disconnect between their business goals and development processes, noted Tapadia. Business leaders are especially anxious to understand how a software development project delay might impact future revenue projections. Rather than being a set of tools employed mainly by IT leaders to track software development projects, value stream management platforms make it possible for other stakeholders to track KPIs spanning multiple software development projects. It then becomes easier to make informed decisions about how to reassign resources across various projects as different bottlenecks are encountered.

    It may be a while before organizations achieve that level of transparency into their software development processes, but as software continues to ‘eat the world,’ it’s only a matter of time before value stream management becomes a required set of DevOps tools for every organization.

  • Grafana Labs Expands into Incident Management Realm

    Grafana Labs Expands into Incident Management Realm

    During its online ObservabilityCON 2021 conference, Grafana Labs this week previewed an incident management platform in addition to making available an on-premises edition of its distributed tracing tool.

    Tom Wilkie, vice president of product for Grafana Labs, said the Grafana OnCall incident management platform is a natural extension of the observability tools the company already provides using the widely employed open source Grafana dashboard. The platform, which is expected to be generally available in 2022, is based on software Grafana Labs gained by acquiring Amixr earlier this year.

    Grafana OnCall unifies all the alerts created by Grafana, Prometheus and the Alertmanager tool the Prometheus community created to streamline the number of alerts generated by the platform. The goal is to reduce the alert fatigue a DevOps team might experience when dealing with an IT issue that can be traced back to a single root cause, noted Wilkie.

    Grafana

    At the same time, Grafana Labs made Grafana Enterprise Traces available for on-premises IT environments. It is based on Grafana Tempo, a cloud service that makes it possible to store and then analyze distributed traces using inexpensive object storage resources. The latest version of the core open source Tempo project has also been updated to add service graphs and the ability to search recent traces.

    Grafana Labs this week also updated Loki, an open source log management platform, to add support for out-of-order log lines, custom log retention policies per log stream and per tenant and a deletion API that makes it easy to scrub log data. Version 2.4 of Loki also adds additional high-availability capabilities.

    Other updates to the Grafana Labs platform include support for recorded queries, a set of pre-built dashboards that enable users to quickly drill into their Prometheus metrics data, the ability to consume metrics from the AWS CloudWatch service provided by Amazon Web Services (AWS), improvements to its ability to monitor Kubernetes clusters and updates to the open source load testing tool the company gained by acquiring k6 last year.

    Grafana Labs is also committing to expanding its integration with Microsoft Azure cloud service alongside its integrations with AWS, noted Wilkie.

    While competition among providers of observability platforms is already fierce, Wilkie said an observability platform based on an open source dashboard that can already collect data from more than 100 sources provides a unique advantage. At the core of the Grafana Labs platform is a centralized framework for collecting data generated primarily by the open source Prometheus monitoring platform being developed under the auspices of the Cloud Native Computing Foundation (CNCF).

    While Prometheus is used most often in Kubernetes environments, it is starting to gain traction in monolithic application environments as well; it provides an open source approach to defining a de facto standard for collecting metrics and other data that can be consumed by an observability platform.

    It’s not clear yet to what degree IT teams are distinguishing between monitoring and observability. Monitoring focuses on predefined metrics to identify when a specific platform or application is performing within expectations. Observability combines metrics, logs and traces to instrument applications in a way that makes it simpler to troubleshoot issues without relying solely on a limited set of metrics that are pre-defined and monitor a specific process or function.

    Regardless of whether IT teams view observability as being distinct from monitoring, it’s clear that the ability to manage IT environments is improving at a rapid rate. The challenge, of course, is the IT environment itself is becoming more complex with each passing day.

  • 5 Tips for a Successful DevOps Implementation

    5 Tips for a Successful DevOps Implementation

    More businesses are turning to DevOps implementations to deliver software and updates with more efficiency. As much as business leaders know DevOps can help them to be faster and more agile, many of them are unsure how to get started. Many businesses even begin implementing DevOps only to run into unforeseen problems that hinder the process. 

    While DevOps can be beneficial, you do not want to make changes lightly. You need to know what you are getting into and prepare for ways the change can impact your company. Having a good team and providing them with the right infrastructure-as-code (IaC) tools will help, but there is so much more you need to consider before starting. 

    Here are five vital tips for successful DevOps implementations.

    Evaluate Your Processes

    You need to start by learning what DevOps is and what it means to your organization. Everyone on the team needs to understand what DevOps can do and the types of problems it can solve for your company. 

    Evaluate your entire development cycle from beginning to end. Look at the different processes that go into development to find different bottlenecks and inefficiencies. By finding the areas where your current processes come up short, you will be able to identify the areas to concentrate on when implementing DevOps.

    Collaboration and Communication

    Collaboration and communication are at the heart of successful DevOps implementation. You can get all of the best DevOps tools available, but if you do not have teams ready to work together and communicate, you will not achieve the full benefits of DevOps implementation.

    If you are going to succeed, you need to instill a strong sense of collaboration and cooperation among teams. Beyond that, you also need to provide your team members with tools that will help them communicate and collaborate. Communications platforms and collaboration software can be just as important as the tools that contribute directly to development.

    Set Goals

    DevOps implementation is not just about getting the right tools and changing processes. You need to assess the operations of your company and set goals for the implementation. If you are just buying new tools without setting a new direction, the implementation will not result in that much change. 

    Another good tip is to start with one smaller, more easily achievable goal and then scale up from there. Changing everything at once might be too much of a disruption. Instead, select a smaller goal and once that is achieved, move on to goals that are larger and more complex.

    Automation

    Automation is a big part of what makes DevOps beneficial to modern businesses. If you are going to achieve the full benefits of the change, you should automate as much as you can. Whether it is scanning code for misconfigurations or automated testing, you can do a lot to make your operations more efficient by using a variety of different automation tools. 

    You may also want to take automation one step at a time. If you try to dive headfirst into automation, it might be a bit too much for your team to keep up with. Instead, take a manual process that has been taking a lot of time and toil from your team and implement an automation tool. Let your team monitor for a few weeks to see how it goes and then take what you learned and apply that feedback to automating more processes.

    Know Your Key Metrics

    Set your key metrics from the very beginning of the implementation process. Without metrics, you won’t be able to keep track of the progress you make. A lack of tracking will also make it difficult to identify issues that might be holding back your progress. 

    Most organizations will need to focus on three points: Lead time, deployment time and mean time-to-recover. Beyond that, try to think about your users when defining key metrics. What do they like? What do they care about? What makes for a more pleasing experience?

    DevOps implementation is not simple. By taking the right steps to prepare, you can avoid the worst problems and put yourself in a position to respond well to the issues that do come up during implementation.

  • Choosing the Right Software Testing Metrics

    Choosing the Right Software Testing Metrics

    A software testing metric is a criterion to track the effectiveness of quality assurance efforts. First, you establish success indicators throughout the planning stage. Then, compare them with the received metric after the completion of the process.

    However, many software QA and test experts tend to focus on how the tests will be executed rather than on the actual information produced by the tests. By this I mean testers often focus on the mere satisfaction of completing all the tests. But is this always a good thing? You can have a 100% pass rate with all green indicators on your dashboard and it is still possible that your tests aren’t strong enough.

    This article will discuss five software testing metrics that might assist QA professionals in evaluating their success.

    Characteristics of a “Good” Testing Metric

    Let’s talk about the features a metric should ideally have.

    Relevant to Business Goals

    Critical KPIs should reflect the primary mission and purpose of a business; for example, monthly revenue growth or the number of new users. Each company chooses its metrics based on what they intend to achieve with their product. While it may seem attractive to succeed in all tests, focusing on the wrong goals can be deceiving. This may impact the app’s work and the entire complex system, such as headless commerce architecture.

    Allows for Growth

    Every metric should allow for improvement. What if you’ve achieved a 100% success rate? The goal may be to keep the metric at this level or to improve it further.

    Encourages Development of a Strategy

    When a metric gives a team a goal, it also motivates them to ask questions to develop a plan. Suppose you need to increase revenue. Consider whether the product requires new features to encourage more purchases. Is it necessary to create a new acquisition channel? Has the competitor launched any new products or features that are attracting new buyers?

    Trackable and Comprehensible

    Good metrics are simple to comprehend and follow. Otherwise, how will the people gathering them make informed decisions? Employees must understand what they can do to improve the outcome.

    Three Tips for Choosing and Measuring Software Testing Metrics

    1. Start by Asking Questions

    Your questions should cover three topics:
    1. What you’re measuring
    2. Strategies and tools to measure it
    3. Reasons to track it

    To avoid analyzing useless metrics, pay attention to the metrics definition process. Sometimes, a small number of backlog bugs means your QA team is doing its job. However, when you break down these bugs into high/medium/low priority issues, you’ll be able to better see the overall program quality and make the needed adjustments.

    2. Don’t Neglect Automation When Calculating QA Metrics

    Automation saves you time on manual data collection and helps ensure your metrics will always be relevant. Let’s assume you use Jira. Set up a Jira Query Language (JQL) request on your Confluence page if you need data on critical bugs every sprint. It will be updated frequently. Or you can employ other tools based on your preferred test management/task tracking system.

    3. Collect Comments and Gradually Improve Metrics

    Once you’ve set up and gathered all the metrics, the feedback and improvement processes start. Pay attention to feedback to improve the efficiency and clarity of your metrics and reports.

    Five Software Testing Metrics to Track

    Now let’s look at some specific examples. Note that different quality aspects matter to varying degrees depending on circumstances.

    1. User Satisfaction

    Here, you’ll want to see the client’s reaction to the product. You use user satisfaction surveys and support tickets that reveal bugs. If you track these quality metrics and work to improve them, the business will grow as you’ll see more satisfied and returning customers. If something’s wrong, you’ll have to do a causal problem analysis and remove the roadblocks.

    2. Process Metrics

    These are internal measurements that have a significant impact on your product quality. For example, you can track lead time and the time it takes between setting the task and code deployment and production.

    One more metric you could use is cycle time. It means time to build a feature after being given the approval to begin working on it. Finally, you can track the time it takes to solve difficulties. This could refer to the speed of resolving tickets or bugs once they’ve been reported.

    As these metrics can be hard to measure, another method to improve process efficiency is to detect where unfinished work starts to pile up in the queue. It can highlight a bottleneck that, if removed, could help your teams become more productive.

    3. Coverage Metrics

    Another indicator of test quality is test coverage. It informs us of the amount of tested code. It’s a method of ensuring that your tests check the code and how much they operate. In this case, it’s better to use a top-down strategy. The first step is analyzing module coverage. Then you consider functionality and, finally, data coverage in each functionality. It means how many different combinations of the potential data inputs you’re covering with tests.

    This group includes such metrics as:
    ● Requirements coverage percentage
    ● Unit test coverage
    ● Manual or exploratory test coverage
    ● Test cases by requirement category
    ● UI test coverage
    ● Integration and API test coverage

    4. Code Quality Metrics

    Evaluating code quality means categorizing the value of code into two categories: Good and bad. There is no single notion of quality because practically every developer defines for themselves what constitutes good code. How can you assess code quality? Tools like SonarQube let you reveal how much technical debt is in a system. You’ll need to classify issues and vulnerabilities, organize them by priority and select what you’re going to focus on.

    5. Bug or Incident Metrics

    Each issue differs in severity, so don’t give all issues equal weight. Some problems are simply suggestions for improvement. Determine which components of quality are more important than others for your company. That said, go beyond just the amount of defects when analyzing the metrics you’ll use.

    What can you extract from incident reports? These results can include:

    ● Total number of bugs
    ● Open defects
    ● Closed defects
    ● The time to close each incident report
    ● Changes since the last release

    Rules for Measuring Software Testing Metrics

    Evaluating metrics in software testing and estimating their success can be frustrating and vague. Here are some tips and suggestions you can use:

    1. Correlate your metrics with project, process and product goals. Keep in mind that a single indicator is not enough for a complete view of your software quality.
    2. Track the progress (or regress) throughout time. Streamline the data collection process through automation, store data in a collaborative resource like a Wiki/Confluence and review outcomes regularly.
    3. Report the statistics to the customer and the team to show your progress. Reports should be easy to understand, so make them helpful and user-friendly.
    4. Check to make sure if the metrics are valid. Keeping track of irrelevant metrics and displaying inaccurate data is out of the question.

    Measurement is an important activity in software testing, such as determining the number of successful tests against how many have failed. All the information you get comes to stakeholders. As a result, they can make informed decisions such as when to release an app.

    How can you monitor your test activities? You need to determine relevant software testing metrics. Choosing the correct testing metrics can be difficult. Frequently, teams opt for metrics that are out of sync with the overall business.

    What can the lack of adequate benchmarks cause? Stakeholders fail to measure progress, identify possibilities for development or control which testing tactics have the most positive impact. All things considered, QA teams need to track individual progress, skill level, and success, as well as code quality, bugs, and coverage.

  • Observability Vs. Monitoring: What’s the Difference?

    Observability Vs. Monitoring: What’s the Difference?

    As more and more IT organizations pivot from strategies rooted in monitoring to ones that aim to achieve observability, one of the first questions that teams need to answer is, “What is the difference between the two?”

    That’s a somewhat loaded question because there are some differences of opinion out there regarding what, exactly, distinguishes monitoring from observability. But in general, the differences can be distilled into two main points, as we will explain.

    What is Observability and What is Monitoring?

    The first step in understanding the difference is to understand what each term means on its own.

    The classic definition of observability is that it is the use of external data outputs to understand the internal state of a system. In the IT industry specifically, observability could be defined as the use of logs, metrics and distributed traces to understand the state of a complex software system.

    Meanwhile, monitoring is the process by which data is collected from a system. In IT, monitoring is how teams collect logs, metrics and traces and move them to a place where they can be analyzed.

    Similarities

    There are some obvious similarities between the two. Both involve (at least in part) the collection of diverse sets of data. Both also serve the goal of helping teams identify problems within their software stacks and deliver a high-quality user experience.

    Two Key Differences

    But the similarities end there. Ultimately, monitoring and observability are distinct concepts and processes, with two main differences that distinguish them from each other.

    Monitoring collects data. Observability interprets it.

    The first is that observability focuses on interpreting and understanding data, whereas monitoring is merely the collection of data.

    In this sense, you can think of monitoring as one of the processes that makes observability possible. But observability requires more than monitoring. In addition to collecting data, observability also involves the correlation of data from multiple sources and the identification of relevant patterns or anomalies within that data.

    Monitoring Tells you What is Wrong. Observability Tells you Why it’s Wrong

    The second main difference is that monitoring simply alerts you when something goes wrong. Observability goes further by helping you understand why it’s wrong and how to fix it.

    For example, a monitoring tool might tell you that your application’s response rate is no longer adequate. But you need observability to figure out which specific microservices within the application are causing the problem. Using that information, you can plan and execute an effective response to reliability issues using an incident management platform.

    With monitoring alone, you only know that something is broken, not how to fix it.

    Observability and Monitoring: Better Together

    Although it’s common to speak in terms of “observability versus monitoring,” the reality is that you can’t have observability without monitoring. (You could monitor without observing, but doing so would significantly reduce your ability to understand and resolve problems quickly.)

    So, don’t think of it as an either/or proposition. Think of them as concepts and practices that go hand-in-hand, even if they perform different functions.

  • Defining Availability, Maintainability and Reliability in SRE

    Defining Availability, Maintainability and Reliability in SRE

    In the world of reliability engineering, you’ll frequently encounter the three “-ability” words: Availability, maintainability and reliability. They sound similar and have similar meanings. In fact, these words may seem so similar that it can be tempting to use them interchangeably.

    That would be a mistake. Availability, maintainability and reliability all have distinct—if related—meanings, and they each play different roles in reliability operations.

    Definitions of Availability, Maintainability and Reliability

    Let’s start by succinctly defining each of the terms.

    Availability, Defined

    Availability is the extent to which an IT resource is ready to perform a task when requested.

    Thus, an application or server that is responding to requests is available (even if it takes longer to respond than desired or otherwise operates suboptimally, in which case it may have a reliability issue but not an availability issue).

    Availability is usually measured as a percentage. A resource that has 99% availability, for example, is one that is up and responding 99% of the time.

    Maintainability, Defined

    Maintainability is a measure of how quickly and easily a resource can be fixed when something goes wrong.

    If a buggy application release can be quickly fixed by rolling back to a stable version, the application would have a high degree of maintainability. On the other hand, if you have a server that needs to be rebuilt manually after it fails, it’s not very maintainable.

    Reliability, Defined

    Reliability is the extent to which a resource functions as required upon request (as opposed to simply being available).

    For example, if your users require an application to process each transaction within one second, and it does this 99%of the time while also maintaining a 99% availability level, that would be a relatively reliable application. In contrast, an application that responds to almost all requests but that suffers from high latency or error rates would not be very reliable, although it might be highly available.

    Differences Between Availability, Maintainability and Reliability

    The simplest way to spell out the differences between availability, maintainability and reliability is to highlight what’s unique about each concept.

    Availability

    Unlike maintainability and reliability, availability is an essentially binary metric, in the sense that a system is either available or it’s not. Although availability status can change over time, there is no such thing as varying degrees of availability.

    Availability also stands out because it is often the most important metric in defining SLAs and SLOs. Contracts typically specify that resources will achieve a certain level of availability, defined in percentage terms. They may sometimes also specify metrics like response times, which are a reflection of reliability, but availability is more likely to be the most important metric within service agreements.

    Maintainability

    Maintainability is unique in that it’s a pretty subjective concept. A system that one SRE considers easy to maintain could seem difficult to maintain to another SRE. The methodologies that engineers leverage to optimize maintainability could vary, too; for instance, someone from a DevOps background may be more likely to focus on optimizing maintainability within the software delivery chain than someone trained in classic site reliability engineering, which focuses on automating IT operations through code more than on the software delivery process.

    That said, automation tools help virtually every team maximize maintainability, no matter their preferences or background.

    Reliability

    Reliability stands out because it reflects how well a system performs. Here again, this is a somewhat subjective metric, because performance requirements may vary from one user to another. Nonetheless, reliability is the most effective means of measuring whether a system meets the performance levels it needs to, even if those requirements change over time.

    Why do availability, maintainability and reliability matter?

    Because availability, maintainability and reliability each measure different aspects of a system’s status, putting them together is a useful means of gaining insight into the overall reliability of a system.

    In order to be reliable, a system requires both availability and maintainability. A system can’t be reliable if it’s not available. It’s also unlikely to be highly reliable if it takes a long time to fix issues due to low maintainability.

    At the same time, by focusing on availability, maintainability and reliability individually, you can drill down into specific issues within the IT resources you manage. For instance, you might have systems that are high-performing when they’re available, but that have low reliability rates because of availability issues. In that case, you’ll know that an investment in increased availability is likely to yield the greatest reward for increasing overall reliability.

    The Bottom Line

    The bottom line: While availability, maintainability and reliability are all reflections of the quality of an IT resource, they measure quality in different ways. Tracking each category separately is important for ensuring that you know where your weakest links exist within overall system performance and health.

    At the same time, however, it’s important to compare and correlate availability, maintainability and reliability data so that you can achieve continuous insight into a resource’s status. When you can track each item separately but also combine them together to gain a complete picture of your system, you are in the best position to optimize reliability operations.

  • Splunk Expands Scope of Observability While Lowering Costs

    Splunk Expands Scope of Observability While Lowering Costs

    During its online .conf21 conference Splunk Inc. today revealed a bevy of updates that advance observability while at the same time reducing the total cost of deploying its platforms.

    As part of that effort, Splunk also announced it will now make workload-based pricing available to all customers.
    Previously, a select number of small customers had access to workload-based pricing while other customers licensed Splunk platforms based on how much data was loaded into the platform. That approach, however, tends to discourage IT teams from loading as much of their data as possible.

    CEO Doug Merritt said workload pricing was created to enable a value-oriented pricing model that customers could employ instead of a data-centric model that can discourage IT teams from analyzing as much data as possible to improve IT operations.

    To further lower total costs, the company is also previewing a Flex Index option for customers that choose workload-based pricing to enable longer retention for lower-value data at a lower cost. Splunk is also expanding its cloud storage to include a preview of SmartStore, which allows larger volumes of data to be stored more cost-effectively on Microsoft Azure Cloud initially with support for Amazon Web Services (AWS) and Google Cloud Platform (GCP) forthcoming.

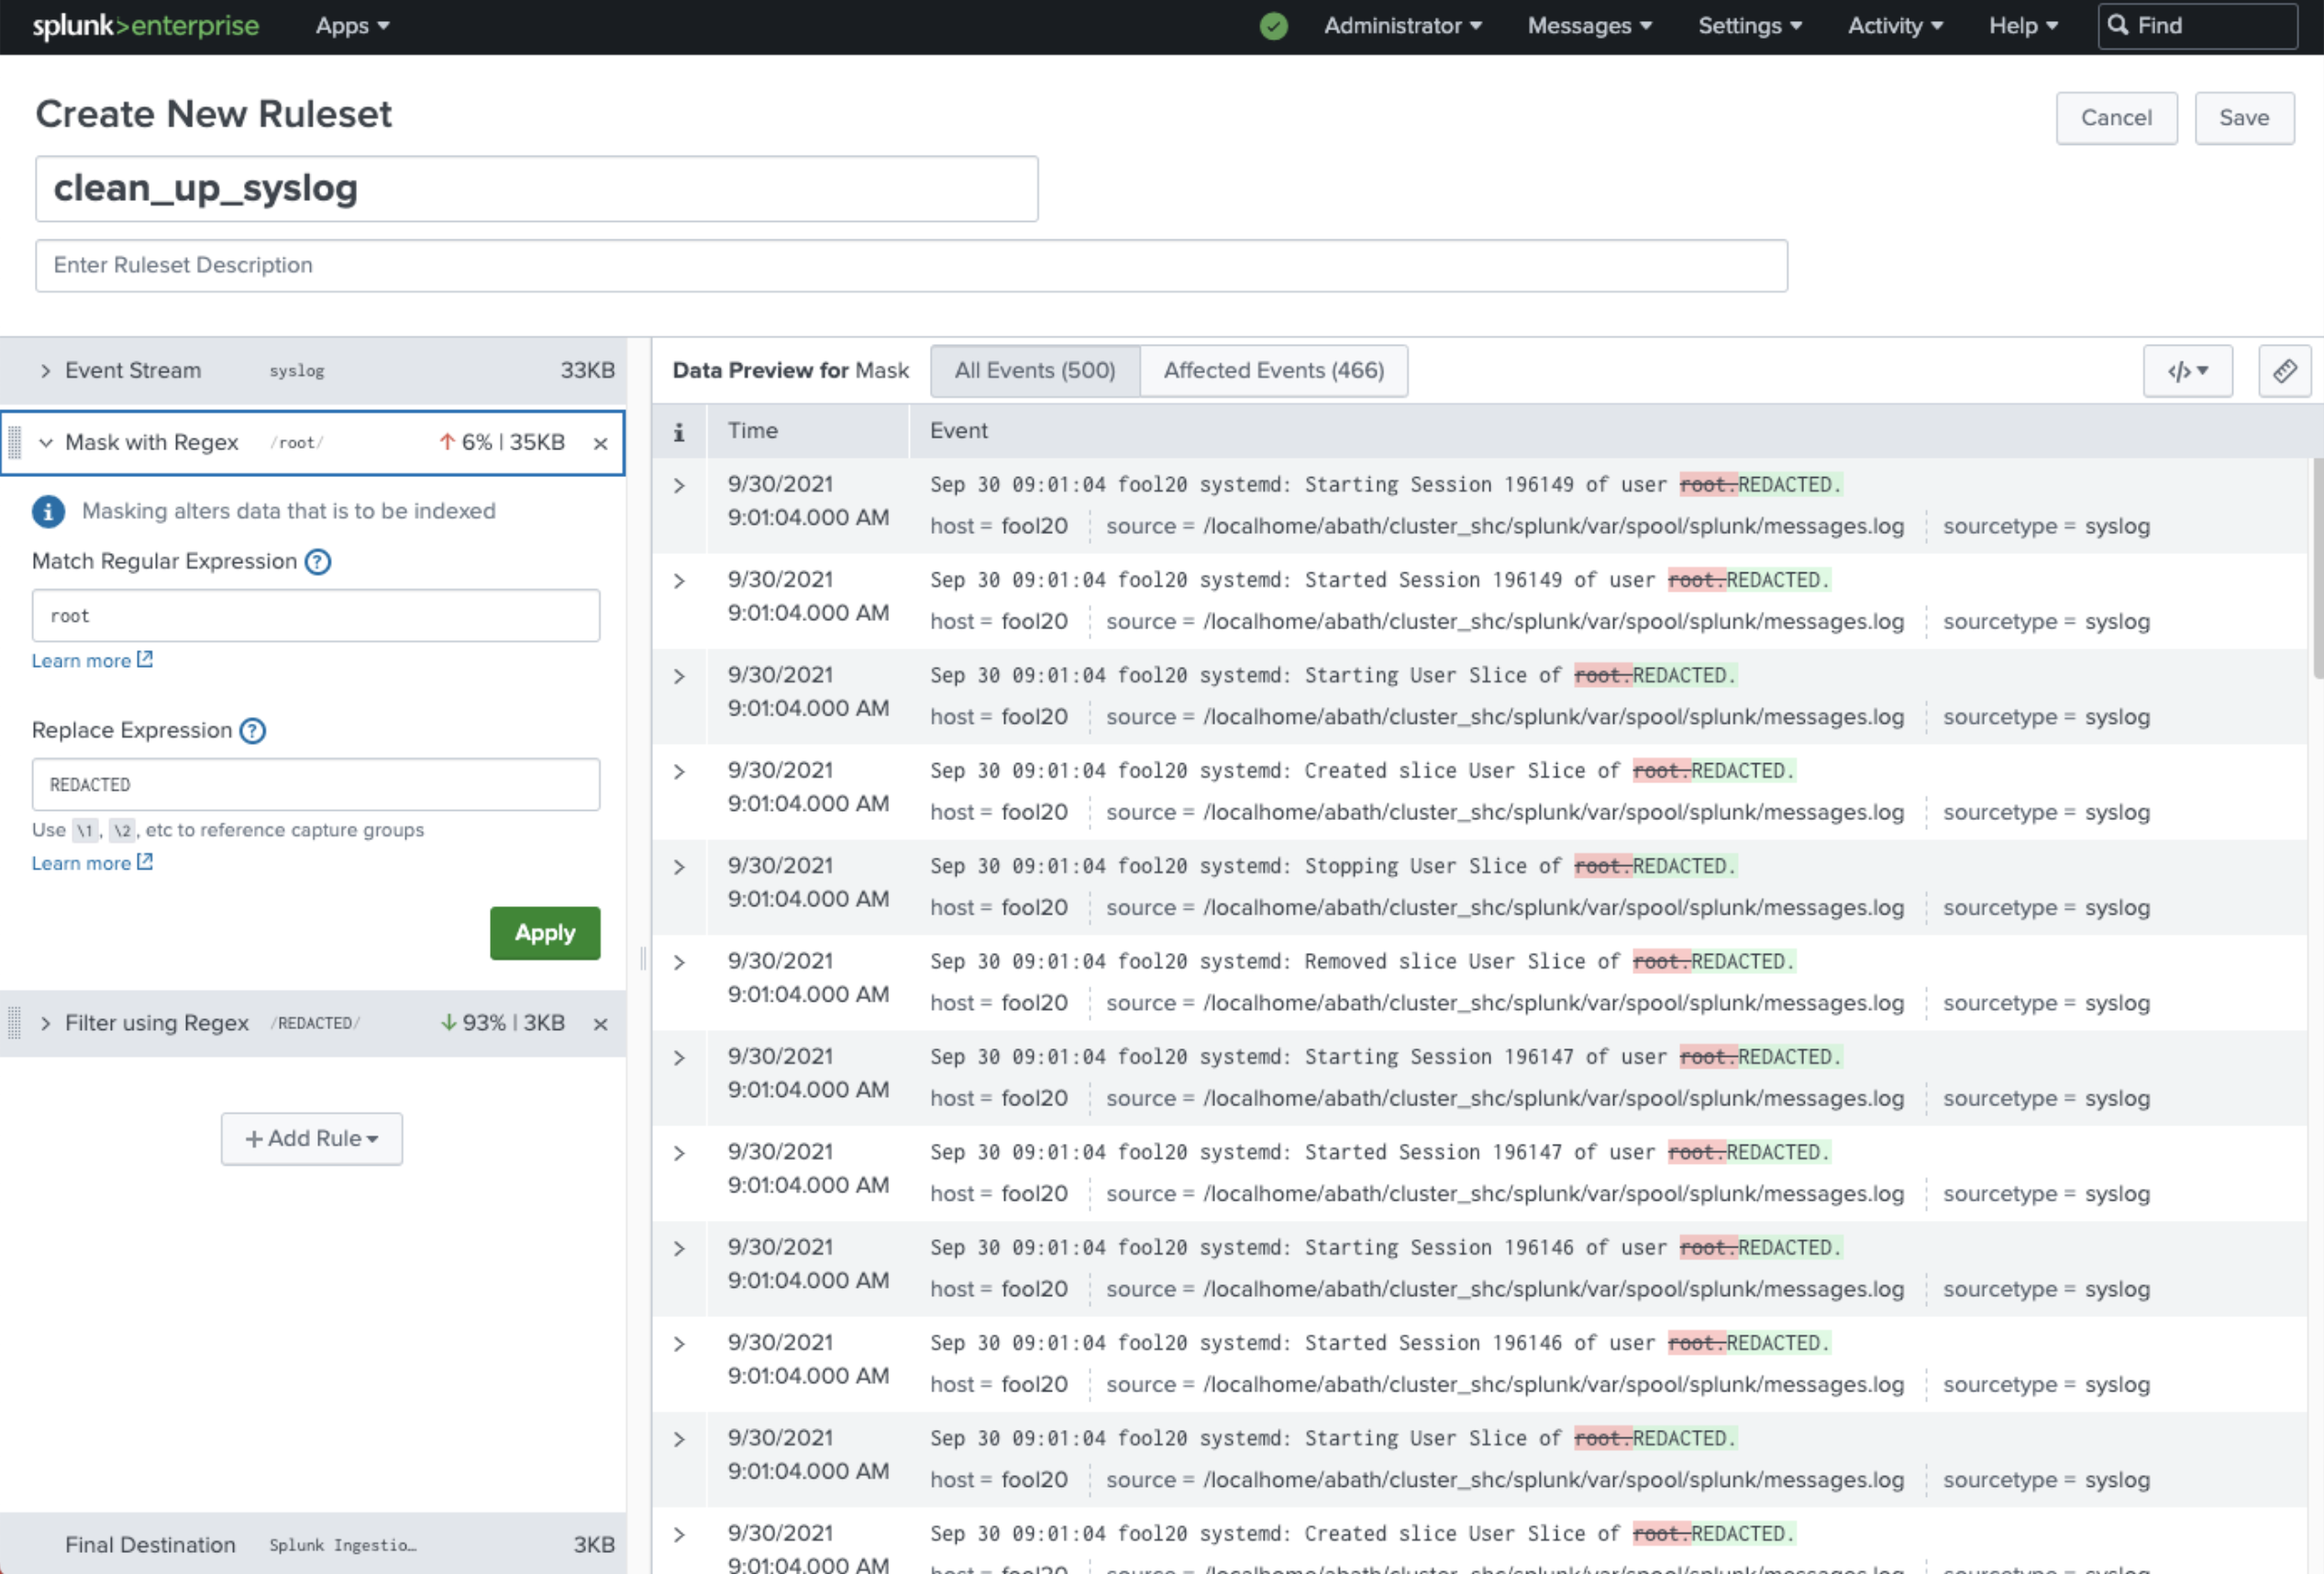
    Other enhancements to the portfolio include a preview of a data manager, a revamped onboarding tool for data stored in Amazon Web Services (AWS) and Microsoft Office 365, and Ingest Actions, which enables IT teams to act on data in motion in addition to data at rest stored in Splunk or the S3 cloud service from AWS.

    The company is also now making it easier to find and explore data via a federated search tool and a Splunk Dashboard Studio offering, available via Splunk Mobile, that makes it easier to create dashboards.

    At the same time, the company is also making available Splunk Operator for Kubernetes to make it easier to install its platforms in cloud-native environments. There is also now Splunkbase, a curated catalog that makes it simpler to find or develop a Splunk application.

    In terms of observability, the company is providing a preview of AlwaysOn Profiling for its application performance management (APM) platform, dubbed Splunk APM. AlwaysOn Profiling extends existing tracing capabilities to provide continuous code-level visibility and analysis.

    In addition, there is now a preview of an enhanced version of Database Visibility for Splunk APM, which automatically uncovers slow queries that are causing transaction latency without having to instrument a database.

    The company also announced that its real user monitoring (RUM) for mobile applications, which makes use of open source, now is generally available alongside the Splunk Observability Cloud for Mobile platform. The company also revealed there are previews of integration between Splunk Log Observer and Splunk Enterprise and Splunk Infrastructure Monitoring AutoDetect, a tool that automatically discovers infrastructure anomalies. There are also now additional Content Packs for managing Microsoft365, third-party APM tools and synthetic monitoring.

    Finally, Splunk has expanded its security portfolio to include Splunk SOAR App Editor, which provides a way to edit, test and create security orchestration, automation and remediation (SOAR) applications. There are now more than 350 SOAR apps now available on Splunkbase. The company also launched Splunk Intelligence Management based on a platform it gained with the acquisition of TruSTAR earlier this year and that it is making available security services via a team of experts dubbed SURGe.

    It’s not clear to what degree these additions will enable Splunk to fend off what has become a larger number of rival providers of observability platforms. However, as one of the most widely used IT operations management platforms in the enterprise, it’s clear Splunk enjoys an incumbent leader status it is determined to maintain.

  • Why Observability and Monitoring Matter to SREs

    Why Observability and Monitoring Matter to SREs

    Site reliability engineers, or SREs, do many things. They help developers build reliability into applications. They manage SLAs and SLOs. They play a leading role in incident management and incident response.

    For all of these tasks, SREs draw heavily on observability and monitoring. Although other parts of the IT organization also typically help to manage observability and monitoring, it’s virtually impossible for SREs to do their jobs effectively in today’s cloud-native world without observability and monitoring tools and data.

    Here’s what observability and monitoring mean, why they’re so important for SREs in particular and how SREs can systematically measure the success of their monitoring and observability practices.

    Defining Observability vs. Monitoring

    Monitoring is the collection of data from applications, infrastructure or other IT resources to track the status and performance of those resources. Monitoring has been a core IT practice since the late 1990s when the first modern monitoring tools, such as Nagios, appeared.

    When compared to monitoring, observability is more intensive. Observability is the collection of discrete types of data from multiple systems and the correlation of those data sets to achieve actionable visibility into IT resources. One thing to note: Observability has a more technical definition in the field of control theory that has to do with using external outputs to make inferences about the internal state of a system; however, when people talk about observability in the context of IT and SRE, they usually mean the collection and correlation of broad sets of data in order to understand complex systems.

    The debate about the differences between observability and monitoring is ongoing, but the consensus is that they boil down to:

    • What versus why: Monitoring helps SREs determine that a problem exists. Observability goes further by allowing them to understand why it exists.
    • Context: Observability provides context around what is wrong with a system. Monitoring, for the most part, offers surface-level information about the existence of a problem.
    • Actionability: Observability empowers SREs to respond effectively to outages, performance degradations or other problems. Monitoring merely lets them know that something is wrong and that it may require intervention.

    In most respects, monitoring is one step in the greater observability process. But observability involves additional practices, such as the correlation of various types of data, to achieve a level of context and actionability that monitoring alone can’t deliver.

    Why SREs Should Understand Observability

    Again, observability has become a core practice for engineers in a variety of roles. Developers can use observability tools to help measure and optimize application performance before deployment. IT engineers can leverage observability to gain visibility into issues that exist in a production environment. Observability tools can help QA engineers determine why an application failed a test.

    But no group has more to gain from observability than SREs. Given that maximizing the reliability and performance of systems is the core mission of SREs, the ability to not just detect problems via monitoring but also to understand them through observability is critical for modern SRE teams.

    That’s all the more true for SREs tasked with managing reliability for complex systems, like those based on microservices. In complex applications, identifying the root cause of a reliability issue—such as which specific microservice contains buggy code or which type of request triggers a performance bug—can be very difficult. By maximizing context into reliability problems, as well as allowing teams to trace requests across complex, distributed systems, observability places SREs in the strongest position to find and fix reliability problems quickly.

    What’s more, beyond detecting issues in systems that have already been deployed, SREs can also leverage observability tools to help build reliability into applications before they are put into production. By observing applications in dev/test environments, SREs may be able to identify reliability risks and then use that insight to find ways to make the application inherently more reliable. Observability might reveal reliability weaknesses that stem from an application’s architectural design, for instance, or from the orchestration tool that manages the application.

    How to Measure Observability and Monitoring

    Getting the most from observability and monitoring requires systematic measurement of observability and monitoring initiatives. It’s only by collecting metrics about observability and monitoring outcomes that SREs can ensure they are improving reliability rather than merely collecting and analyzing data to no particular end.

    While a full discussion of observability and monitoring measurement is beyond the scope of this article, consider the following types of metrics for assessing these practices:

    • Incident frequency: How often do incidents (especially severe incidents) occur that impact production systems? Ideally, SREs will see a decrease in incident frequency that correlates with increased use of observability and monitoring tools.
    • Rollback frequency: The less often an application release is rolled back to a previous version, the more effective the SRE team’s observability and monitoring practices likely are.
    • Mean-time-to-remediate (MTTR): MTTR is a measure of the overall time it takes to resolve a reliability problem. It reflects how well you monitor (which determines how quickly you detect problems) and how well you observe (which is the key to resolving problems).
    • Total data analyzed: Tracking the total volume of data that you collect and analyze through observability and monitoring tools helps you assess the overall scope and scalability of your practices.
    • Total systems analyzed: In addition to tracking total data volume, consider measuring how many discrete applications, hosting environments, CI/CD tools and other systems you are managing as part of observability and monitoring workflows.

    The ultimate goals of SREs extend beyond observability and monitoring. However, observability and monitoring serve as essential means to the broader ends that SREs are tasked with achieving: Maximizing uptime and performance. And while monitoring alone was once sufficient for supporting the goals of SREs, it’s very difficult to imagine an SRE team today that doesn’t also make extensive use of observability, which takes monitoring to the next level.