Tag: DevOps metrics

  • Open Standards Are Key For Realizing Observability

    Open Standards Are Key For Realizing Observability

    Observability has quickly become a major focus of enterprise DevOps. Yet tool sprawl and complexity can hold some observability initiatives back. The 2022 CNCF Microsurvey on observability trends found that 23% of organizations use between 10 and 15 tools for monitoring, metrics and gathering logging and tracing data. A full 50% also noted that engineers and teams using multiple tools presented a top challenge to observability.

    I recently met with Dotan Horovits, principal developer advocate for Logz.io, to get his take on improving how modern development teams handle observability. According to Horovits, open standards and open source projects are the principal drivers to realizing interoperable observability industry-wide. Below, we’ll consider the issues facing observability and introduce OpenTelemetry, a CNCF project quickly gaining traction to unify telemetry data from various sources.

    Open Standards For The Win

    Although proprietary monitoring agents have a lot of intelligence, they inherently use tight coupling between telemetry generation and the backend storage analytics, said Horovits. This can cause vendor lock-in and lead to formatting variations in telemetry data between toolsets. “The open standards have the power to converge our industry to prevent vendor lock-in, even the playing field, and allow us to get any telemetry for any source,” said Horovits.

    Without an open standard, supporting the evolving suite of technologies at the heart of modern polyglot software stacks is challenging. Organizations constantly add to their tech stack, from SQL to NoSQL, Kafka, API gateways and serverless cloud services, and these modules produce varying data formatted in unique styles. What’s more, companies are typically using more than one cloud vendor, further necessitating the need for a decoupled method to represent multi-cloud metrics. “As soon as your IT stack becomes this complex, there is a need to aggregate all telemetry into one unified observability standard,” explained Horovits.

    Introducing OpenTelemetry

    OpenTelemetry is described as a “high-quality, ubiquitous and portable telemetry to enable effective observability.” Using OpenTelemetry (sometimes abbreviated as OTel), engineers can generate, collect and export metrics, logs and traces. OpenTelemetry works with many popular libraries and is completely vendor-neutral and supported by a rising number of tools in the space. OpenTelemetry was accepted to CNCF on May 17, 2019, and is an incubating project.

    The OpenTelemetry registry boasts hundreds of libraries and plugins to export and transform telemetry data from many different environments, from legacy to contemporary sources. By decoupling the data collection and export process, OpenTelemetry is “one agent to rule them all,” Horovits explained. Of course, he added, vendors who adopt OpenTelemetry may still provide their own logic behind it.

    The Benefits of More Open Telemetry Data

    At the time of writing, live public repository data shows OpenTelemetry is the second-most active CNCF project, behind Kubernetes. So, why is the observability community so excited about OpenTelemetry? Well, for one, the interoperability it affords could equate to efficiency and time savings. “OpenTelemetry gives you the freedom to integrate throughout the stack,” stated Horovits. Part of this is because its open source roots make it a force multiplier. “You can never achieve such vast coverage with closed source as you would with a wide-open community,” Horovits said.

    Arguably, an open telemetry toolset has also become necessary due to the sheer complexity of cloud-native architectures. Most organizations are shifting to a distributed microservices architecture supported by a dynamic, elastic container-based infrastructure. In this world, a single service might span multiple clusters. Therefore, engineers might need to consider clusters, pods, nodes and namespaces when filtering for data.

    In this complex reality, there are many dimensions, multiplying what needs to be monitored. And in general, traditional monitoring systems become ineffective at this level. Tool sprawl and lack of consolidation are problems that arise when trying to cater to many environments simultaneously. Thus, a unified, decoupled observability platform makes a lot of sense.

    Future of OpenTelemetry

    We’ve seen vast adoption from cloud vendors and solution providers around OpenTelemetry. And, the project has been moving swiftly—OpenTelemetry has had a distributed tracing specification released for about a year. The project almost has a release candidate for metrics and one for logs is in the works, said Horovits.

    Beyond that, one feature that Horovits is excited about is continuous profiling, which could help users continuously analyze a function and track usage trends across instances. Another exciting potential development is eBPF. Since it’s language-independent and runs at the kernel level, eBPF could extract observability signals without requiring application-specific hooks or integrations. This could increase support for more environments.

    For more information, you can visit the OpenTelemetry site to peruse the documentation or read up on the feature roadmap for OpenTelemetry. Horovits also gave this helpful presentation on OpenTelemetry at KubeCon 2022.

  • 3 Ways API Analytics Can Help Application Owners

    3 Ways API Analytics Can Help Application Owners

    Software development is fraught with risk that can run projects aground like a ship against a rocky beach. Whether it is misunderstood requirements, rapidly evolving marketplaces or old-fashioned bugs and schedule slippage, all can derail otherwise well-resourced and managed software development projects.

    Even when software development teams eventually ship their product and collect payment from their customers, there is no guarantee that the product will be used. A 2022 study found that among those paying for SaaS software, 29% of their software is either underutilized or wasted. This study also noted that only 33% of IT professionals track SaaS software usage. The takeaway here is stark: As an industry, most of our labor is not going to productive ends. 

    This is not a new trend in software; an entire ecosystem of tooling exists to help software development companies collect user engagement metrics to drive development decisions. In fact, out of the top 10 million websites in the world, nearly two-thirds have an analytics solution in place. By contrast, however, API applications lag far behind in adoption of this practice. It is difficult to get market penetration data for API analytics, but a report from API management vendor Apigee revealed that even among its customers (that is, those who were already paying for a service that included API analytics), only 26% made use of the analytics functionality. This gives credence to the belief that most features go unused.

    API application owners who are not integrating real-world analytics usage data into their decision-making process are leaving time and money on the table. Despite not having immediate access to user behavior, API analytics can be quite valuable in helping API application owners make better decisions about application development and maintenance. 

    API application owners should look to the following three ways to make better product development decisions.

    Prioritize Feature Development in the Most Actively Used Areas of the Application

    One of the best lessons I learned from working at a bike shop is “stock what sells.” In other words, there’s no point in filling your shelves with products that your customers aren’t buying. The same goes for stocking your API product catalog with endpoints that your customer isn’t using. 

    API analytics allow API product owners to measure the use of features and evaluate their effectiveness. Product owners can use this valuable information to prioritize extending popular features or developing new features, with a clear yardstick for measuring usage. Further, this data enables development teams to “maximize the amount of work not done,” by shipping preliminary feature sets and evaluating usage metrics before a full implementation. Likewise, if the real-world feedback is not encouraging, it allows you to pivot to another opportunity within the product.

    Deprecate or Sunset Unused Application Features

    Unused code and features are a liability to an API product organization and can carry bugs, create performance problems and introduce security risks. I’ve seen situations as a software developer where these older features were written by developers who have long since left the organization. These unused sections often harbor serious security flaws and vulnerabilities (such as software dependencies that go unpatched for years) and dubious authorization logic that no one at the company fully understands.

    Unused, extraneous features also contribute to a bloated product that can distract end users from the core value of your API. It can be difficult to advocate for the removal of “working product features,” but API analytics data can help make a strong case that certain features are nothing but an expensive distraction. Removing old, unused parts of your application also frees developers to focus on the parts that users love. 

    Prioritize Performance Improvements

    Performance is often a fine balance between implementation time/costs and product requirements.

    It’s a well-understood maxim in software development that premature optimization is the root of all evil. Yet in the absence of real-world performance data, determining what represents premature optimization versus totally-necessary-and-prudent optimization often comes down to a subjective argument among engineers or worse, a risk-averse software development culture that contributes to slow time-to-market.

    Having an objective measure of performance impact, like the number of instances in which clients are impacted by suboptimal performance, can help application owners decide how to allocate their budget to improving performance versus developing new features or fixing bugs. Moreover, having this feedback loop in place can empower development teams to take a nimble “go fast, release often and evaluate” approach to development. Rather than optimizing performance up front out of fear that invisible problems will lead to bad performance and dissatisfied users, performance can be tracked and reviewed over time. 

    Selecting API Analytics Solutions

    API product owners operating a single application have a variety of choices when it comes to deciding which analytics tool to use for their product. Many specialized solutions exist for individual API development languages and frameworks. However, security teams have a unique problem: They need all the data, across all applications and across all the tech platforms within the organization. In that case, I recommend an API protection vendor with strong API analytics capabilities that not only protects against threats but also gives you the visibility you need to prioritize efforts. 

    API analytics should be a tool that powers innovation. Don’t leave it unused in your toolbox. 

  • Splunk Adds Data Management Tools to Observability Platform

    Splunk Adds Data Management Tools to Observability Platform

    At its .conf22 event, Splunk today announced it is making it easier to both onboard data and then manage it across hybrid IT environments via the Splunk Cloud Platform.

    In addition, Splunk Enterprise is being extended to add support for Microsoft Azure with SmartStore for Azure to store cold data alongside existing support for Amazon Web Services (AWS) and Google Cloud Platform (GCP). There is also a developer edition of Splunk Cloud that enables developers to create and test their own applications, which is currently in preview.

    Garth Fort, senior vice president and chief product officer for Splunk, said the overall goal is to make it easier to automatically tune the parameters used to store data in the Splunk observability platform. As more organizations embrace observability as a DevOps best practice, many of them are encountering challenges managing the large volumes of data they are now collecting in the form of logs, metrics and traces.

    The Data Manager for Splunk Cloud Platform will initially be made available on AWS and Azure, with support for GCP to come later this summer. In effect, it provides IT teams with a control plane for data management that spans multiple clouds.

    Ingest Actions, meanwhile, makes it possible to apply granular controls that enable IT teams to filter, mask and route data in motion within the Splunk Platform or to external AWS S3 cloud storage services.

    Other capabilities Splunk unveiled at the conference include an expansion of Federated Search tools to enable a single pane of view across their entire Splunk ecosystem and a fully managed Splunk Assist service for Splunk Enterprise 9.0 that provides customers with deep insights into their security environment.

    Finally, the company has enhanced Splunkbase, a framework for accessing curated collections of more than 2,500 applications and integrations provided by Splunk and its third-party partners.

    As the pioneer of IT operations analytics, Splunk has a large footprint within enterprise IT environments. It is now looking to expand that base to become an observability platform provider. It’s still early days as far as the transition to observability is concerned, but the goal is to make it simpler for IT teams to query platforms and surface issues that could lead to an IT disruption before it happens.

    It’s not clear how many organizations have the skills and expertise required to formulate those queries, but over time it should become more feasible to augment an IT staff with machine learning algorithms capable of discovering those issues.

    In the meantime, IT organizations are collecting more data than ever about their IT environments. In theory, that data will provide the context needed to optimize application environments that get more complex with each passing day. The challenge, of course, then becomes finding a way to efficiently store and manage all that data both before and after it has been analyzed.

    Regardless of the approach to observability, the need to go beyond simple monitoring of IT environments has never been more apparent.

  • LogicMonitor Expands Reach and Scope of Observability Platform

    LogicMonitor Expands Reach and Scope of Observability Platform

    At its LM Elevate user conference, LogicMonitor today formally launched LM Envision, an observability platform that incorporates artificial intelligence (AI) to both discover and then remediate issues.

    LogicMonitor CEO Christina Kosmowski said LM Envision is the only observability platform available via a software-as-a-service (SaaS) model that can be applied to both on-premises and cloud applications. In total, there are already more than 2,000 integrations for the platform as part of the open LM Envision ecosystem, she noted.

    Over the last year, additional capabilities have been developed and added to the observability platform. These include application performance monitoring (APM) tools to identify bottlenecks and optimize performance, expanded support for public clouds and Kubernetes environments, integration with the StackStorm automation platform, integration with Terraform infrastructure-as-code tools and more advanced tools for searching logs.

    The company has also extended its AI operations tools to provide more context when troubleshooting issues by aggregating logs and including topology tools and graphs.

    Finally, LogicMonitor has added a push metrics application programming interface (API) to make it simpler to ingest data, pre-integrated dashboards and support for open source OpenTelemetry agent software.

    Kosmowski said it’s only a matter of time before observability and AIOps converge to the point where IT teams will finally be able to spend less time managing platforms. One of the major challenges IT teams face is that each platform they use requires its own framework to monitor and manage it. As observability and management frameworks converge, the overall overhead associated with managing modern IT environments should steadily decline as machine learning algorithms make it easier to surface issues before they create a major disruption, she noted.

    The overall goal is to close the loop between the discovery of an IT issue and its remediation, Kosmowski added.

    Observability, of course, is one of the core tenets of any set of DevOps best practices. Achieving it, however, has always been a challenge. The goal now is to eventually replace the hodgepodge of monitoring tools that track a limited set of pre-defined metrics with an observability platform that not only aggregates metrics but enables DevOps teams to launch queries and surface IT issues. In some instances, the rationalization of monitoring tools will help justify the acquisition of an observability platform. The paradox is that, as IT environments become more complex, it may actually become easier to manage those environments as more applications become instrumented and the various silos that isolate IT teams from one another start to collapse.

    In the meantime, there is no shortage of observability platform options. The primary difference between each of them is the degree of integration they provide and their ability to employ AIOps to automatically resolve issues, said Kosmowski. Each minute DevOps teams don’t spend on managing IT platforms is a minute that can be applied to spurring innovation, she added.

    One way or another, DevOps teams will soon have more access to information about their IT environments than ever. Less clear is how much of the data being collected by observability platforms will actually constitute actionable intelligence. But as observability continues to evolve, it’s now more a question of the degree to which that goal will be achieved versus if or when.

  • Datadog Adds Support for OpenTelemetry Protocol

    Datadog Adds Support for OpenTelemetry Protocol

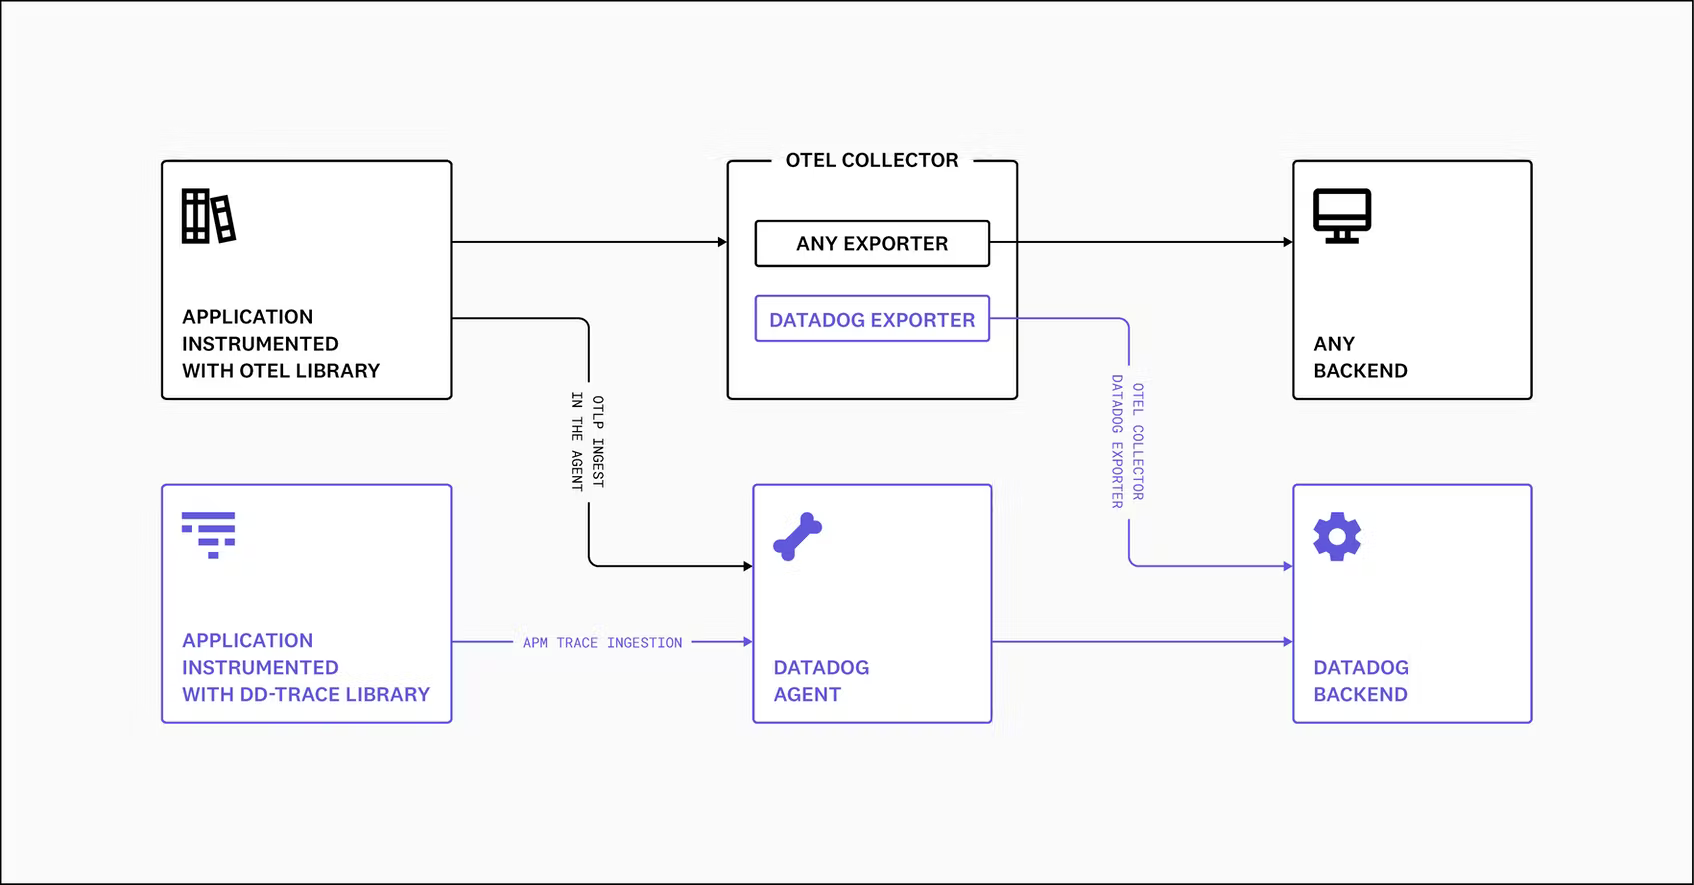
    At the KubeCon + CloudNativeCon Europe 2022 event, Datadog announced it made support for the OpenTelemetry Protocol (OTLP) generally available in the agent software it provides to instrument applications.

    Ilan Rabinovitch, senior vice president of product and community at Datadog, said that capability eliminates the need to install a separate OpenTelemetry collector to aggregate metrics, logs and traces from applications instrumented using the open source OpenTelemetry libraries being advanced under the auspices of the Cloud Native Computing Foundation (CNCF).

    The Datadog Agent can already collect application profiles, network data and infrastructure metrics via more than 500 integrations provided by Datadog. OpenTelemetry extends that capability with a set of application programming interfaces (APIs) and a wire protocol for instrumenting applications.

    Datadog is the latest in a series of providers of observability platforms that added support for the OpenTelemetry project that continues to gain momentum. The goal is to make it less costly to instrument applications using open source agent software that surfaces a consistent set of interfaces. Previously, each observability platform provider developed their own agent software that DevOps teams would need to install. Datadog is making a case for agent software that, in addition to collecting data from existing applications, is now compatible with the OLTP protocol created by contributors to the OpenTelemetry project.

    The issue that DevOps teams will need to come to terms with is that while OpenTelemetry agent software is free, many of them have already installed proprietary agent software to instrument applications. That agent software can often provide additional context that is not yet available in OpenTelemetry. History, however, shows that, in time, open source projects with larger numbers of contributors will outpace the ability of any single vendor to innovate.

    One way or another, DevOps teams will be instrumenting more applications as more microservices-based applications are deployed. The dependencies that exist between microservices make it too difficult to manage an application environment without additional instrumentation. The goal within many DevOps teams is to eventually replace the hodgepodge of monitoring tools that track a limited set of pre-defined metrics with an observability platform that not only aggregates metrics but enables DevOps teams to launch queries and surface IT issues before they become a major issue. In some instances, the rationalization of monitoring tools will help justify the acquisition of an observability platform.

    Observability, of course, is one of the core tenets of any set of DevOps best practices. Achieving it, however, has always been a challenge. Rabinovitch said an observability platform that regularly surfaces critical IT issues without requiring DevOps teams to launch queries to search for anomalies will eventually win the battle for observability supremacy.

    In the meantime, there is already no shortage of observability platforms. The challenge will be determining which one enables the highest level of instrumentation at the most reasonable cost.

  • GitLab Adds Fourth DORA Metric API to CI/CD Platform

    GitLab Adds Fourth DORA Metric API to CI/CD Platform

    The latest update to GitLab’s namesake continuous integration/continuous delivery (CI/CD) platform has added support for the application programming interface (API) for measuring change failure rates. This addition supports the fourth metric as defined in the DevOps Research and Assessment (DORA) framework.

    Version 14.10 of GitLab also expands the GitLab Runner Operator for Kubernetes to any distribution of the open source platform in addition to making it possible to manually trigger incident responses when needed.

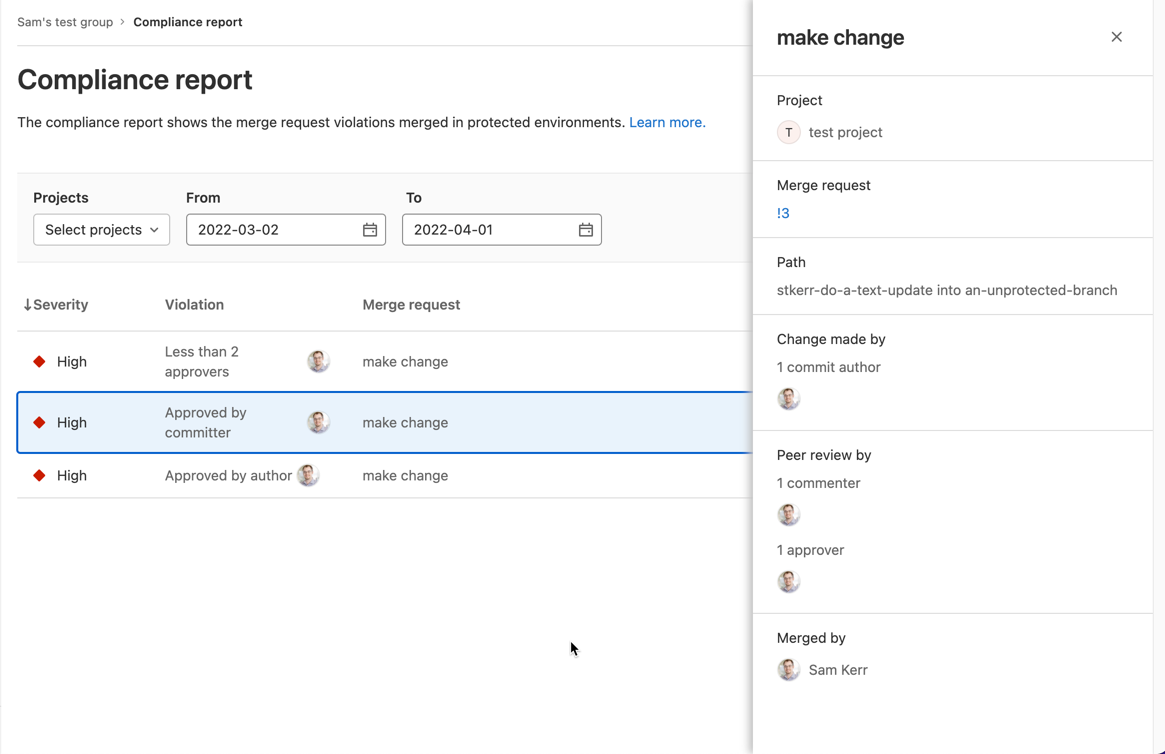
    Finally, a compliance report that surfaces every individual merge request violation has been added along with a tool for setting up streaming audit events.

    Brendan O’Leary, staff developer evangelist for GitLab, said that as DevOps processes continue to mature, DORA metrics make it simple for IT leaders to measure overall progress. While it’s not likely that any single set of DevOps practices will be universally implemented across an entire enterprise, O’Leary noted it’s important for DevOps teams to keep track of key performance indicators (KPIs) that enable teams to identify areas for ongoing improvement. For example, it’s not uncommon for technical debt to accumulate in the absence of metrics that track the progress of builds, he added.

    In general, a transition to microservices-based applications is increasing the need for CI/CD platforms that make it simpler to build them. Each of these applications is constructed using microservices that are typically built independently of one another. The challenge is that each microservice has dependencies on other microservices, so the need for DevOps workflows to optimally manage that development process is becoming more widespread, noted O’Leary.

    In some cases, organizations are deploying a CI/CD platform for the first time to build these applications. In other cases, they are looking to replace a CI/CD platform that was adopted to build legacy monolithic applications. Regardless of the type of application, there is a need to continuously refine and improve software engineering practices to increase developer productivity.

    It’s not clear to what degree developers are voting with their feet to work for one organization versus another based on the overall quality of developer experience. Organizations that do have a consistent approach to software engineering, however, make it easier for developers to spend more time writing code rather than managing the build process. The challenge is to make sure the DevOps platform itself does not become a bottleneck that hinders the rate at which developers can build code. It’s also not clear whether organizations are building applications faster than they can secure it and ensure overall quality. The only way to know for sure is, of course, to track metrics.

    Naturally, not every developer is a fan of metrics. Application development is still as much art as it is science. There is, however, a general appreciation that the amount of code that needs to be written far exceeds the available talent to write it; any effort to make software engineering more efficient benefits everyone involved. As such, given all the code that needs to be written, a software engineer is often today the best friend a developer can have.

  • What’s the Difference Between SLI, SLA and SLO?

    What’s the Difference Between SLI, SLA and SLO?

    If you’re just getting into site reliability engineering (SRE) or platform engineering, you’ve probably come across a bunch of new terminologies, like SLI, SLA and SLO. These benchmarks are commonly referenced in the day-to-day life of an SRE but may seem foreign to outsiders. So, what are the differences between these abbreviations?

    Well, one of the hallmarks of the SRE approach is to gauge performance and set targets for application metrics. These targets can be thought of as reliability thresholds. If a site’s latency reaches a certain point, for example, it may break the agreement the software provider has with its consumer.

    SREs create and monitor service-level performance benchmarks for all sorts of metrics, such as uptime, latency, error count, mean-time-to-recovery and throughput, among others. But not all these performance goals are part of public agreements. Companies usually take a more proactive approach to setting more internal targets to stay far away from breaking external agreements and user trust. It’s become a best practice to set these baselines to retain functional, reliable systems.

    As mentioned, the type of targets range from firm partner commitments to more internal goals. Below, we’ll attempt to define, in simple terms, the differences between service-level agreement (SLA), service-level objective (SLO) and service-level indicator (SLI). While these concepts share many similarities, it’s important to understand how they are applied in practice. Keep in mind that each company may have a nuanced understanding of these terms and may conceive and apply them differently.

    Service-Level Indicator (SLI)

    First off, service-level indicators (SLIs) refer to the actual metrics produced by software services. This is a direct measurement of a service’s behavior. These are the real numbers that indicate overall performances, such as error rate and latency over time.

    One example of SLI would be the number of successful requests out of total requests over a one-month period. Say an engineer used an application monitoring tool that ingests data from production logs. This data showed that out of one million requests made, ten requests failed. An SLI for availability would thus be 99.999% uptime.

    Service-Level Agreement (SLA)

    Second, most technologists are familiar with service-level agreements (SLAs). Even if you’re not, you’ve likely agreed to many throughout your history as a digital user. SLAs are like a pact between the software provider and the software user or client. These binding commitments often note availability expectations that must be upheld. SLAs may also include responsiveness to incidents and bugs. It depends on the contract, but if an SLA is broken, some kind of penalty may be incurred such as a refund or a service subscription credit.

    These days, the average business relies on many cloud-based SaaS, PaaS and IaaS. Just to initiate something as simple as an online payment might require hitting multiple remote servers. But if all these services just went offline whenever they felt like it, our digital operations would come to a grinding halt. SLAs are thus necessary for enterprise software contractual agreements to ensure both parties meet specific standards.

    Once an engineer tracks SLIs and has an idea of typical behavior, they can then set an SLA that makes sense. If we take the example above, an SRE may consider guaranteeing a lower threshold than what is being actively monitored. This would ensure that application performance, at its current pace, doesn’t break any legal or contractual obligations. In this scenario, perhaps the SLA mentions an availability objective: No more than 100 requests fail per one million requests made. This would essentially equate to 99.99% uptime.

    Service-Level Objective (SLO)

    Lastly, service-level objectives (SLOs) are similar to SLAs but explicitly refer to the performance or reliability targets. An SLA may refer to specific SLOs. Or SLOs may be tracked just for internal purposes. As Google described, “the availability SLO in the SLA is normally a looser objective than the internal availability SLO.”

    You don’t want the end users to be the first people clamoring about a 400%+ latency rise in your mobile web apps. Thus, SRE teams typically keep a close eye on performance to ensure they never even get close to breaking SLAs. Some do this by setting and monitoring internal baselines that are more ambitious than the SLA threshold.

    If we take our example above, if an SLA guarantees a service uptime of 99.99%, the business may set an internal target of 99.995%. In other words, for every one million requests, no more than 50 should fail. If software systems aren’t hitting these marks, it’s a sign that the company must reevaluate designs and search for bottlenecks. Or, perhaps engineering teams have goals to improve the average downtime for the next quarter—an internal objective could be set at a higher standard than the currently perceived performance.

    As the Google Cloud blog described, “every service should have an availability SLO—without it, your team and your stakeholders cannot make principled judgments.” It’s a good reminder to be modest in your reliability commitments, they added, as consumers will come to expect this level of performance. On the other hand, setting more ambitious internal performance targets has the benefit of delivering a better result than the agreement on paper, increasing a software service’s competitiveness.

    Real-World Performance Benchmarks

    Keep in mind that the above numbers are simply for demonstration purposes. One interesting resource for real-world figures is API.Expert, a service that queries popular APIs and posts weekly performance statistics. Since APIs are the heart of many UI-based platforms (and our digital economy at large), these benchmarks stand as a good indicator of average uptimes and latencies in the industry.

    For example, at the time of writing, API.Expert’s Enterprise APIs collection ranked Microsoft Office365 and Pivotal Tracker at the top, both with a 100.00% pass rate and a 220 ms and 248 ms latency, respectively. On the other end of the spectrum, Docusign is at 99.93% with an 877 ms latency and Box is at 99.99% with 414 ms latency.

    SLIs, SLAs and SLOs—Oh My!

    Although it may sound good to an unpracticed ear, an SLA of 99.99% still equates to 52 minutes and 36 seconds of downtime per year. That’s nearly an hour of downtime in which customers are left scratching their heads or, worse, searching for other options. For traumatic health care situations, a loss of connectivity could be a matter of life and death.

    Although creating SLAs and SLOs is important to gauge system health, the reality is that it can be challenging to track and enforce them. “These agreements—generally written by people who aren’t in the tech trenches themselves—often make promises that are difficult for teams to measure,” according to the Atlassian knowledge center.

    In summary, SLIs demonstrate the real behavior of software systems. These metrics inform the creation of SLAs, which must be met to ensure B2B agreements. These SLAs often reference particular service-level objectives (SLOs) that must be met, which usually give more breathing room around SLIs. Lastly, in a digital economy with accelerating digital expectations, it makes sense to monitor internal SLOs and improve baselines over time.

  • New Relic Adds SLO Tools to Observability Platform

    New Relic Adds SLO Tools to Observability Platform

    New Relic this week made a service level indicator (SLI) and service level objective (SLO) capability generally available within the New Relic One observability platform. The new capability makes it possible for DevOps teams to customize metrics, unified health reports and alerts.

    Alex Kroman, general manager and senior vice president for product engineering for New Relic, said the goal is to enable DevOps teams to more easily optimize services that span multiple applications and software components at a time when more organizations are relying on software to drive digital business transformation initiatives.

    IT teams have, of course, been tracking SLOs for decades. However, as application environments have become more distributed—thanks, in part, to the rise of microservices—achieving and maintaining SLOs has become more challenging. DevOps teams often lack an understanding of which metrics are most relevant to the business and even when they do, they have historically relied on manual processes and ad hoc tooling, noted Kroman.

    In contrast, New Relic is providing those capabilities in a way that makes it simpler to manage service levels at no additional cost, he added. DevOps teams can, for example, create SLIs in one click to automatically establish a baseline of desired performance and reliability. The platform also provides recommendations based on historical data to both establish benchmarks and customize and configure SLIs and SLOs.

    Those capabilities make it simpler to set service boundaries and track reliability across teams based on benchmarks, tags and reports that include bespoke views for both service owners and business leaders. In effect, via an application programming interface (API) exposed by New Relic, it becomes possible to employ dashboards to gain visibility across an entire business process, said Korman.

    It’s still early days as far as the modernization of SLOs is concerned, but it’s clear that, over time, they will be managed as code along with everything else in a DevOps workflow. The more organizations become dependent on applications to drive digital business initiatives, the more critical it will become for DevOps teams to track SLOs. The decision that must be made is the degree to which it makes sense to manually implement some form of SLO-as-code versus relying on an observability platform that can be accessed as a cloud service.

    Observability, of course, has always been a core tenet of DevOps. Few organizations are able to really achieve it, however, because most IT teams have been monitoring little more than a pre-defined set of metrics. Modern observability platforms make it easier for site reliability engineers (SREs) to launch queries against aggregated instances of metrics, logs and distributed traces to ascertain the root cause of an issue. The issue then becomes how to correlate the results of those queries against the service levels that businesses expect from a set of applications that might be driving, for example, an order-to-cash process. After all, knowing what occurred within an IT environment doesn’t always easily translate into a report that the average business executive can easily comprehend.

  • Log Management Challenges Grow With Observability Adoption

    Log Management Challenges Grow With Observability Adoption

    It appears that, in many IT environments, observability is becoming too much of a good thing. A global survey of more than 315 IT executives, cloud application architects, DevOps professionals and site reliability engineers (SRE) conducted by Dimensional Research on behalf of log data management platform provider Era Software, found 96% are witnessing an explosion of log data.

    The survey also found 79% of respondents reported the overall cost of observability and log management will skyrocket in 2022 if current tools don’t evolve.

    More than three-quarters of respondents (78%) also noted attempts to manage volumes of log data have had mixed or unwanted results such as an inability to access data. Nearly two-thirds (65%) are also evaluating their observability options while the other 41% are considering it.

    Stela Udovicic, senior vice president of marketing for Era Software, said the survey makes it clear that as organizations rely more on logs to analyze IT events, the cost of storing all that log data is becoming a significant challenge. Overall, the survey finds usage of observability tools and platforms has jumped by 180% as IT teams struggle to manage increasingly complex IT environments.

    On the plus side, more business users are benefiting from log data. A full 83% of respondents report that business stakeholders outside of IT use insights from log data, with 96% reporting log data is being used to solve business problems.

    Observability has always been a core tenet of DevOps best practices, but achieving it has always been a challenge. Monitoring tools are designed to consume predefined metrics to identify when a specific platform or application is performing within expectations. The metrics tracked generally focus on, for example, resource utilization. However, whenever there is an issue, it can still take days, sometimes weeks, to discover the root cause of an issue through what amounts to a process of elimination.

    In contrast, observability combines metrics, logs and traces—a specialized form of logging—to instrument applications in a way that makes it simpler to troubleshot issues without relying solely on a limited set of metrics that have been predefined to monitor a specific process or function. DevOps teams can employ queries to interrogate data in a way that makes it easier to discover the root cause of an issue. Observability platforms correlate events in a way that makes it easier for analytics tools to identify anomalous behavior indicative of an IT issue.

    The issue that arises is that IT teams need to find a way to store all the data generated by the logs they need to analyze. Each IT team can, of course, could reduce the amount of log data they retain. However, there is always a concern that in the event of an incident critical log data won’t be available.

    Udovicic said most IT organizations have historically viewed storing log data as a necessary evil. The primary issue most of them encounter is the simple fact that log data is not easy to work with, she noted.

    Regardless of how organizations view log data, the amount of it that needs to be managed will only increase as DevOps workflows become more mature. The issue IT teams need to come to terms with now is finding a way to minimize the cost of storing it all.

  • LogDNA Survey Surfaces Observability ROI Concerns

    LogDNA Survey Surfaces Observability ROI Concerns

    A Harris Poll of 200 senior engineering professionals suggests it may be a while before most DevOps teams are able to achieve true observability in their IT environments.

    The survey was conducted on behalf of LogDNA, a provider of an observability platform, and found nearly three-quarters of respondents (74%) are struggling to achieve their observability goals despite investing hundreds of thousands of dollars. In fact, well over a third (38%) said they are already investing $300,000 annually on observability tools.

    Despite those investments, less than half of respondents are very satisfied with their ability to use log data. Key areas of frustration include the challenges of collaboration with colleagues spanning multiple teams (67%), the fact that the tools are not easy to use (66%) and the routing of security events (58%).

    Nevertheless, the bulk of survey respondents said they are optimistic about observability. A full 85% of participants said they believe true observability is possible.

    LogDNA CEO Tucker Callaway said the core issue that many organizations fail to recognize is that observability is really a data literacy and management challenge. Organizations are collecting logs, metrics and traces from a wide range of tools and platforms without thinking through optimal data pipeline construction. The result is an aggregation of data that has not been normalized to simplify surfacing actionable intelligence, he said. In fact, many organizations quickly discover that all they’ve really accomplished is increase their data storage costs, said Callaway.

    In the absence of that data normalization, Callaway noted it becomes exceedingly difficult for cross-functional teams to query all the data being collected within a repository.

    At its core, observability promised to make it easier to identify IT issues before they cause a disruption. Observability in one form or another has always been a core tenet of any DevOps best practice. Initially, DevOps teams focused on continuous monitoring as the most effective way to proactively manage application environments. However, it can still take days, sometimes weeks, to discover the root cause of an issue. Observability platforms make it possible to correlate events in a way that makes it easier for analytics tools to identify anomalous behavior that might be indicative of the root cause of an IT issue.

    In contrast, traditional IT monitoring focuses on predefined metrics to identify when a specific platform or application is performing within expectations. Observability platforms combine metrics, logs and traces—a specialized form of logging—to make it easier for IT professionals to interrogate data being generated by a wide range of DevOps tools and platforms.

    Of course, the assumption is that DevOps teams actually know what queries to launch to determine what the root cause of an IT issue might be. In the longer term, machine learning algorithms should make it easier to identify anomalies within IT environments. In the meantime, however, achieving observability still requires a fair amount of DevOps expertise that is not always readily available.

    Eventually, observability will become much more automated than it generally is today. As that transition occurs, IT teams should find the ROI of observability is steadily improving.