Tag: DevOps metrics

  • Grafana Labs Slashes Time to Create Observability Dashboards

    Grafana Labs Slashes Time to Create Observability Dashboards

    At its GrafanaCON 2023 event today, Grafana Labs updated its core platform for visualizing data which makes it simpler to set up dashboards in minutes. The updates are part of a celebration of the 10th anniversary of a tool that is now widely used by DevOps teams.

    Ryan McKinley, a distinguished engineer for Grafana Labs, said Grafana 10 should help make DevOps more accessible to a wider range of practitioners with limited experience working with observability tools. The latest release also makes it simpler to share knowledge with external stakeholders via public dashboards, he added.

    In addition, Grafana 10 adds expanded role-based access control (RBAC) capabilities and streamlined implementation of the secure access markup language (SAML) to ensure authentication.

    Grafana Cloud has also been updated to provide a secure way to connect to data residing in an on-premises IT environment or in a cloud with the observability platform the company provides via a software-as-a-service (SaaS) platform.

    Finally, Grafana Labs is also making the engine it created to visualize data more accessible to third-party developers that are embedding visualizations based on Grafana within their applications, noted McKinley.

    Grafana Labs

    There are now more than 150 plugins for various data sources that have been made available to more than 20 million users of the Grafana visualization framework. Not all those users are working in DevOps environments, but Grafana is widely used to enable observability across increasingly complex IT environments. The Grafana Cloud seeks to capitalize on that popularity by adding a service that uses an instance of open source Grafana Mimir software to store data collected in a format originally defined for the open source Prometheus monitoring tool.

    It’s still early days as far as adoption of observability is concerned, but it’s apparent that as application environments become more complex, the plethora of monitoring tools that DevOps teams rely on will need to be streamlined. Observability platforms promise to unify logs, metrics and traces to simplify launching queries to identify the root cause of an issue.

    The rate at which DevOps teams will embrace observability will naturally vary, but the biggest obstacle might not be the platforms themselves. Instead, the issue is understanding what queries can help DevOps teams better understand the root cause of an IT issue before there is a major disruption. In the long term, it’s expected that machine learning algorithms will leverage the data collected by observability platforms to automatically identify issues that might lead to a disruption long before it actually occurs.

    Of course, the result of any query that gets launched needs to be visualized in a way that is easily understood. Grafana Labs is now making a case for a more integrated approach that, at its core, employs its visualization tools to make it simpler to discern what’s occurring in IT environments. After all, no matter how talented any DevOps team may be, it’s still not possible to manage what was never seen in the first place.

  • What the Convergence of Observability and Security Means for Devs

    What the Convergence of Observability and Security Means for Devs

    There is a scene in the movie Apollo 13 when the mission control flight director asks why the carbon dioxide scrubber in the command module was a different shape than the one used in the lunar module (and therefore incompatible). The engineer simply replied, “This just isn’t a contingency we’ve even remotely looked at.”

    A similar scenario plays out at many organizations when they examine security and development practices. When it’s time for code to go into production, every developer hopes their code will run as planned–smoothly and error-free. Unfortunately, something will be missed, performance could degrade or new, unanticipated problems can emerge after an application is deployed to production.

    Developers fear the “unknown unknowns.” And it keeps them up at night.

    When an “unknown unknown” problem occurs, it takes time for teams to do the forensics to identify the problem. It can take days or even weeks for teams to complete that initial investigation. If a mission-critical application is offline for a significant period of time due to a forensics investigation, then it can negatively affect your customer’s experience and, ultimately, your organization’s bottom line.

    The “unknown unknowns” problem is another challenge facing developers in today’s unpredictable macro environment. That includes the deluge of data, increasing cyberthreats, an increasingly distributed infrastructure and a remote and hybrid workforce as well as a mix of modern cloud-native and monolithic apps.

    To help developers build for the future and address security concerns, it is imperative they rethink the way they are collecting, operationalizing and storing different types of data from a variety of sources.

    Security and Observability: Better Together

    Today, security and observability have recently begun to overlap, driven by the growing need for organizations to better understand the activity inside their environments. Many forward-thinking organizations are operationalizing the massive amounts of log and event data currently being generated to understand and assess issues in their infrastructure and apps and using these actionable insights to optimize workload, app resource availability, security and uptime.

    So how can developers take advantage of the security and observability convergence trend happening right now?

    Currently, it’s common for developers to have two agents as part of their tech stack. One agent for observability, which is collecting data such as logs and events to get relevant insights into the health and performance of their application in real-time. The other agent is for security to collect data in their devtest, integration and production environments.

    Since these two agents often collect the same data, there is an opportunity to consolidate it into a single location, such as a unified security platform with a single agent, where this data can be overlaid with time series analytics to deliver relevant insights to users. Using this approach of having both security and non-security data in one place will significantly speed up the process of getting these valuable insights into the developer’s hands.

    In addition to getting insights faster, another benefit of having this data in a single location is the ability to access historical data. Giving developers the ability to store and manage data for long periods of time allows them to get insights from this historical data, so they can better understand alerts, incidents and adversaries. This can help them correlate in terms of understanding the risk to an application, such as potential “unknown unknown” threats, which they can proactively address before it causes any damage.

    Adopting a converged security and observability approach is the most mature step that organizations can take to help developers deliver the best outcomes and best experiences for their customers and users. As more organizations rely on the cloud and the speed of business rapidly increases, developers must transform their view of the health, performance and security of applications and infrastructure. Giving developers this perspective will dramatically help them take rapid action against an adverse event before it impacts their company’s bottom line.

  • A History of Distributed Tracing

    A History of Distributed Tracing

    Organizations are increasingly using distributed tracing to monitor their complex, microservice-based architectures. Distributed tracing has become essential in microservice applications, cloud-native and distributed systems. Microservices and serverless applications can grow exponentially, which makes observing them at scale very challenging. The traditional logging method becomes expensive, and if there’s an issue, time-series data can reveal symptoms but not the root cause(s). With modern usage patterns of Kubernetes service mesh like Istio and Envoy, for example, there can be billions of microservices calls daily.

    What is Distributed Tracing?

    Traces describe the progress of a transaction or workflow through a system. Distributed tracing provides visibility into service dependencies and their interdependencies by providing end-to-end visibility. Visualizing transactions in their entirety allows you to compare non-normal traces with normal ones to determine differences in behavior, structure and timing. Through distributed tracing, you can identify bottlenecks in your system. As a traced request flows through a network, it can be tracked. 

    As requests flow from frontend to backend and to databases, traces provide diagnostic techniques that reveal how a set of services coordinate to handle an application request. Using distributed tracing, developers can troubleshoot requests with errors and high latency. A single trace typically shows the activity of a request or transaction within an application. A trace shows what has changed at each step. As you aggregate the traces, you can see which backend service or database has the most significant impact on performance. 

    The History of Distributed Tracing

    Dapper, a large-scale distributed systems tracing infrastructure, was introduced by Google in 2010. Two years after Dapper was made public, Twitter open sourced Zipkin, which was designed for application performance tuning. Zipkin was the first open source distributed tracing project. Zipkin trace data can be collected and visualized using a UI. In 2015, Uber launched Jaeger, which was inspired by Dapper and named after the German word for hunter. Later in 2017, Uber published a blog post, called Evolving Distributed Tracing at Uber Engineering, explaining the reasons for the architectural choices in Jaeger. In addition to creating Jaeger, its author, Yuri Shkuro, wrote a book about distributed tracing called Mastering Distributed Tracing. 

    In 2016 Ben Sigelman, founder of Lightstep, wrote a blog post called Toward Turnkey Distributed Tracing, describing OpenTracing as a single standard. Some people refer to this as the OpenTracing Manifesto. OpenTracing allows developers of application code, open source packages and open source services to instrument their code without binding themselves to any particular tracing solution. The goal of OpenTracing was to solve a standardization problem. Trace context must pass through all the components, including application code, dependent libraries, standalone open source services (Nginx, MySQL) and other vendor-specific libraries and services, to collect a complete distributed trace. Collecting a full path without a standard API to define the collection and passing of trace context is difficult. OpenTracing aims to solve this problem by defining a standard API that can be implemented by components from different tracing solutions, allowing the collection of end-to-end tracing data. The Cloud Native Computing Foundation (CNCF) accepted OpenTracing as its third project in October 2016. Two months later, OpenTracing 1.0 was released. After OpenTracing, Jaeger joined the CNCF. 

    W3C tracing context specification was proposed in November 2019, bringing distributed tracing closer to standardization. Over ten years, distributed tracing evolved from one paper to an active community. With standardization on all the layers, it is moving from just tracing to overall observability, ranging from latency optimization to root cause analysis and application performance management. It is moving from a single backend system to an end-to-end solution that spans multiple systems. 

    OpenTracing and OpenTelemetry merged in 2019. Using OpenTelemetry, distributed tracing can be implemented end-to-end. It released version 1.0 in 2021. CNCF’s OpenTelemetry project is one of the fast-growing projects, and OpenTelemetry has become the de facto standard for tracing, metrics and logging.

    How it Works

    Traces in distributed tracing consist of tagged time intervals called spans. It is possible to think of a span as a unit of work. Traces are directed acyclic graphs (DAGs) composed of segments known as spans. According to OpenTelemetry, There are four major components of a trace:

    • traceID
        • A unique 16-byte array to identify the trace that a span is associated with
    • spanID
        • Hex-encoded 8-byte array to identify the current span
    • Trace Flags
        • Provides more details about the trace, such as if it is sampled
    • Trace State
        • Provides more vendor-specific information for tracing across multiple distributed systems. Please refer to W3C Trace Context for further explanation.

    The spans in a trace consist of contiguous segments of work that are named and timed. There are start and end times for spans, as well as metadata such as tags or logs that help classify them. Parent-child relationships may be present between spans to show how particular transactions traverse the application’s numerous services and components. 


    A trace represents an end-to-end request; it can contain one or more spans. Spans indicate work performed by a single service with associated time intervals and metadata. The purpose of traces is to provide a request-centric view of spans through tags. Despite microservices enabling teams to work independently, distributed tracing offers a central resource that allows all teams to understand issues from a user’s perspective.

    Conclusion

    In distributed systems, response latency can have a significant commercial impact. Identifying bottlenecks and understanding how a request moves through a complex system is complicated. Other techniques, like logging and monitoring metrics, don’t provide insight into distributed applications such as those created with microservices architecture. Several open standards and tools are emerging within the distributed tracing space, like OpenTracing and commercial tools that could compete with existing APM solutions. Implementing distributed tracing for modern cloud-native services poses several challenges. OpenTelemetry tracing is necessary for processing high volumes of trace data while generating meaningful insight.

  • Datadog Dives Into Universal Service Monitoring

    Datadog Dives Into Universal Service Monitoring

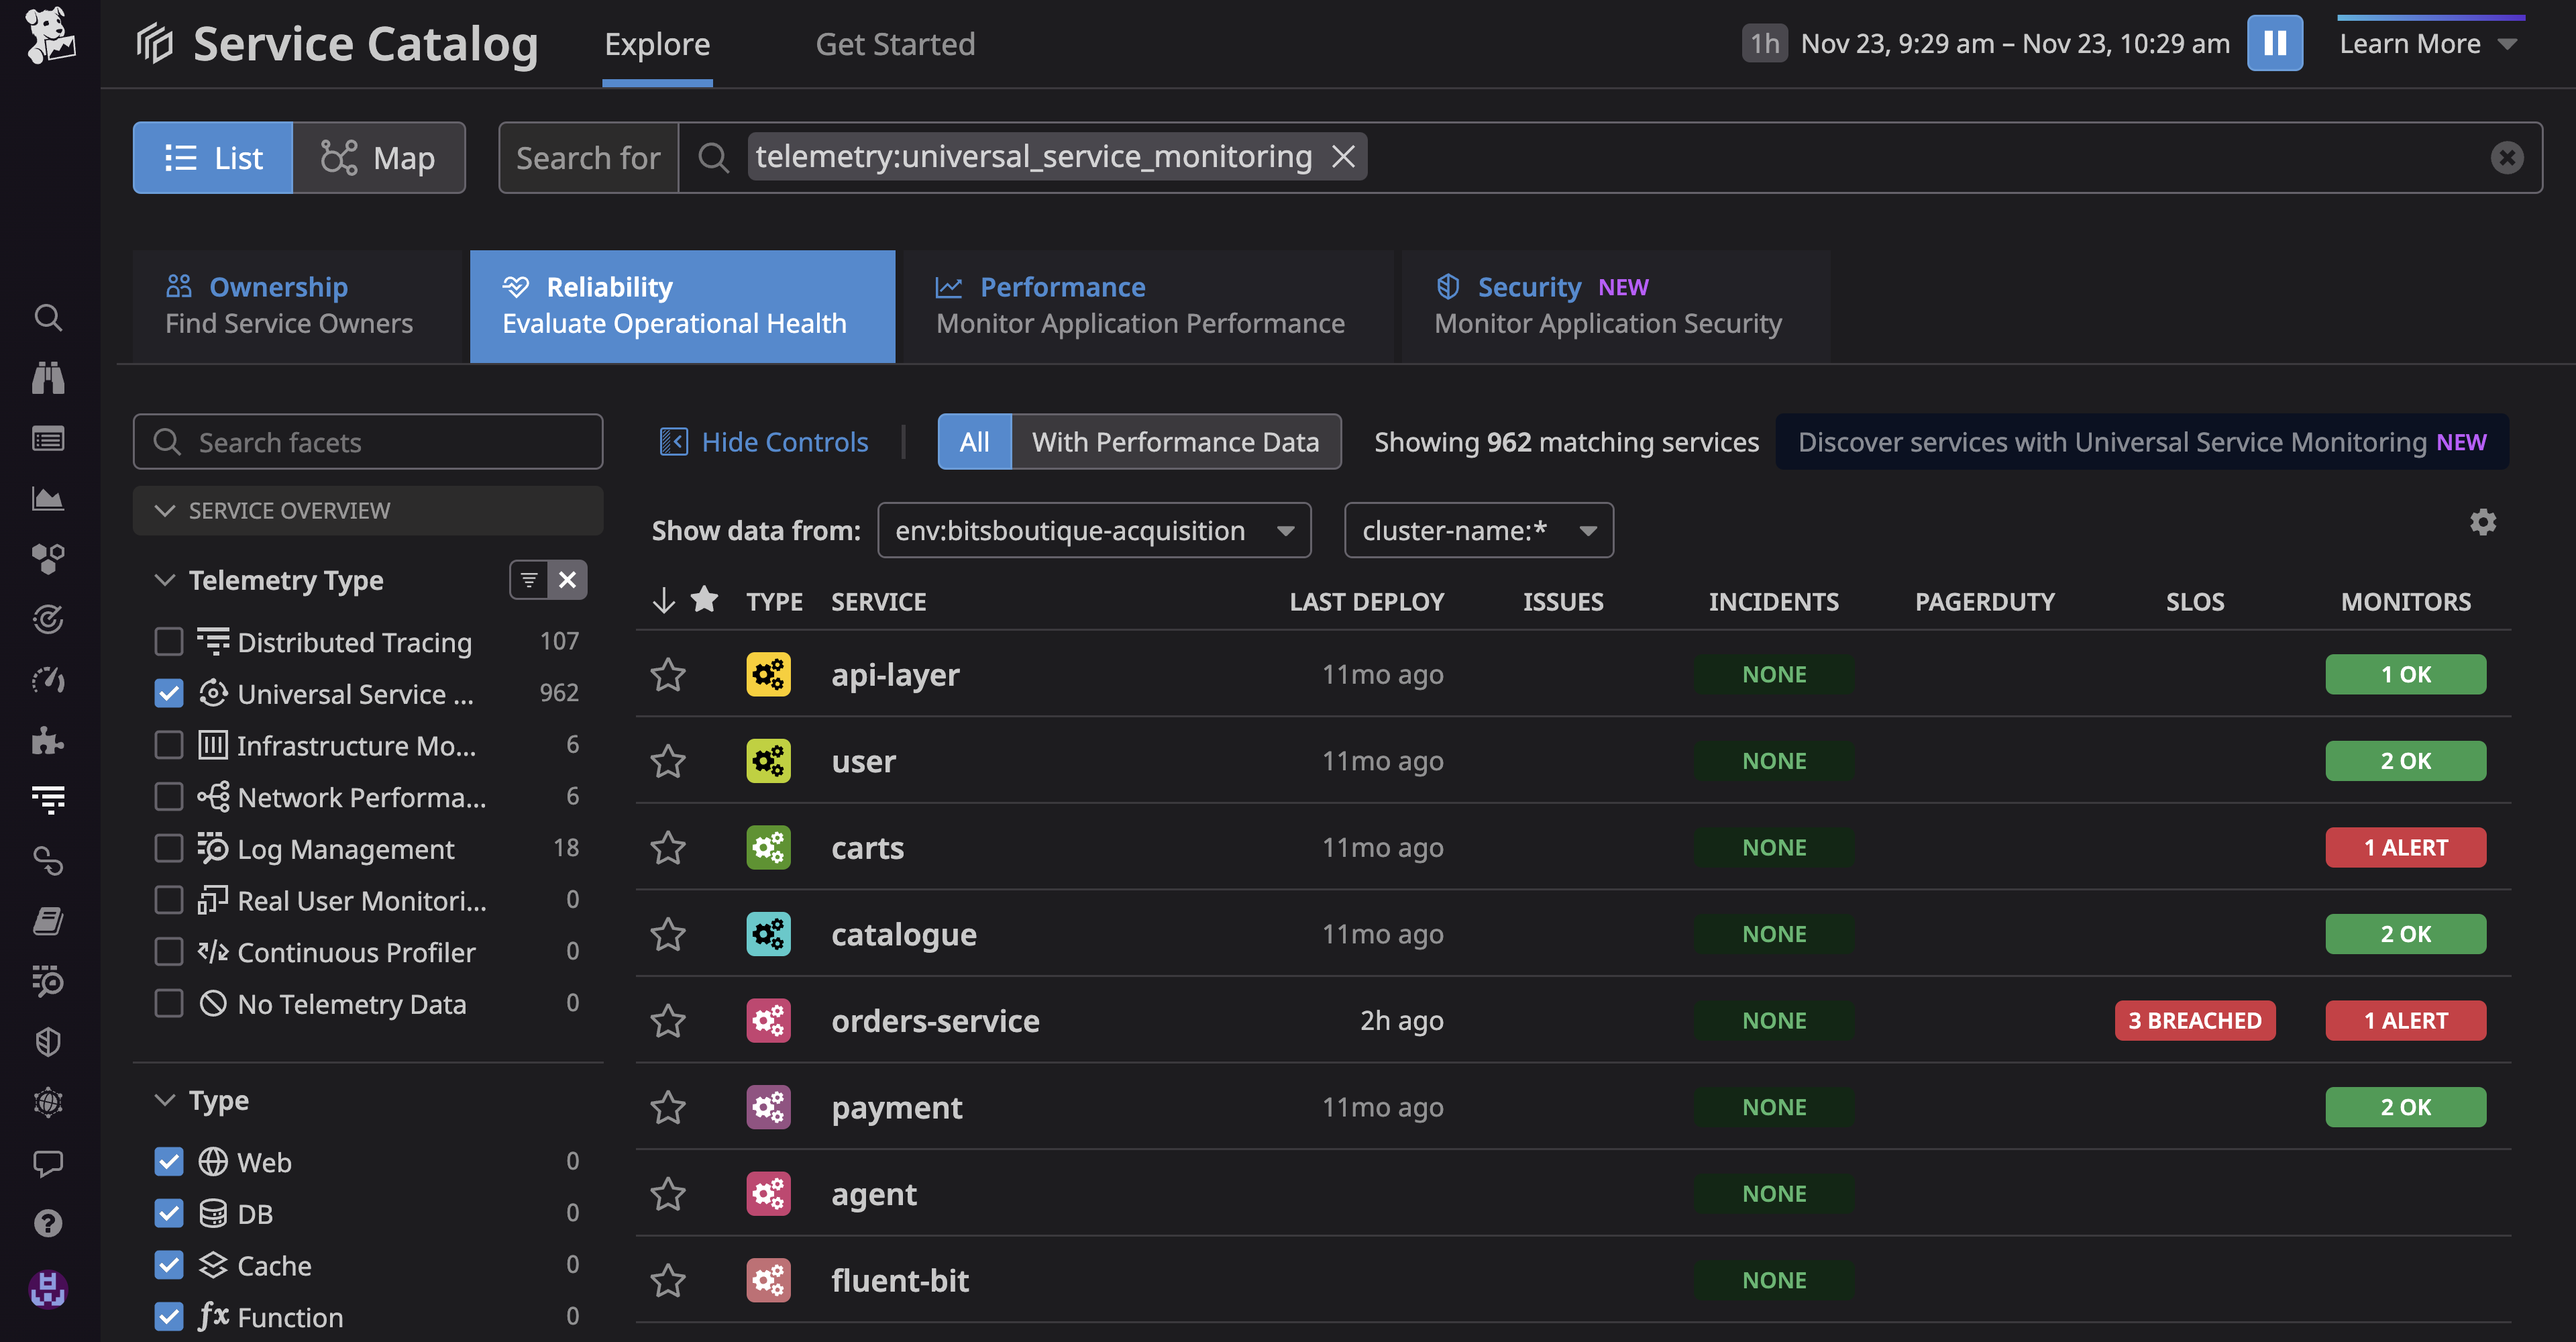
    Datadog, Inc. today made generally available a Universal Service Monitoring service that takes advantage of the extended Berkeley Packet Filtering (eBPF) microkernel in a Linux operating system to automatically detect all the services that make up an application environment without changes to the code used to construct them.

    Yrieix Garnier, vice president of product at Datadog, said as application environments continue to evolve IT teams are now trying to track not just individual microservices but also entire business processes such as order-to-cash. Before those services can be instrumented, however, DevOps teams need a simple way to discover them, he noted.

    Within the Linux operating system, eBPF makes it possible to employ a sandbox environment to identify and map the services that make up an application environment, including both internally developed and third-party services regardless of what programming languages were used to build them, added Garnier.

    DevOps teams also gain visibility into the health of every service and deployment through real-time request rate, error and duration (RED) metrics and correlated infrastructure metrics and application logs. They can then expand monitoring capabilities provided via Datadog agent software to employ distributed traces that can be correlated with observability data.

    The Datadog Universal Service Monitoring service is also integrated with the Service Catalog that Datadog makes available to determine which development team created a specific service.

    The goal is to close a visibility gap that has emerged as more IT organizations align their management efforts around specific application services in the age of digital transformation rather than the components that make up a service, noted Garnier.

    DevOps teams today are simultaneously being tasked with diving deeper into application environments to discover issues before services are disrupted and also tracking the services that span multiple application components. Collectively, the expectation is that DevOps teams will be able to ensure that application services are not just available but also consistently delivered. Ultimately, IT organizations are being tasked with removing much of the guesswork that has historically characterized the management of IT.

    Less clear is how much those shifts will ultimately drive the reorganization of IT teams that are still mostly organized around the platforms they support versus the services being delivered. However, as business leaders increasingly appreciate how dependent the overall organization is on application services, the need to manage them in a more comprehensive manner becomes apparent.

    In the meantime, DevOps teams are evaluating whether their existing tools and platforms enable them to accomplish that goal. Datadog is making a case for employing a service it manages on behalf of DevOps teams versus each DevOps team having to construct and maintain its own observability platform. Datadog, most recently, extended the reach of its namesake cloud-delivered monitoring and observability platform to address continuous testing, application security and cost management.

    It will be up to each organization to decide how best to achieve their observability goals. One thing that is certain is the current level of visibility they have into application environments is not nearly sufficient.

  • Datadog Extends Reach of Integrated DevOps Platform

    Datadog Extends Reach of Integrated DevOps Platform

    At its Dash 2022 conference, Datadog announced today it is extending the reach of its namesake cloud-delivered monitoring and observability platform to address continuous testing, application security and cost management.

    In addition, Datadog has made available in beta a Data Streams Monitoring tool that makes it simpler to identify upstream issues that are likely to impact DevOps workflows. Also in beta is a Dynamic Instrumentation tool that makes it possible to employ Datadog agent software to collect data on the fly from specific source code to investigate performance issues. Datadog is also making available in beta a Resource Catalog to make it easier to navigate cloud resources that IT teams are employing and has added a Datadog Workflows tool to create blueprints to for automating repeatable processes.

    Datadog is also expanding the reach of its Watchdog telemetry analysis service infused with machine learning algorithms to add beta support for containers. There is also now a beta of an Event Management tool that DevOps teams can employ to more easily investigate a stream of related alerts using the Watchdog service.

    The Datadog Continuous Testing service, now generally available, provides DevOps teams with a workbench for generating and maintaining tests that can be integrated within continuous integration (CI) workflows. Datadog has also added an Intelligent Test Runner tool, in beta, to enable DevOps teams to only run tests that need to run when a change is made by analyzing code execution paths to increase developer productivity.

    Renaud Boutet, senior vice president of product at Datadog, said the goal is to make it possible for DevOps teams to create and run tests from within the Datadog user interface in parallel using a set of no-code tools without having to employ scripts. The capability will make it possible to automatically generate tests using data collected by the Datadog platform as part of an infinite DevOps workflow loop, he added.

    At the same time, Datadog is making generally available a cloud security management service that combines its existing cloud security posture management (CSPM) service and the cloud workload security (CWS) service to provide an integrated cloud-native application platform (CNAP) at no additional cost. In addition, Datadog is making it possible to block access to application components that are under attack or might be attacked in real-time based on the known vulnerabilities detected using tools that are currently in beta.

    That approach reduces the total cost of cybersecurity by providing IT teams with a single service through which they can manage application security using a platform Datadog gained last year with the acquisition of Sqreen.

    Finally, Datadog is making generally available a cloud cost management tool that leverages its monitoring capabilities to enable organizations to automatically attribute spend to applications, services and individual teams. Changes to spending patterns that impact costs are surfaced alongside the same tools IT teams are already using to monitor their cloud computing environment. That unified visibility increases awareness of costs in a way that encourages DevOps teams to optimize the utilization of multiple classes of cloud resources.

    The services being added are extensions of a Datadog platform that employs a single set of agents it provides. The Datadog platform also supports the open source OpenTelemetry agent to deliver a wide range of services. That approach eliminates the need for IT teams to deploy multiple agents each time they add an additional monitoring, security, testing or cost management tool.

    Datadog has been making a case for an integrated platform that reduces the level of integration effort DevOps teams would otherwise need to expend when deploying separate point products to address monitoring, observability, security and cost management issues. That approach makes it easier for DevOps teams to collaborate and reduces the total cost of DevOps. In contrast, each time a DevOps teams adds a point product to address a specific issue, they need to deploy and maintain a separate set of agents.

    In the longer term, it’s not clear how problematic that agent issue will be once open source OpenTelemetry agent software is more widely employed. However, it may still be years before open source software provides the same capabilities that are available today using proprietary agent software.

    It may take some time before every application is as fully instrumented as it should be, but as monitoring and observability platforms continue to evolve, it is possible to more proactively manage application environments.

  • Transforming Observability

    Transforming Observability

    Walking into an unfamiliar operations center some time ago, I immediately noticed database error alerts racing down the primary monitor faster than a Matrix screensaver morphs letters. Strangely, no one seemed particularly excited about it. The situation was a head-turner for me, coming as I did from the “everything must balance” banking world.

    A senior ops tech quickly explained that airline reservation systems are highly optimized for speed and volume, sacrificing nearly everything else to meet peaks. “No worries; the agents just hit Enter again. Retry logic just slows us down,” they told me. The lesson here was removing constraints can profoundly change a system, much as Dr. Eliyahu Goldratt described in his game-changing Theory of Constraints.

    Today, cloud-native architecture, multi-cloud and hybrid cloud platforms, dynamic infrastructure-as-code (IaC), DevOps and our ability to store boundless amounts of data each change or remove constraints in their own way. Observability could be on this list, but I think observability’s transformation is still happening right in front of us.

    Observability and OpenTelemetry

    Through open source OpenTelemetry (OTel), highly competitive vendors collaborate to shift their offerings up the value chain by supplementing and replacing once highly-prized proprietary agents, interfaces and data specs. There’s no better example of removing a constraint than making these once proprietary agents with an open solution that will have profound effects across the industry.

    OTel is a thriving ecosystem of 11 tech companies participating on various boards and committees that also collaborates and integrates with open source projects such as Jaeger, Kubernetes, Prometheus and OpenMetrics. Over 20 observability companies natively support and provide OTel distributions. OTel continues to mature, reaching stability 1.0 release in 2021 and announcing its roadmap for metrics specifications in 2022.

    OTel-native support represents a significant commitment from vendors because it means rearchitecting products to distribute data via OpenTelemetry Protocol (OTLP) rather than using OTel SDKs and Collectors frontend internal interfaces. With SolarWinds’ October 2022 announcement, I suspect they will also join the ranks of companies supporting OTel natively in their commercial offerings. 

    Digital transformation, product and technology leaders see value in observability because of its potential to measure digital experiences and measure the performance of business and digital services. To do this requires observability to meet three significant challenges.

    First, observability must effectively cross the complex boundaries of microservices, containers, cloud and traditional applications, multiple cloud providers, database sources, SaaS services, infrastructure and internal and external APIs. Today’s challenge is far beyond the central aggregation of large volumes of log data and suppressing non-essential alerts. 

    Most enterprise architectures look eerily similar to a breadboard wiring project with applications, systems and data sources crisscrossing each other, representing the various pathways and interfaces across systems. Virtually any of these elements could contribute to the degradation of a digital experience, and observability must operate across these elements whether they live in our tightly controlled data centers or are distributed in microservices, cloud services or third-party interfaces.

    With this breadth and depth of visibility, we also need context to match and correlate what appears to be disconnected information and sources. Open source enthusiast Chris Engelbert describes this challenge well:

    “The data correlation, the knowledge of how the infrastructure and services are deployed, as well as the dependency tree of applications, services and (eventually) hardware, must be taken into account when providing hard evidence of what is going on in your system.”

    Following the Silver Thread

    With context and dependencies, observability can allow us to see what software developers call the “silver thread,” the ability to collect the components of systems involved in measuring an experience or triaging a performance issue. Then we can follow the pathway, or silver thread, across all the components, whatever or wherever they are, to find constraints or bottlenecks. For example, a particular API’s poor performance may be due to the location and traversal necessary to reach a needed data source rather than an issue in that API’s microservice or application.

    In summary, observability is invaluable to monitoring, operating and triaging modern applications and cloud infrastructure. The adoption and maturation of OpenTelemetry will deliver many benefits, including the removal (or, at least, greater transparency) of traditional boundary constraints. And with the context to understand and follow the silver thread, observability transforms beyond operations to measure digitally delivered business services and experiences.

  • New Relic Reports Major Spike in Volume of Log Data

    New Relic Reports Major Spike in Volume of Log Data

    New Relic today shared a report based on anonymized data it collects that showed a 35% increase in the volume of logging data collected by its observability platform.

    The report also identified logs generated by NGINX proxy software (38%) as being the most common type of log, followed by Syslog (25%) and Amazon Load Balancer (20%).

    In addition, Fluent Bit is the most commonly used open source processor and forwarder tool (38%) among IT teams that have adopted the New Relic platform. Another 16% are using New Relic infrastructure agent, followed by 14% that send log data directly to New Relic via an HTTP endpoint.

    The report also found 50% of all logs ingested by language agents come from Java applications, followed by .Net (26%), Ruby (22%) and Node.js (2%).

    Jemiah Sius, director of developer relations at New Relic, said as more cloud-native applications are deployed, the volume of log data that is collected is only going to increase as open source OpenTelemetry tools are more widely adopted. In addition, IT teams will also be collecting metrics, traces and events to better pinpoint the root cause of issues using observability platforms such as New Relic One, he added.

    Amazon Web Services (AWS) is now, of course, one of the biggest sources of log data. The New Relic report noted that the serverless AWS Lambda service is the most widely employed source of log data among AWS customers that employ the New Relic One platform. However, use of the AWS Firehose service for extracting, transforming and loading (ETL) data has grown sharply in the last year, noted Sius.

    The New Relic report found while only 32% of New Relic accounts that use AWS have adopted Firehose, there has been a 62% increase in adoption year-over-year.

    Log data is usually the first thing any IT team consults whenever there is an issue, but as the volume of log data increases it’s becoming more difficult to associate log data with specific IT events. The issue that each IT team will have to come to terms with is how much log data to store alongside metrics, traces and other data formats to help them proactively identify the root cause of an IT issue.

    Observability platforms, in the meantime, promise to make it possible to query that log data to identify relationships between events. The goal is to enable IT teams to investigate issues before they can disrupt IT services rather than merely reacting to events after they have unfolded, said Sius.

    The hope, of course, is that machine learning algorithms will soon automatically identify issues before most IT teams even know there is a problem. Given the overall complexity of modern IT environments, it’s unlikely most IT teams even know what queries to launch to identify the root cause of an issue. Instead, as machine learning algorithms become more familiar with what constitutes normal IT events, it will become simpler for those algorithms to surface the issues that are actually worth IT’s attention.

  • Driving Organizational Success With the 2022 State of DevOps Report

    Driving Organizational Success With the 2022 State of DevOps Report

    “Ship it!”

    We have just completed the research and analysis for the 2022 Accelerate State of DevOps Report (SODR) and oh boy, do we have some interesting things to share! First, let me take a short step back for those of you that may be new to the DevOps Research and Assessment (DORA) and our annual report, the SODR. DORA is an academically rigorous research program that seeks to answer the questions, “What practices enable teams to be high-performing software teams? And how do these practices impact organizational performance?”

    Since 2014, we have surveyed 33,000 practitioners around the world spanning all major industries. The project is intentionally–and staunchly–tool- and platform-agnostic. The research builds on itself, and each year we seek to both evaluate previous findings and expand in other directions or areas of research. This is important to note because many of the core findings, such as “software delivery performance drives organizational performance,” have been validated year after year. I would encourage you to go back and read all the reports from years past.

    Security

    This year, we doubled down on our 2021 research into software supply chain security by looking at the technical practices that improve software supply chain security and the non-technical practices that impact an organization’s ability to excel at securing their software supply chains. We leveraged two frameworks to focus our research: Supply Chain Levels for Software Artifacts (SLSA) and NIST’s Secure Software Development Framework (SSDF). Below is a summary of some of our key findings in this area:

    • Shifting left on security is a broadly adopted practice. Our research shows that two-thirds of respondents are actively pursuing software supply chain security by seamlessly baking security into the development process.
    • Culture is the primary driver of security practice adoption. One might expect that technology is the primary driver, but our research showed that a generative organizational culture (eg. performance-oriented, highly cooperative, shared risk) leads to healthier software practices.
    • Technical practices around CI/CD predict success in security. Companies that use source control, continuous integration (CI) and continuous delivery (CD) have more established SLSA practices. These practices shift security left to the developers and ensure consistent security scanning.
    • Cloud enables secure software practices. The five characteristics of cloud computing as defined by NIST enable the successful adoption of software supply chain security which, in turn, predicts greater organizational performance.

    Our research showed that companies who prioritize and excel at securing the software supply chain experienced fewer service outages, anticipate fewer security breaches and demonstrate high levels of both software delivery performance and organizational performance. The data showed that through the use of modern practices like continuous integration, teams can improve their security posture and even amplify the positive impact these security practices have on software delivery metrics (MTTR, deployment frequency, lead time-to-restore service) and overall organizational performance.

    Culture

    We saw above that the biggest predictor of an organization’s application development security practices was the presence of a generative organizational culture based on shared risk and information sharing. We also see that elements of these types of cultures lead to higher overall organizational performance, as well. Our research showed that high organizational performance can be achieved by fostering environments that are:

    • Supportive: Teams that felt supported and that they had buy-in from leadership (e.g., more financial support, more allocation of resources, sponsorships, etc.) were associated with high-performing organizations.
    • Stable: Teams that did not experience much change in membership over the last 12 months were more likely to be a part of high-performing organizations.
    • Flexible: Organizations with higher levels of working flexibility around where work was performed–remote, in-person or hybrid–were higher-performing overall.

    We also looked at burnout again this year and expanded the scope to understand which elements of culture contributed to lower levels of burnout. We found that generative culture, team stability and work flexibility all contributed to a reduction in burnout among employees.

    Reliability

    In previous years, our research told us that those that excelled in technical practices also excelled at organizational performance. This year, we have more nuanced data about this topic. This year, we saw that software delivery does not predict strong business outcomes unless these practices were paired with reliability. Think about it–will a customer be satisfied with new features if the service isn’t stable? What is the benefit of pushing code quickly into a fragile environment? Reliability is an essential component of driving organizational performance through software delivery performance.

    We also see that site reliability engineering’s (SRE’s) impact on organizational performance is non-linear; reliability engineering practices often do not result in additional reliability or organizational performance until a certain maturity is reached. It’s important for teams to know this and approach their SRE practice as an investment. It will likely not be sparkly ponies and unicorns initially as you build the reliability muscle but, as you advance, high performance and success are likely.

    Cloud

    Public cloud use is up a whopping 36% over 2021, whereas companies reporting no cloud usage at all are down by 50%. The use of hybrid cloud is up by 25%. Unsurprisingly, the use of cloud computing was associated with higher organizational performance. In past years we saw that it wasn’t “using cloud” per se that led to organizational performance, rather it was the achievement of the five essential characteristics of cloud computing–on-demand self-service, broad network access, resource pooling, rapid elasticity and measured service. This year, we saw that cloud computing enabled things like reliability, continuous delivery and improved supply chain security which drive organizational success.

    Over 50% of folks who took our survey reported that they leveraged multiple cloud providers. We asked respondents what benefits they realized from using multiple cloud providers. Here are the top three:

    1. Availability
    2. Leveraging the unique benefits of each provider
    3. Trust is spread across multiple providers

    Given the fact that reliability seemed to be the key to being a successful software delivery shop as well as a successful organization, it is not surprising to see availability listed by almost 63% of respondents as a benefit derived from using multiple clouds.

    Summary

    Our research continues to progress and we continue to dig deeper and deeper into the capabilities and practices that impact your business. We see broad adoption on the topics of security and reliability which are both heavily anchored in culture. Good culture leads to success. Period. There is no magic culture button and it takes work, but it is very achievable. Start by defining organization-wide or line-of-business-wide goals and then just start continuously improving. Don’t worry about creating a three-year plan for improvement; create a one-month plan and just get to work instead. At the end of that month, evaluate your learnings, refine your focus and get back to work. With a commitment to hard work and continuous improvement, your investments should start paying off and, as an added bonus, you’ll have a better culture.

    We hope you have enjoyed these juicy findings as much as we have and we encourage you to read the entire 2022 State of DevOps Report.

    Also, please join us at dora.community to continue the discussion about these findings and to share and discuss your experiences on your journey toward excellent software delivery and operations.

  • Latest DORA Report From Google Surfaces Raft of DevOps Challenges

    Latest DORA Report From Google Surfaces Raft of DevOps Challenges

    The annual Accelerate State of DevOps 2022 report published today by the DevOps Research and Assessment (DORA) team at Google found the percentage of high performers is at a four-year low, with the percentage of low performers rising dramatically from 7% in 2021 to 19% in 2022.

    Based on a survey of 1,350 DevOps professionals, the report evaluated organizations based on the five DORA metrics: Deployment frequency, lead time for changes, time to restore service, change failure rate and operational performance. The DORA team also identified clusters of DevOps teams ranging from “starters” to “flowing” based on their overall maturity. Only 17% of respondents achieved a ‘flow’ state defined by high reliability, high stability and high throughput characteristics.

    The DORA survey sample shifted this year to include more respondents that are earlier in their careers than in previous reports. However, Claire Peters, DORA research lead at Google, said that while there are a lot of factors that impact those metrics, the current hypothesis is that the COVID-19 pandemic has taken a toll on DevOps productivity as more DevOps professionals continue to work remotely.

    The report noted a marked shift in deployment targets requiring new skills, with 54% of respondents now working with container artifacts.

    Overall, the report finds software delivery performance is beneficial to organizational performance when operational performance is also high. The challenge is the number of organizations that have achieved high operational performance is relatively small. In fact, the report also noted that site reliability engineering (SRE) practices had a negative impact on software delivery performance until an organization achieved a high level of SRE maturity.

    The report also concluded that organizations that built software on and for the cloud tended to have 1.4 times higher organizational performance than those that didn’t. The percentage of respondents using public clouds is 76%, up from 56% in 2021, while the number of respondents not using a cloud stands at 10.5%. Usage of multiple public clouds is at 26%, while 35% reported using a private cloud.

    Less clear is the impact on DevOps teams of shifting application security left. The report suggested the biggest challenge organizations face when it comes to achieving application security have more to do with cultural issues than any technical shortcomings. The report notes that organizations that focus on accelerating software delivery without implementing meaningful DevSecOps best practices find themselves in a vicious counterproductive cycle that results in applications being successfully deployed in production environments less often.

    Peters noted that there is greater developer fatigue because organizations attempt to address security issues either just before an application is deployed or they remediate applications after they are deployed. Organizations that have low levels of security practices are 1.4 times more likely to experience developer burnout.

    The DORA team used both the supply-chain levels for secure artifacts (SLSA) framework defined by Google and the Secure Software Development Framework (SSDF) defined by the National Institute of Standards (NIST) to evaluate organizations. The most widely-adopted practice is application security scanning within a continuous integration/continuous delivery (CI/CD) system, with 63% of respondents reporting these tools are “very” or “completely” established. Preserving code history and using build scripts are also highly established, the report finds.

    In general, Peters said the report suggested the biggest predictor of application security success was whether an organization had a high-trust, low-blame culture focused on performance. Organizations that have these cultures tend to have higher organizational performance. Similarly, organizations with teams that felt supported through funding and leadership sponsorships tended to have higher organizational performance, the report noted. In addition, team stability and positive perceptions about one’s team also tended to lead to higher levels of organizational performance. Lastly, companies that offer flexible work arrangements tended to see higher levels of organizational performance.

    Each organization, as always, will implement DevOps best practices in ways that best fit its internal culture. However, the latest DORA report makes it clear that the more empowered a DevOps team is the more proficient they tend to become.