Tag: catchpoint

  • Internet Performance Monitoring Wins the Day

    Internet Performance Monitoring Wins the Day

    We’ve spent years refining our ability to monitor systems, applications and networks, yet businesses still struggle with performance issues. The problem isn’t a lack of data—it’s too much of it. IT, network and cloud operations organizations are overrun with massive amounts of monitoring, performance and telemetry data. So much so, we must move for dashboards and alerts to metrics and KPIs that tie directly to business impact metrics and customer experience KPIs.

    In my recent conversation with industry leader Mehdi Daoudi, CEO of Catchpoint, one thing is clear: Performance monitoring must evolve to account for the modern reality that connectivity across networks, the Internet, and Internet-based resources outside of IT operations have a profound effect on the performance of any application.

    Key Takeaways: Modern applications performance is intrinsically linked with the performance of Internet and Internet-based resources, making Internet Performance Monitoring vital to meeting business and customer expectations. By extending observability and monitoring beyond internal systems and networks, organizations are better equipped to reduce downtime, optimize the user experience, and ensure their digital service delivery truly wins the day.

    Moving Beyond Traditional Monitoring

    For decades, organizations held the mindset that more data will result in better insights. However, this often creates the opposite effect. As Mehdi Daoudi points out, companies end up drowning in a sea of metrics, trying to extract meaningful insights from overwhelming amounts of information. Instead of enabling faster issue resolution, this data overload slows teams down.

    Mehdi’s combined experience at DoubleClick, Google, and Reuters shaped his view that performance monitoring isn’t just about application performance—it has to extend beyond internal infrastructure to include the Internet. Internet Performance Monitoring (IPM) takes a more holistic approach by accounting for everything from third-party services to ISP networks, CDNs, DNS, and even cloud providers.

    Internet Performance – Beyond Uptime and MTTR

    It’s time to redefine what success looks beyond monitoring, uptime and mean-time-to-recover (MTTR). Today’s users have zero tolerance for a poor user experience. If an application or website takes too long to respond, it might as well be down. In many cases, it’s too easy to switch to an alternative mobile app, site or SaaS solution when the current choice doesn’t deliver.

    Mehdi’s philosophy behind Catchpoint of “monitor what matters from where it matters” aligns with today’s reality. Businesses must monitor the end-user experience, not just the backend infrastructure and application stack. Synthetic monitoring, coupled with real-user monitoring (RUM), provides a clearer picture of end users’ actual experience, helping teams optimize for speed and reliability.

    Beyond just user expectations, performance also directly affects business outcomes. Studies consistently show that faster websites and applications lead to better customer retention, higher conversion rates, and improved revenue. With so many third-party services and dependencies in today’s digital stacks, understanding and controlling performance holistically is more critical than ever.

    Catchpoint’s IPM service is designed to go beyond application monitoring, performance or uptime by actively testing performance across the entire delivery stack. This holistic approach helps businesses pinpoint problems often before they escalate into major customer and business disruptions.

    AI’s Role in Performance Intelligence

    Artificial intelligence (AI) is an essential tool in the modern IPM stack. AI-driven analytics help organizations cut through noise and focus on the signal, prioritize real issues, and automate response strategies. With platforms like Databricks and Snowflake enabling real-time data analysis, AI is making correlating performance insights with business outcomes easier.

    AI reduces alert fatigue that plagues IT and Ops teams. Teams can focus on solving meaningful problems faster and with greater precision. AI can also predict potential issues before they escalate, allowing companies to take preventative action rather than waiting for a crisis to unfold.

    The Future of Monitoring: A Business-Centric, Delivery Stack Focused

    The core takeaway from my discussion with Mehdi is that monitoring isn’t about technology—it’s about business and customers. Companies must align their performance monitoring strategies with their business goals.

    Organizations can adopt a proactive IPM approach and gain deeper visibility into the entire customer experience and digital stack. This ensures that not only are applications working as expected, but that third-party services, global internet conditions, and external integrations are all functioning optimally as well.

    This shift also means that business and technical leaders need to work more closely together. Performance monitoring must be part of the broader conversation about business growth and customer experience. Organizations that prioritize this alignment will be better positioned to compete in an increasingly digital-first world.

    How Internet Performance Monitoring Wins the Day

    Catchpoint’s vision for Internet Performance Monitoring is one promising way to ensure your performance monitoring wins the day. By extending monitoring beyond internal infrastructure to the entire internet ecosystem, companies gain the proactive insights they need to ensure seamless digital experiences, reduce downtime, and optimize performance where it matters most.

    For information about Catchpoint, visit the Catchpoint blog and their latest SRE Report.

    [This was a conversation packed with great insights, and if you haven’t already, be sure to check out the full interview on DevOps Dialogues.]

  • SRE Survey Reveals Major Technical and Cultural Challenges

    SRE Survey Reveals Major Technical and Cultural Challenges

    Catchpoint, in partnership with Blameless, today published an annual survey of 559 site reliability engineers (SREs) that found 59% of respondents didn’t view tool sprawl to be a major concern. Another 40% said tool sprawl is a moderate (33%) to serious problem (8%).

    More than half of respondents said they build as much as 30% of the tools they use themselves, with more than half (54%) noting their organization tracks three or more different types of telemetry data to drive observability. The top three types of telemetry data collected are infrastructure (62%), application (58%) and network monitoring (55%) and, on average, the survey suggested the median toil level of SREs dropped 5% year-over-year.

    Just under half of respondents (46%) also noted they saw no or low value from artificial intelligence for IT operations (AIOps) compared to 30% that have seen moderate to high value. Another 25% are still unsure.

    Finally, the survey concluded that organizations that have adopted a “just culture”—where organizations ensure that incident reporting is not met with punitive measures—are 500% more likely to be Elite performers in terms of the DevOps Research and Assessment (DORA) metrics defined by Google.

    Leo Vasilou, director of product marketing for Catchpoint, said that the survey results provided some insights into the challenges SREs face as they strike a balance between trying to achieve DevOps goals and the fact that hiring has become more constrained during an economic downturn.

    That stress, however, has less to do with managing toolchains than it does ensuring that applications driving critical business processes are consistently available, he noted.

    SREs have emerged as a distinct DevOps function in recent years, focused almost exclusively on programmatically managing the dependencies that exist between a wide range of applications and the underlying infrastructure upon which they depend. Optimizing applications in the cloud-native era has become more challenging because the number of dependencies that exist between the microservices that make up a modern distributed computing environment continues to exponentially increase. In many cases, applications are continually added to IT environments without a commensurate increase in the overall size of the SRE team.

    Regardless of the economic climate, hiring and retaining SREs remains a challenge given the demand for IT professionals with those skills. Of course, there is no formal SRE certificate that is widely recognized so who qualifies to be an SRE tends to vary from one organization to the next. The one thing that is generally agreed upon is that SRE automate a wide range of tasks that would otherwise require multiple IT administrators to perform. Glassdoor also reports that, on average, an SRE makes north of about $125,000, which ranks among the highest salary level within any IT organization.

    Each organization, depending on their geographic region, would need to determine how many IT administrators they could replace if they hired an SRE. That doesn’t mean IT administrators that rely on a wide range of graphical tools to manage IT tasks are going away any time soon, but as DevOps continues to evolve, the dynamics between SRE and IT administrators also will continue to evolve.

  • Catchpoint Enables Experimentation by Automating Web App Testing

    Catchpoint Enables Experimentation by Automating Web App Testing

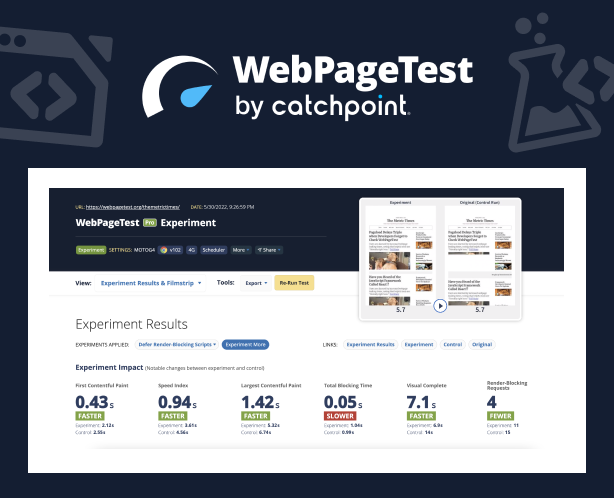
    Catchpoint this week expanded its open source WebPageTest performance testing suite of tools to enable IT teams to run instant tests that surface suggestions for improving overall web application and site performance.

    In addition, Catchpoint is now providing support for private tests, bulk tests and priority testing capabilities within the WebPageTest tool suite.

    Tim Kadlec, director of engineering for WebPageTest, said the goal is to make it easier for both developers and DevOps teams to experiment with how changes to applications and websites could improve performance using a capability that has now been added to the core suite.

    Identifying opportunities to improve performance typically requires tediously constructing manual tests over a period of weeks, noted Kadlec. Much of that effort is experimental in the sense that no one knows for sure if the tests being constructed will have a material impact on performance.

    The Opportunities and Experiments capability provides teams with a low-code tool for building tests based on a set of best practices that Catchpoint has defined. That approach makes it simpler to automatically generate and test tweaks that, for example, eliminate blocking scripts, optimize image rendering and minimize layout shifts. The result is optimization tests that show how their applications and websites could benefit from specific, actionable improvements without having to change any of the code that has already been deployed, said Kadlec.

    That’s a critical capability because it will encourage a level of experimentation that previously IT teams shied away from, simply because the amount of effort required to achieve an uncertain outcome was too high.

    It’s not precisely clear who is conducting these types of tests, as more responsibility for testing applications continues to shift left toward developers. The latest additions to WebPageTest make it easier for developers to conduct those tests without necessarily requiring help from a DevOps team, noted Kadlec.

    While there has always been a tremendous amount of focus on web application and site performance, the attention level has risen across organizations in the digital business transformation era. Many of the processes being implemented via web applications are extremely latency-sensitive. As more of those applications become routinely tested, the overall level of application performance should steadily improve.

    At the same time, the number of web applications and websites that most organizations are supporting also continues to expand. Most of those organizations are looking for ways to test applications without necessarily having to expand the size of the testing team or significantly increase the amount of time spent on testing.

    Regardless of the approach, it is apparent that testing is becoming more automated. The goal is not so much to eliminate the need for dedicated testing teams, but reduce the number of rote tasks that contribute to test avoidance in the interest of saving time. In theory, the more tests run—and the earlier they are run—the fewer issues that DevOps teams will need to deal with later.

  • Where Do SREs Go From Here?

    Where Do SREs Go From Here?

    Charlene O’Hanlon talks with Leo Vasiliou, director of product marketing at Catchpoint, about the results of a study the company fielded with VMWare Tanzu and DevOps Institute of nearly 300 site reliability engineers (SREs). This year’s report underscores the challenges of multi-cloud, calls out the underutilization of AIOps and shows a systemic shift in core baselining data. The video is below, followed by a transcript of the conversation.

    Announcer: This is Digital Anarchist.

    Charlene O’Hanlon: Hey, everybody. Welcome back to TechStrong TV. I’m Charlene O’Hanlon, and I’m here now with Leo Vasiliou who is the Director of Product Marketing over at Catchpoint. Leo, thanks so much for joining me today. Really appreciate it.

    Leo Vasiliou: Oh, of course, Charlene. Thank you very much for allowing us to have the conversation today.

    O’Hanlon: Absolutely, absolutely. I want to talk to you about a recent survey study that you guys put out in conjunction with VMware Tanzu and DevOps Institute. What were you guys looking at?

    Vasiliou: Well, from an existential perspective, we hope that the survey that we do leads into the annual report and we’d like for it to be the most data-backed set of insights in its community. There are sort of three underlying constructional essences of the report. One is to provide a core baselining data for the key SRE tenants. So DevOps, who had an amount of time, would call in reported levels of toil. The other essence is to look at what’s trending. And then the third one will generally be around the IT to business relationship. And then with each one of those constructional essences, the context and line items within each section will change from year to year.

    O’Hanlon: Gotcha. Alright. So this one focuses on site reliability engineering and what they’re seeing and what they’re dealing with on kind of a daily basis. Is that right?

    Vasiliou: Yes, yes.

    O’Hanlon: Okay. Alright, great. So tell me a little bit about some of the findings in the study. I know you guys do these, as you just said, reports yearly. So I’m interested in knowing what’s changed from year to year and what really surprised you in this year’s report.

    Vasiliou: Well, I like to say SREs are double struck with challenges because the SRE is essentially two jobs in one, right? They have to increase the efficiency of their operational activities while mitigating the risk of their transformational activities. So one of the key findings this year, which by the way this may be the most provocative dataset we’ve published just because some of the findings conflict with some popular theories in the market, but take the first one just as an example of that, is as part of the baselining set of data there was a self-reported drop in toil, which is the word they use to define repeated, mundane, busywork that doesn’t have any inherent value, of 15 percent. And one of the reasons this is such an insightful nugget to lead us into our various conspiracy theories is it was across the entire distribution of data, across all of their percentiles, as well as across all of the geographies that we looked at.

    O’Hanlon: Wow.

    Vasiliou: And so for me, when I had the blessed opportunity to do the research and sit down and co-write the report, having been stuck in the house for, let’s just call it a year and a half at this point, there was just something different about working on a piece like this and it just felt a bit more meaningful. And the conspiracy theory there or the hypothesis is that if people return to work, or return to the office I should say or some type of hybrid environment, will those reported levels of toil increase again next year as people adjust to the hustle and bustle of commutes just adding to frustration in how they think about things?

    O’Hanlon: That is a really, really fascinating thought process there. We could do an entire conversation about just that and whether what happens this year is going to be indicative of what happens in the future or if this year is going to be like a reset year. So from an SRE perspective though, the fact that the level of toil decreased 15 percent, that seems pretty significant. If you look at the entire spectrum of what they have to deal with on a daily basis, 15 percent, good lord, that’s huge in the SRE space.

    Vasiliou: Yeah. It is huge. I agree. It’s also based on the response of hundreds of survey participants year over year. And what’s interesting, Charlene, is one of the unique tactics we took in this year’s report is before we publish the reports and post survey pre report, we actually showed the results to various industry, let’s just call them, leaders. One of them we shared this particular section to had an alternative theory on why levels of toil dropped, and it had to do essentially with the fact that if people are not in the office, maybe does the very act of them not being observed compel them to do less busywork.

    So there was an alternative theory. But bringing us back to and leading into one of the other essences of the report, which is kind of the trends piece, it had to do with the amount of monitoring data sources, like the volume, variety, velocity of data, and the number of multi same-service platforms, e.g. multi CDN, multi DNS, et cetera, in use. And so will the return to work and the promise of AI ops help them keep toil levels low? Which leads us into the next sort of surprising finding, which is that SREs and their implementation or shift to AI ops is quite slow to maybe what we might be reading about in the industry, which was probably the second most provocative finding in the report.

    O’Hanlon: Yeah. So why do you think it is so slow then? Were there any trends that kind of came out of that? Any reasons why organizations are kind of slow to adopt AI ops?

    Vasiliou: Well, there is obviously a deluge of information and rhetoric in the market on the internet today. We need to seriously consider this idea of an information diet, which is a concept I first heard about a couple years ago. When we think about the idea of the hype cycle versus the challenges SREs face on a day-to-day basis, sometimes the market and the promise of what these types of solutions will offer might outpace actual implementation capabilities from, hey, we’re an SRE, let’s go implement this. I think part of the challenge here is probably the concept of AI ops is too broad and too large for consumption. It’s the idea of just saying, “Hey, let’s go solve world hunger or, hey, let’s go solve or implement AI ops,” right?

    O’Hanlon: Right, right.

    Vasiliou: You’ve got to break it down into smaller components and incrementally develop capabilities from there. Otherwise, how the heck are you going to baseline your progress for when you’re done? I think it’s too big, too broad, and some of the vendor promises may be of self-healing, auto remediation, maybe they were a little more on the hype side, where some of the other AI ops of components like root cause analysis or even correlation, maybe those are truthfully more on the hope and promise side.

    O’Hanlon: Okay. Do you think that AI ops – to your point, it is broad – do you think it just means different things to different people and so somebody actually may be implementing some type of AI ops and actually not realizing it?

    Vasiliou: The short answer is yes. So when we asked the question what monitoring tools or practices are used today, they were presented with seven options, ranging from application, infrastructure, experience monitoring, AI ops, and it was the fifth lowest, meaning that almost 40 percent of respondents said they’d never used it in the first place. The second question we asked is very simply what is the received value from AI ops, where one was the low value, nine was the high, and the range evenly spanned the value scale that was presented in the survey. What was interesting is there were a subset of people who said they never used AI ops but that they still received value, which was an additional dimension we didn’t think about when writing the survey.

    But it kind of brings me back to the essence of your question, which is are you user versus a consumer? And then go back to the previous comments about how big and broad this quote/unquote AI ops idea is, and there’s absolutely a propensity that people hear and think completely different things, unfortunately.

    O’Hanlon: Interesting. Interesting. So one of the things that we’ve been talking about in the SRE space over the last couple years is really how the role is kind of morphing and changing along with the market in general and to address a lot of organizational needs as well. Are there any findings from this year’s study that kind of bear out how an SRE role is changing and even if it is changing?

    Vasiliou: That will go back to what we were saying just a moment ago about mitigating the risk of their transformational activities. When you were asking the question, I’ll just cite the stat from our very first SRE report. We said that 85 percent of respondents said that in order to be successful in this role you have to commute into an office. So that got topsy-turvy turned upside down on its head.

    O’Hanlon: Right. Yeah. [Laughs]

    Vasiliou: But to get back to the essence of the question here, when we looked at the quantity of data sources and the prolific rise of the use of multiplatform providers, we sort of looked at this correlation between how SRE orgs are structured. Are you decentralized, are you centralized, or is there some type of hybrid in between? And then the decentralized piece was broken down even further by stack component, by platform component, or by business product or service. The vast majority of SREs said they are currently decentralized by business product or service, but I think the transformational piece here, which is something we’ll look at next year when we write the report, is because of the prolific rise of multiple third party and multiple same-service third party providers, there is a huge, gigantic spotlight to shift the primary dimension of org structure from product and service to a platform basis.

    And we talk about it like this. If you’ve got 10 different teams assigned to 10 different products or services and one member from each of those SRE teams developing capabilities that happen to be the exact same capabilities in development by those other nine teams, that’s the scalability and efficiency _____ that we start to lead in and talk about in this year’s report. So I think the transformational piece will be the assignment of SRE development engineering resources from product and service as a primary dimension to a platform – for example, cloud, CDN, DNS, API – as the primary dimension where those capabilities will be normalized and developed. Even though underlying platform structures will be different, those capabilities will then be offered as part of, let’s call it, an internal marketplace for use by multiple teams to kind of get away from that concept of silos and being segmented by product or service. So a bit of a long answer but all contextual to the key part there, which is the trend and the transformational piece that we wrote about this year.

     O’Hanlon: Right. Yeah, well it really is food for thought there if you consider how the SRE role was established and how it’s kind of – if you go down that path, how it seems to be changing and evolving as the more technology is adopted and more things are moved out to the edge and the need for SREs at basically all points on the network if you think about it. So great stuff there. Well, Leo, I know we could talk about all of the findings and have a much larger conversation, but unfortunately that’s all the time that we have for this one. But I do want to thank you very much for going through some of the survey findings. If folks are interested in taking a look at the study itself, is it readily available?

    Vasiliou: It is, it is. So it’s available at Catchpoint.com. Just head over to our learning and research section and enjoy the read. Charlene, one of the sentiments we wanted to leave readers with this year was this concept of baselining against Google’s definition of SRE, but we hereby declare by the power vested in us by absolutely nobody at all that you are hereby free to be an SRE.

    O’Hanlon: Oh, wow. Just one more thing to add to my plate. [Laughs] Well Leo, thanks again. I really do appreciate your time, and it’s a pleasure talking to you. I’m sure that we’ll talk again in the future about future studies that you guys have going on. So, thanks again. Really appreciate it.

    Vasiliou: You are quite welcome. Thank you for your time, Charlene.

    O’Hanlon: Alright, everybody. Please stick around. We’ve got lost more TechStrong TV coming up, so stay tuned.

    [End of Audio]

  • Catchpoint SRE Study Reveals a Global Drop in Toil, Warns of Looming Scalability Ceiling, and Highlights the Need for New Operational Capabilities

    New York, NY, June 15, 2021 — Catchpoint, the leader in Digital Experience Management, conducted a study with VMware Tanzu and DevOps Institute of nearly 300 site reliability engineers (SREs). The SRE Report is one of the most data-backed studies of its kind and has played a critical role in defining the nature of what it means to be a SRE since it launched four years ago. This year’s report underscores the challenges of multi-cloud, calls out the underutilization of AIOps, and shows a systemic shift in core baselining data. The report concludes by offering an actionable path for SREs to consistently deliver customer value.

    Download the report here.

    “SREs deal with a very broad set of challenges that span across transformational and operational activities,” says Mehdi Daoudi, CEO of Catchpoint. “This report arms them with the insights they need to help address these challenges – to balance the need for agility against the need for stability when building and operating massive, distributed, and reliable systems.”

    Levels of Toil Fall Around the World

    Toil is the work tied to a production service that tends to be manual, repetitive, automatable, and devoid of enduring value. Google suggests that SREs should do no more than doing 50% ops work (including toil) and 50% dev work. This year, the SRE Report notes an average year-over-year drop in toil of 15%.

    “The reason this is such an impactful insight is that the drop in toil was across all geographies,” says Tony Ferrelli, Vice President of Technical Operations at Catchpoint. “If this drop in toil was because work felt more meaningful since COVID-19 led to SREs working-from-home, then will reported toil levels rise next year as people return to the office or a hybrid work environment?”

    The Accelerating Use of Multiple Providers Warns of a Looming Scalability Ceiling

    If the cloud is your new datacenter, then third-party services like DNS and CDN are your new racks and cabinets. When combining the rising use of multiple same-service platforms (e.g., multi-cloud) with the increase in the volume, velocity, and variety of monitoring data, there is little wonder why lack of visibility across the stack (53%) was the most cited cloud-app monitoring challenge or why SREs continually refine service level objectives (50%). The survey responses give rise to the critical question, how can companies most effectively scale SRE implementations?

    “Spanning the gaps between the interfaces and the data that each provider offers increases the difficulty for SRE teams to automate across those multiple providers. These integrations are rarely simple except for the most superficial aspects. Effectively mapping disparate data models together may be the next frontier for SRE in a multi-vendor environment,” says Kurt Andersen, SRE Architect, Blameless.

    The Shift Toward AIOps Is Slow

    AIOps has been widely touted to reduce laborious ops work and to intelligently sift through the ever-increasing volumes of data that organizations are continually presented with. However, the report shows that many SREs have never used AIOps and their rating of its received value evenly spanned the 1-9 value scale.

    According to J. Bobby Dorlus, Staff SRE at Twitter, “Most SREs working at this scale are already leveraging machine learning, especially when it comes to efficiencies around data centers (locations, cooling, and all the things that happen inside it) for networks and building out infrastructure … Evolving that into AIOps is the next logical step.”

    Observability Should Include Digital Experience Metrics and Business KPIs

    SREs that fail to deliver customer value run the risk of being stuck in an operational toil rut. Conversely, businesses that fail to recognize the importance of SRE activities risk losing talented employees and their competitive edge.

    The highest-ranked driver for successful SRE implementations was incident resolution (60%), while expanding the business was fifth lowest (33%). These findings show that SREs are still inwardly focusing on IT operations versus outwardly focusing on the business results that deliver customer value. To close this IT-to-business gap, SRE teams must expand observability boundaries to include digital experience metrics and business KPIs.

    “The balancing work of innovation while providing operational excellence has forced many IT teams to put heavy emphasis on improving reliability and stability of services and applications,” says Eveline Oehrlich, Chief Research and Content Officer at the DevOps Institute. “What SREs now need to do is make sure the value of these reliable services and applications are understood by the customer.”

    RECOMMENDATIONS

    • Businesses and SREs need to establish a baselining program around core SRE tenets and business level metrics to know whether things are getting better or worse.
    • Platform Operations teams should be implemented to achieve higher levels of scale and efficiency. Platform Ops should develop normalized capabilities for SREs across the organization to draw on (even though underlying platforms will have different interfaces) and treat those capabilities as a product to sell and market to other teams within the business.
    • To achieve the promise of AIOps, SREs and managers must break down AIOps into smaller components and incrementally develop from there, in addition to investing in training in AI and ML for SRE teams.
    • It is crucial to find ways to bridge the gap between SRE and business goals. Start conversations around capabilities, for instance, versus focusing on low-level monitoring metrics and high-level business outcomes.

    Resources

    SRE Report

    Connect with Catchpoint

    Twitter: @Catchpoint

    LinkedIn: https://www.linkedin.com/company/catchpoint/

    About Catchpoint

    Catchpoint, the global leader in Digital Experience Monitoring (DEM), empowers business and IT leaders to protect and advance the experience of their customers and employees. In a digital economy, enabled by cloud, SaaS and IoT, applications and users are everywhere. Catchpoint offers the largest and most geographically distributed monitoring network in the industry – it’s the only DEM platform that can scale and support today’s customer and employee location diversity and application distribution. It helps enterprises proactively detect, identify and validate user and application reachability, availability, performance and reliability, across an increasingly complex digital delivery chain. Industry leaders like Google, L’Oréal, Verizon, Oracle, LinkedIn, Honeywell, and Priceline trust Catchpoint’s out-of-the box monitoring platform, to proactively detect, repair, and optimize customer and employee experiences. Learn more at www.catchpoint.com.

  • Catchpoint Announces Integration with Google Cloud, Provides User Visibility Across Applications

    To optimize global user experiences, amplify application observability and deliver positive digital business outcomes for global enterprises.

    (New York, USA) – May 6, 2021 – Catchpoint, the global leader in Digital Experience Monitoring (DEM), announces integration with Google Cloud.  This allows IT teams to gain user-centric visibility into the performance, availability, and health of applications and infrastructure running on Google Cloud. Catchpoint is also available on Google Cloud Marketplace enabling a simplified billing process.

    Catchpoint Integration with Google Cloud for comprehensive network performance visibility

    Google Cloud’s Network Intelligence Center offers real-time network performance visibility into packet loss and latency at a per-project level and correlates with all of Google’s performance to quickly troubleshoot network issues. What has been missing until today was visibility into what is happening between the user and the applications and services hosted on Google Cloud, as well as visibility into Google Cloud to various SaaS applications.

    “There has been a lack of single monitoring solutions that can collect and analyze telemetry on all aspects of application delivery,” said Mehdi Daoudi, CEO at Catchpoint. “This integration between Google Cloud and Catchpoint fixes that.”

    Gaining Visibility into the Digital Wilderness

    Catchpoint provides comprehensive visibility into what happens between the user and the cloud or the data center.  For most enterprises, this expanse is a highly complex, unpredictable, and virtually invisible digital wilderness. Catchpoint, leveraging more than 1,300 vantage points staged at strategic locations all around the globe, is able to rapidly spot and quantify problems as they occur, allowing enterprises to take action before users notice any issues.

    Adding Catchpoint’s unique global digital experience insights enabled by the largest global monitoring network in the world, to the existing visibility provided by Google Cloud’s partner ecosystem, eliminates the visibility gaps that have long plagued enterprises.  No other cloud platform has true Blackbox data as a part of their observability stack.

    With this integration, network observability and performance monitoring teams can instantly visualize Catchpoint data alongside Network Intelligence Center’s data and insights in the Google Cloud Monitoring platform. For extra flexibility, the Catchpoint data can also be visualized using Grafana, an open-source analytics and interactive visualization web application.

    “This is a perfect example of the whole being greater than the sum of the parts,” said Lakshmi Sharma, Director of Product Management, Google Cloud. “Organizations can now visualize Catchpoint data alongside Google’s real-time performance metrics offered by Network Intelligence Center in Google Cloud Monitoring, in order to fix issues before they impact users.”

    Integrations Benefits

    This integration eliminates visibility gaps and allows organizations to amplify application observability, which optimizes user experience and enables better management of digital business performance. Ultimately, this leads to better business outcomes.

    The integration is available immediately.

    Connect with Catchpoint

    Twitter: @Catchpoint

    LinkedIn: https://www.linkedin.com/company/catchpoint/

    About Catchpoint

    Catchpoint, the global leader in Digital Experience Monitoring (DEM), empowers business and IT leaders to protect and advance the experience of their customers and employees. In a digital economy, enabled by cloud, SaaS and IoT, applications and users are everywhere. Catchpoint offers the largest and most geographically distributed monitoring network in the industry – it’s the only DEM platform that can scale and support today’s customer and employee location diversity and application distribution. It helps enterprises proactively detect, identify and validate user and application reachability, availability, performance and reliability, across an increasingly complex digital delivery chain. Industry leaders like Google, L’Oréal, Verizon, Oracle, LinkedIn, Honeywell, and Priceline trust Catchpoint’s out-of-the box monitoring platform, to proactively detect, repair, and optimize customer and employee experiences. Learn more at www.catchpoint.com


  • Catchpoint Announces Native Support for Google’s Core Web Vitals

    Offering the most accurate, actionable and comprehensive metrics for digital experience management; improving user experience and search ranking

    (New York, USA) – April 27, 2021 – Catchpoint™, the leader in Digital Experience Monitoring (DEM), today announced full support of Google’s Core Web Vitals, giving companies actionable metrics for delivering the best possible user experience on the web. Combined with Catchpoint’s superior set of digital experience metrics and expansive monitoring vantage points, support for Core Web Vitals provides IT teams with the most accurate, simple and comprehensive metrics for optimizing web performance and subsequently, search ranking.

    With this new addition and the existing Core Web Vitals support in WebPageTest, Catchpoint now offers the fullest suite of Core Web Vitals insights. The full gamut of stakeholders responsible for web performance, ranging from front-end developers to cloud architects, network engineers, SREs and IT operations practitioners, can leverage Catchpoint’s platform to deliver optimal website and web application performance, delight users and drive positive business outcomes.

    “Core Web Vitals will become increasingly important for anyone that is doing business over the web. Over the summer, the ‘signal’ produced by a website’s Core Web Vitals score will play a much bigger role in the Google search algorithm,” said Mehdi Daoudi, CEO of Catchpoint. “Teams can leverage a set of actionable metrics to deliver a better experience to their users while improving their business performance. It’s exciting to see that we finally have a set of metrics that will allow businesses to align IT and business performance.”

    Blog: Five Reasons to Use Catchpoint for Measuring Core Web Vitals

    Core Web Vitals are made up of three specific page speed and user interaction measurements: Largest Contentful Paint (LCP), First Input Delay (FID), and Cumulative Layout Shift (CLS). These metrics are a subset of factors that will be part of Google’s “page experience” score, an official Google search engine ranking factor, starting this year. This is critical for business visibility, web traffic, and, ultimately, sales.

    What makes these metrics easy and actionable is the measurement of time. LCP is the time from when users click on a link to when they see the main content on-screen. Many other page speed metrics don’t represent what it’s like for a user to open up a webpage. FID is the time it takes for a user to actually interact with your page. This is critical, as it takes into account how quickly webpages can begin to respond to users. CLS is the stability of a page as it loads. Users don’t have to re-learn where links are located when the page is fully loaded.

    In addition to displaying measured LCP, Total Blocking Time (TBT is the lab complement of FID), and CLS values, WebPageTest provides “Filmstrip View,” an animated preview of page loading with the option to highlight layout shifts.

    “The most important aspect of our web performance monitoring program is how fast our website or application is presented to our customers,” said Robin Schenck, QA and Release Manager at Blue Nile. “Catchpoint offers us the most comprehensive set of metrics for measuring that performance and taking immediate action.”

    The support for Core Web Vitals is included in Catchpoint’s Digital Experience Monitoring platform and it is available immediately.

    To see Catchpoint’s Core Web Vitals support in action, visit www.catchpoint.com and speak to a representative

    Connect with Catchpoint

    Twitter: @Catchpoint

    LinkedIn: https://www.linkedin.com/company/catchpoint/

    About Catchpoint

    Catchpoint, the global leader in Digital Experience Monitoring (DEM), empowers business and IT leaders to protect and advance the experience of their customers and employees. In a digital economy, enabled by cloud, SaaS and IoT, applications and users are everywhere. Catchpoint offers the largest and most geographically distributed monitoring network in the industry – it’s the only DEM platform that can scale and support today’s customer and employee location diversity and application distribution. It helps enterprises proactively detect, identify and validate user and application reachability, availability, performance and reliability, across an increasingly complex digital delivery chain. Industry leaders like Google, L’Oréal, Verizon, Oracle, LinkedIn, Honeywell, and Priceline trust Catchpoint’s out-of-the box monitoring platform, to proactively detect, repair, and optimize customer and employee experiences. Learn more at www.catchpoint.com