Tag: AWS

  • AWS Service Ready Helps Customers Find Products Validated to Run on Amazon Linux 2

    AWS Service Ready Helps Customers Find Products Validated to Run on Amazon Linux 2

    The Amazon Linux 2 Ready program, part of the AWS Service Ready Program, makes it easy for Amazon Web Services (AWS) customers to find solutions that follow AWS best practices for integrating with Amazon Linux 2.

    Amazon Linux 2 Ready Partners run quality assurance and security tests on their software, and provide support for their products on Amazon Linux 2.

    To read more about how these work, click the link below:

    https://aws.amazon.com/blogs/apn/aws-service-ready-helps-customers-find-products-validated-to-run-on-amazon-linux-2/


  • Level Up Your Serverless Applications with AWS Lambda Ready Partners

    Level Up Your Serverless Applications with AWS Lambda Ready Partners

    When Amazon Web Services (AWS) customers build with AWS Lambda, they need the right solutions to help them deploy, monitor, secure, and integrate their Lambda-based workloads.

    The AWS Lambda Ready Program, part of the AWS Service Ready Program, makes it easier for customers to find developer tools and integrations that are validated by AWS serverless experts to work with AWS Lambda.

    To learn more, click on the link below:

    https://aws.amazon.com/blogs/apn/level-up-your-serverless-applications-with-aws-lambda-ready-partners/


  • Identifying and resolving security code vulnerabilities using Snyk in AWS CI/CD Pipeline

    Identifying and resolving security code vulnerabilities using Snyk in AWS CI/CD Pipeline

    The majority of companies have embraced open-source software (OSS) at an accelerated rate even when building proprietary applications. Some of the obvious benefits for this shift include transparency, cost, flexibility, and a faster time to market. Snyk’s unique combination of developer-first tooling and best in class security depth enables businesses to easily build security into their continuous development process.

    Even for teams building proprietary code, use of open-source packages and libraries is a necessity. In reality, a developer’s own code is often a small core within the app, and the rest is open-source software. While relying on third-party elements has obvious benefits, it also presents numerous complexities. Inadvertently introducing vulnerabilities into your codebase through repositories that are maintained in a distributed fashion and with widely varying levels of security expertise can be common, and opens up applications to effective attacks downstream.

    To read more, click on the link below:

    https://aws.amazon.com/blogs/devops/identifying-and-resolving-vulnerabilities-in-your-code/


  • Instrumenting distributed systems for operational visibility

    Instrumenting distributed systems for operational visibility

    David Yanacek, a Senior Principal Engineer working on AWS Lambda, writes about using distributed systems for more operational visibility.

    When I joined Amazon after college, one of my first onboarding exercises was to get the amazon.com web server up and running on my developer desktop. I didn’t get it right on the first try, and I wasn’t sure what I did wrong. A helpful coworker suggested that I look at the logs to see what was wrong. To do so, he said that I should “cat the log file.” I was convinced they were playing some sort of prank on me or making a joke about cats that I didn’t understand. I only used Linux in college to compile, use source control, and use a text editor. So I didn’t know that “cat” is actually a command to print out a file to the terminal that I could feed into another program to look for patterns.

    My coworkers pointed me to tools like cat, grep, sed, and awk. Equipped with this new toolset, I dove into the amazon.com web server logs on my developer desktop. The web server application was already instrumented to emit all kinds of useful information into its logs. This allowed me to see what configuration I was missing that prevented the web server from starting up, that showed where it might have been crashing, or that indicated where it was failing to talk to a downstream service. The website is made up of a lot of moving pieces, and it was essentially a black box to me at the beginning. However, after diving headfirst into the system, I learned how to figure out how the server worked and how to interact with its dependencies just by looking at the output of the instrumentation.

    Download the full white paper here:

    [su_button url=”http://devops.staging.wpengine.com/wp-content/uploads/2020/07/instrumenting-distributed-systems-for-operational-visibility.pdf” target=”blank” background=”#ef2d3f”]Download Now[/su_button]

  • Going faster with continuous delivery

    Going faster with continuous delivery

    Mark Mansour, a senior manager of software development at Amazon Web Services, writes about continuous delivery at AWS.

    Over 10 years ago, we undertook a project at Amazon to understand how quickly our teams were turning ideas into high-quality production systems. This led us to measure our software throughput so that we could improve the speed of our execution. We discovered that it was taking, on average, 16 days from code check-in to production. At Amazon, teams started with an idea, and then typically took a day and a half to write code to bring the idea to life. We spent less than an hour to build and deploy the new code. The remainder of the time, almost 14 days, we spent waiting for team members to start a build, to perform deployments, and run tests. At the end of the project, we recommended automating our post check-in processes to improve our speed of execution. The goal was to eliminate delays while maintaining or even improving quality.

    Amazon had already built software development tools to make our software engineers more productive. We created our own centralized and hosted build system, Brazil, that executes a series of commands on a server with the goal of generating an artifact that could be deployed. At this point Brazil didn’t listen to source code changes. A person had to initiate a build. We also had our own deployment system, Apollo, which required a build artifact to be uploaded to it as part of initiating a deployment. Inspired by the interest in continuous delivery occurring in the industry, we built our own system, Pipelines, to automate the software delivery process between Brazil and Apollo.

    Read the full white paper here:

    [su_button url=”http://devops.staging.wpengine.com/wp-content/uploads/2020/07/going-faster-with-continuous-delivery.pdf” target=”blank” background=”#ef2d3f”]Download Now[/su_button]

  • Amazon EventBridge: Integrating with PagerDuty

    Amazon EventBridge: Integrating with PagerDuty

    In this video, we will demonstrate how to integrate PagerDuty with Amazon EventBridge to take customized automated action on incident tickets. Learn how to extend the functionality of this popular SaaS provider, using minimal code to process events in near-real time.

    [su_youtube url=”https://www.youtube.com/watch?v=KAlSXOjsRg8″]

  • New Relic Infrastructure and Application Monitoring

    New Relic Infrastructure and Application Monitoring

    Learn how New Relic can simplify the migration process and support your modernization projects while simultaneously saving you millions of dollars.

    [su_youtube url=”https://www.youtube.com/watch?v=aU6A-45c7Vs&t=31s”]

  • Building Secure Applications with AWS Developer Tools and Snyk

    Building Secure Applications with AWS Developer Tools and Snyk

    Learn how to use AWS Developer Tools and Synk to build secure applications for yourself and your business through this video by Jay Yeras, a Partners Solution Architect at AWS, and Jeff McLean, a software engineer at Synk. This talk gives you a deep-dive into their explanation on how these tools work and they even show you how best to utilize these tools.

    To watch the full video, click the link below:

  • DevOps Deeper Dive: Google Roils Open Source Community

    DevOps Deeper Dive: Google Roils Open Source Community

    Google this week agitated the bulk of the open source community by launching the Open Usage Commons consortium to protect the trademarks of open source projects, starting with the Istio, Angular and Gerrit projects it launched.

    Launched in collaboration with SADA Systems and some independent contributors, the stated goal of the Open Usage Commons is to help open source projects assert and manage their project identity through programs specific to trademark management and conformance testing.

    Istio is a service mesh that runs on top of Kubernetes, while Angular is a web application framework. Gerrit is a code collaboration tool.

    Unlike previous open source projects that Google played a major role in developing such as Kubernetes, Google has yet to contribute these three projects to an open source consortium. That decision has members of the open source community now questioning Google’s commitment to open source software.

    In fact, IBM, which launched the Istio project in collaboration with Google, this week said the Open Usage Commons does not meet the level of open source governance IBM expects. Originally, IBM said the expectation was that Istio would be contributed to the CNCF once it achieved a level of maturity. That contribution would include Istio intellectual property and the trademark. Now IBM is encouraging Google to reconsider its Open Usage Commons approach.

    If Google continues to hold on to the intellectual property rights for open source projects such as Istio, those projects will become little more than a community project that Google exercises control over, said Priyanka Sharma, general manager of the Cloud Native Computing Foundation (CNCF), which oversees the ongoing development of Kubernetes, among other open source projects.

    “It’s not in the spirit of open source,” said Sharma. “I don’t think you can even call it open source.”

    Other open source initiatives will be hesitant to build on top of projects such as Istio if the intellectual property belongs to a single vendor, added Chip Childers, executive director of the Cloud Foundry Foundation (CFF). The trademark is never the main issue, he said.

    “The trademark is only part of the consideration,” said Childers.

    In the case of Istio, the decision to launch Open Usage Commons might also draw more attention to a Service Mesh Interface (SMI) project being advanced under the auspices of the CNCF. That interface promises to make it easier to rip and replace one service mesh for another.

    In the meantime, Google may be trying to maximize its investments in open source projects that until now have tended to benefit rivals more. In terms of consumption of cloud services based on Kubernetes, Google is a distant third at best to Amazon Web Services and Microsoft.

    In general, there are more open source projects than ever. However, some of the entities that launch those projects have complained that cloud service providers simply turn those projects into cloud services in a way that consumes most of the revenue opportunities any open source project might generate.

    Google now appears to be exacerbating those tensions further by trying to retain control over the open source project it leads, while selling services based on other open source software projects. It’s not clear to what degree this rift might drive a wedge between multiple open source factions. Google with this move may just drive more members of the open source community into the arms of AWS and Microsoft. However, for the moment at least, none of the projects covered by the Open Usage Commons trademarks are so critical that they could not be replaced by any one of several alternative projects that are truly open source.

  • AWS Brings Machine Learning to Code Optimization

    AWS Brings Machine Learning to Code Optimization

    Amazon Web Services (AWS) has made generally available a tool dubbed Amazon CodeGuru that employs machine learning algorithms to recommend ways to improve code quality and identify which lines of code are the most expensive to run on its cloud service.

    Peder Ulander, director of open source for AWS, said Amazon CodeGuru not only helps improve performance and resource utilization but also reduces the time and effort spent optimizing applications before and after they are deployed.

    Amazon CodeGuru is based on a set of AWS machine learning algorithms to identify best practices for deploying code. It creates a profile of the code deployed and then surfaces recommendations to improve performance and reduce costs by employing the most appropriate tier of the cloud service.

    That latter capability is critical because developers don’t always factor costs into deciding which tier of a cloud service to employ. Amazon CodeGuru enables IT teams to proactively optimize their cloud usage, noted Ulander.

    Amazon CodeGuru can pull code from either GitHub or CodeCommit repositories, with support for other repositories planned. It requires developers to insert agent software developed by AWS into their code. Once a pull request is made, Amazon CodeGuru automatically starts evaluating the code using trained artificial intelligence (AI) models developed using data gathered from thousands of different open source software projects by AWS and its parent company.

    Once the analysis is completed, Amazon CodeGuru will generate a graph showing such metrics as latency issues and CPU utilization rates, as well as human-readable recommendations to surface specific issues and remediations that include example code and links to relevant documentation for any line of code. Amazon CodeGuru can observe application runtimes and profile application code every five minutes.

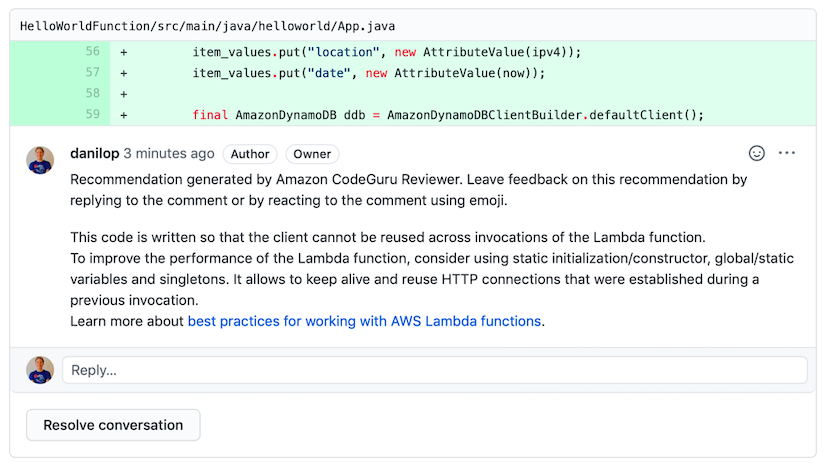
    Amazon CodeGuru has two core components. Amazon CodeGuru Reviewer automatically flags common issues that deviate from best practices and provides recommendations to fix them, including example code and links to relevant documentation. It then opens a pull request and automatically starts evaluating the code using machine learning models to identify the line of code, specific issue and recommended remediation, and provides access to a pull request dashboard that lists all the information gathered by all code reviews.

    IT teams can provide feedback on CodeGuru Reviewer recommendations by clicking on a thumbs up or thumbs down icon, which helps improve recommendations over time using machine learning.

    The second component is Amazon CodeGuru Profiler, which identifies the most expensive lines of code by analyzing the runtime behavior of their applications. Armed with those insights, IT teams can identify and remove code inefficiencies, improve performance and decrease compute costs.

    IT teams today spend an inordinate amount of time debugging code to address a broad range of issues. The paradox is the more applications they deploy, the more time they spend debugging. Perhaps the time has come to finally let machines discover code issues in the hopes that developers will use their time writing new code, not fixing it.