Tag: application performance management

  • Rethinking the APM Paradigm: A New Vision for Enterprise Application Monitoring

    Rethinking the APM Paradigm: A New Vision for Enterprise Application Monitoring

    Traditional APM systems today can’t measure up to tomorrow’s processes

    IT today is inordinately complex; continually pushing the boundaries and comprehension for even the most sophisticated minds. And while modern IT is unlocking new, innovative experiences and capabilities, the advent of cloud computing and its distributed, ephemeral nature has also made it extremely difficult for IT managers to keep apprised of their infrastructure stacks.

    This reality has taken shape so swiftly and with such a vengeance that Gartner estimates by 2021, enterprises will be able to monitor only 20 percent of their applications accurately. In a digital world, that is like a department head saying he or she knows what happens in only 20 percent of your factories or storefronts. Twenty percent, regardless of the industry or circumstance, is both unacceptable and a grave risk to business continuity and success.

    APM Helps, But Not Much

    Enterprises need to know what the other 80 percent is doing. Unfortunately, the traditional application performance management (APM) tools on which enterprises typically rely are no longer up to this task for three reasons.

    First, the modern application suite looks very different today than it did just a short time ago. The monolithic and custom ERPs, CRMs and other enterprise systems that were the hallmark of big businesses a decade ago are giving way to cloud-based, off-the-shelf, as-a-service solutions constantly updated with iterative DevOps and agile development techniques.

    Second, most traditional APM tools rely on embedded monitoring agents installed on the monitored system, or they need code-level insertions tactics to monitor. Either way, that type of burden is unsustainable at today’s enterprise scale and doesn’t work when applications are launched in containerized cloud environments. It also fails to account for the shift to more off-the-shelf or as-a-service solutions created without APM data outputs.

    Finally, the very infrastructure enterprise operates on looks nothing like it did even five years ago. Most enterprises have moved (or are in the process of moving) to cloud, multi-cloud, or at least hybrid infrastructure. The advent of cloud and the ephemeral nature of microservices and containers means that application topology looks very different at 8 a.m. when only early-bird employees are in the office, then it does at 10 a.m. when the remaining employees arrive. That unpredictability is a nightmare for APM tools, which, at best, now offer only a keyhole view of the entire IT enterprise; performance management now relies as much on the infrastructure as it does the application.

    So, What Needs to Change?

    Traditional APM tools are battleships in an asymmetric warfare age: highly specialized and designed for a single mission, but at the cost of the flexibility to adapt to modern environments as needed. We need carrier groups, not battleship armadas.

    The ideal APM solution for modern enterprises is an “agent-less” or “agent everywhere” approach. A modern solution must holistically consider how one application interacts with other applications. For instance, how does online ordering generate data and feed into warehouse processing tickets? And it must understand how those applications interact with the underlying infrastructure. For example, where are databases or applications stored and how reliable is that infrastructure?

    Current APM solutions miss the mark entirely, scratching only the most superficial layer of today’s technology stack when instead, they need to understand the relations from the deepest layers of infrastructure out to the end users’ experiences. Such an approach will allow enterprises to see into the other 80 percent of applications and deliver the insight and automation needed to drive robust and innovative digital experiences.

    However, knowing you need visibility and having it are two very different things. Fortunately, innovation within AIOps through agent and agentless technologies promises to deliver what conventional APM can no longer.

    By making visibility into application layers easier and deploying machine learning-enabled topological mapping between infrastructure and applications, AIOps is allowing for more detailed insights into the health of mission-critical business services than ever before. It allows enterprises to regain the visibility they’ve lost to an ephemeral world and be able to understand, organize and innovate with the agility they need to compete in today’s business environments.

    It is time to leave traditional APM behind and move forward into an AIOps enabled world. Neglecting to do so puts the business at ever-greater risk.

    — Erik Rudin

  • Google Unveils Suite of APM Tools

    Google Unveils Suite of APM Tools

    Google today announced that it is making available application performance management (APM) tools based on the same technology it employs to manage its internal IT environment.

    Morgan McLean, a product manager at Google, said Stackdriver APM is based the open source StackDriver Trace and Debugger tools Google originally developed for its DevOps teams.

    The APM offering, available in beta, also includes Stackdriver Profiler, a tool Google developed to enable DevOps teams to explore how their code is running in a production environment.

    Google also said it has integrated Stackdriver Debugger with GitHub Enterprise and GitLab to extend the number of repositories developers can use to create mirrors of their code.

    DevOps teams will have the option of deploying Google APM tools either on-premises or on a public cloud.

    McLean noted that rather than throwing additional compute resources at a performance issue, Stackdriver Profile enables DevOps teams to discover and remediate issues and ultimately reduce costs. To minimize the impact of Stackdriver Profile on the performance of a production application, Google opted to employ statistical methods to create a profile of a piece of code. Specifically, Stackdriver Profiler collects data via lightweight sampling-based instrumentation that runs across every instance an application. Data showing CPU time, wall time, RAM used and contention, for example, is then displayed on a flame chart.

    At the core of the Google APM toolkit is a the Stackdriver Trace software the company developed to collect latency data about applications deployed in a distributed computing environment. McLean said that in the age of microservices it’s not feasible to managed modern distributed applications without any ability to instrument them. For many IT organizations, however, the cost of acquiring APM software or employing a cloud service has forced them to limit their use of APM technologies to only their most critical applications.

    Google is trying to remove cost as significant APM factor, which ultimately will result in the applications deployed on the Google Cloud Platform (GCP) becoming more robust and reliable. The Google APM tools can be applied to applications running on virtual machines and containers, as well as the Google AppEngine, a framework Google exposes on its cloud service to enable the development and hosting of applications. In effect, Google is making it easier for organizations to consume open source tools that IT operations previously would have had to stitch together on their own.

    Reliance on APM tools is at the heart of any DevOps process. But DevOps processes are not universally employed, largely because in addition to acquiring new tools, organizations must evolve their processes and culture. The debate many of them have comes down to an argument over whether they need to buy tools before they change those processes or change their processes to justify buying the tools. Most often, it’s the initiative of handful of developers that force the issue. It’s only once that team is successful that senior managers start to think about replicating the DevOps process employed by that team across the rest of the organization. Via Stackdriver APM, Google is clearly hoping to accelerate the rate at which those transition to DevOps occur.

    — Mike Vizard

  • How APM Benefits DevOps

    How APM Benefits DevOps

    Thanks to the efforts of DevOps teams, rapid application and feature development are increasing the pace of innovation and having an increasing impact on business revenue. Top-performing DevOps teams are key contributors to year-over-year revenue growth of 25 percent or more, according to Enterprise Management Associates (EMA), thus increasing the value of IT. Application performance monitoring (APM), when used throughout the development life cycle, is a significant contributor to the success of these top-performing DevOps organizations.

    APM: Not Just for Production Anymore

    Frequent application changes, virtual environments, complex infrastructures, distributed data and cloud services are making production apps more difficult to support. We all know that it is cheaper to catch and fix bugs and performance problems earlier in the development process. Yet, 70 percent of organizations still use a collection of disconnected, manual troubleshooting processes, and they rank this manual troubleshooting as the single biggest bottleneck in their continuous delivery pipeline. According to EMA research, “APM solutions can substantially mitigate the challenges generated by high rates of production change.”

    Say, for example, a piece of code is running slowly during development or QA. The assumption that it’s the code’s fault triggers a rewriting process that doesn’t ultimately solve the problem, delays feature delivery and may introduce new issues. Details available from APM show that an underlying dependency, such as the Java Virtual Machine, is becoming saturated by a completely different process—details that are very difficult to correlate with silo-based tools and manual processes.

    There is a saying that you can’t manage what you don’t measure. While many organizations use APM to measure the performance of production environments, shifting application performance monitoring left into the development environment enhances application performance and stability. Using APM throughout the development life cycle helps teams track down elusive performance problems, enabling earlier debugging of performance bottlenecks, higher confidence of achieving production SLAs and enhanced insight into feature adoption.

    Earlier Debugging of Bottlenecks

    Using multiple, domain-specific performance monitoring tools ends up trapping critical information in different silos. Consequently, troubleshooting potential issues is very resource-intensive, requiring experts from multiple domains to analyze the outputs and correlate the results into something actionable. Developers are pulled into production troubleshooting more often, slowing the pace of innovation and delivery. Mean times to repair get longer and longer, impacting SLAs and overall user experience.

    Testing application performance during development, using the same tools that monitor the production application, helps identify bugs and bottlenecks when they are cheaper and easier to fix. Analytic features trace transactions from user to back-end, detecting potential load problems. Real-time, code-level diagnostics understand dependencies and watch all components, including containers and microservices, exposing code, SQL, networks, system resources and web services to detailed evaluations. Barriers between silos become transparent, improving communications and reducing time to resolution of issues that cross team or department boundaries.

    Higher Confidence of Achieving SLAs in Production

    Performing QA tests with unintegrated legacy tools is still a common practice in many organizations. These tools are often tied to physical concepts such as servers and networks, not the highly transient and virtualized production environment of clouds, services and VPNs. As a result, teams struggle to get a clear picture of potential issues under real-world conditions. Developers again get pulled into production troubleshooting, working to reconcile development and QA data and results with the production APM system.

    Including application performance monitoring during automated load testing gives DevOps a better prediction of code behavior in production. Performance analytics that cross all infrastructure components quickly validate the desired production SLAs. REST APIs make it faster and easier to collect and analyze APM data, thereby improving collaboration between teams during troubleshooting. Some APM tools can automate the correlation of logs to application activity, removing the need for manual correlation and speeding problem identification and resolution. Overall, instead of guessing at the relationship between testing and production performance, application performance monitoring provides better simulation of real-world conditions, improving confidence and reducing time to deployment.

    Enhanced Insight into Feature Adoption

    Deploying apps more often, with better performance and stability, only leads to enhanced digital experiences if customers like and use the new features. Users do not always behave as expected, even with thoroughly researched enhancements. Focusing on metrics such as availability and response time, while important, means missing out on useful information. Without understanding the details of end user adoption, IT is unable to quantify a new feature’s contribution to revenue, productivity, satisfaction and other valuable business objectives.

    Continuously monitoring user experience is essential to getting timely insights on usage trends, response times and overall user satisfaction. For instance, identifying high- and low-performing features or the most- and least-used capabilities enables better road map planning. For applications with a broad and global user base, segmenting by different groups or geographies can help pinpoint local problems (e.g., within a particular country or a subset of users), which helps DevOps teams fine-tune their apps in even the most distributed and challenging of environments. And by viewing detailed performance graphs of critical transactions, teams can quickly understand financial and productivity impacts, helping them prioritize open support tickets and application optimization efforts. Overall, user experience monitoring helps shift the DevOps team from a reactive to a proactive approach to ensuring performance.

    Managing the Digital Experience

    Customers and employees have high expectations of their digital experiences that must keep pace with their changing needs. DevOps practices help address these evolving customer expectations. But while frequent releases are great for the business, they are often hard on IT.

    To be successful, DevOps must strike a balance between velocity and stability. However, delivering the combination of innovation, performance, and availability is a significant challenge for IT. Puppet’s “2017 State of DevOps” report states that stability (mean time to recovery and change failure rates) varies significantly between top-performing and lower-performing organizations, and it is only getting worse. Increasingly complex environments, containers, microservices and other dynamic components are difficult to monitor with traditional performance monitoring techniques.

    The performance benefits enjoyed by the leading organizations are substantial. According to the Puppet report, these top-performing firms spend 22 percent less time on rework or unplanned work, deployments are 46 times more frequent, and mean times to repair 96 times faster. The inevitable result is faster innovation, better responsiveness to user issues and significantly higher customer satisfaction with the digital experience.

    Integrated application performance monitoring is an essential tool that enables collaboration across IT specialties, reducing or eliminating the finger pointing and other unproductive behaviors that show up all too often in organizations with operational silos. In addition, APM improves visibility across highly dynamic infrastructures, making it possible to quantify financial impact over time and across releases. Lastly, when issues do arise, APM can help rapidly troubleshoot complex issues in production, often before they negatively impact the business or user’s digital experience.

    Application performance monitoring in DevOps is the modern choice of innovative organizations that want to deliver the best digital experiences to their customers, without having to choose between speed and quality.

    — Steve Brar

  • CA Technologies Positions Automic at the DevOps Core

    CA Technologies Positions Automic at the DevOps Core

    After acquiring Automic earlier this year, CA Technologies suddenly found itself with an embarrassment of IT automation riches. Now the company is moving forward by further integrating the Automic IT automation platform with the rest of the portfolio of tools and services that it says are required to construct a software factory.

    Ron Gidron, technology evangelist for Automic, says the latest version of Automic increases the number of integrations with the rest of the CA Technologies portfolio to include support for CA Test Data Management, Service Virtualization, Privileged Access Governance, Application Performance Management and Veracode application security software, among others.

    CA Technologies has made it clear it intends to make the release automation software originally developed by Automic the foundation of its overall DevOps strategy. Most of that effort is now focused on integrating the various elements of the CA Technologies portfolio. Longer term, CA Technologies will eventually move to rationalize any duplication in functionality.

    Version 12.1 of Automic also brings forward orchestration tools and self-service capabilities to enable developers to provision resources within guidelines defined by IT. Gidron says that while there will always be a need for IT operations specialists, CA Technologies is making a concerted effort to “shift left” to provide developers with more programmatic control over the IT environment. To facilitate that process, Automic and the rest of CA Technologies have been investing in creating a standard set of external-facing REST APIs, which also will be used to make it easier for products and services created by the company to consume a wide variety of external data and metrics.

    Via acquisitions and internally developed software, CA Technologies is clearly trying to unify application, infrastructure and security management with the context of a single DevOps framework. The company doesn’t plan to force organization to consume that entire stack of software. But it will try to make acquiring as much of its portfolio as financially attractive and frictionless as possible to drive what the company describes as intelligent automation across a modern software factory. Driving that need is the realization that just about every company in every industry is now dependent on some form of custom software to drive one digital process or another.

    The rate at which CA Technologies has been expanding its DevOps portfolio via acquisition is a major contributor to what appears to be a wave of consolidation starting to occur across the DevOps category. Regardless of how advanced any organization might become in terms of building a software factory, major IT vendors realize that it’s only a matter of time before IT organizations start to pressure them to bundle more DevOps-related functionality together. In fact, the line between what’s DevOps today and tomorrow versus what was considered traditional IT management appears to be getting more blurred with each passing day.

    — Mike Vizard

  • New Relic Extends Monitoring Reach

    New Relic Extends Monitoring Reach

    New Relic this week at its Future Stack 2017 conference extended the reach of its monitoring services via the release of a software development kit (SDK) that makes it possible for IT teams to monitor custom applications.

    In addition, New Relic unveiled Health Map, which makes it much easier for IT administrators to correlate data collected from New Relic application and infrastructure monitoring services. Todd Etchieson, vice president of product management for New Relic, says developing Health Map was a natural next step after the expansion of its services into the realm of infrastructure monitoring. That capability should significantly reduce the finger-pointing that often occurs between developers and IT operations teams anytime there’s an application performance issue, says Etchieson.

    New Relic is also adding billing and cost management features that enable customers to monitor costs in real time as well as plan for future Amazon Web Services (AWS) resource requirements. Rather than having to invoke a separate tool, users can leverage New Relic’s extensive history of relying on AWS to host its tools.

    Application performance management (APM) tools from New Relic first gained prominence among developers who preferred to monitor their applications using a service. Because New Relic is deployed on AWS it’s especially well-suited to monitoring applications deployed on AWS. The company this week also announced that its monitoring tools now come with 20 pre-built integrations to AWS services including Amazon Kinesis Firehose, Amazon Elasticsearch Service, Amazon Route 53, Amazon EC2 Container Service and Amazon EC2 Container Registry.

    Now Etchieson says New Relic is expanding its reach in the enterprise as organizations embrace a more integrated approach to DevOps. In fact, he notes half of its customers are already consuming multiple services. Driving that adoption is a need to roll out more applications, many of which are based on microservices enabled by containers. This fact is forcing organizations to confront their DevOps issues because of the dynamic and ephemeral nature of containers. New Relic added support for container monitoring back in 2015.

    Etchieson says New Relic doesn’t necessarily care where IT organizations choose to deploy their applications. Because New Relic made its APM software available as a service, use of APM expanded considerably. The company currently has 1,700 enterprise customers, he says.

    Not all those customers are very far down the DevOps path, but more than a few organizations have begun their DevOps starting with an APM tool. In fact, in many organizations DevOps is a bottom-up transformation that begins with developers seeking more information about how their applications are performing.

    As DevOps continues to evolve, the divide between application and infrastructure performance monitoring tools will continue to narrow. There may be different roles inside an IT organization that require different views to address specific issues. But at its core DevOps is all about providing cross-functional IT organizations with the context needed to resolve issues faster. In almost every case, that will require correlating data across both the application and infrastructure stack.

    — Mike Vizard

  • The devopsy.kinsta.cloud Application Performance Management Leadership Links Guide

    The devopsy.kinsta.cloud Application Performance Management Leadership Links Guide

    Businesses today are largely defined by the applications they run. And to stay competitive enterprises must continuously update their software and performance issues must be identified and solved swiftly.

    This drive toward more rapid software iterations and enterprise development and IT management efficiency is one of the biggest reasons why more companies have embraced DevOps and continuous integration and deployment pipelines.

    But how do enterprises make certain they can continuously deploy and delivery new software apps and features and not inadvertently impact user experience? Precisely how are mistakes and failures, or app performance issues quickly identified and remedied? How are application issues managed so that there aren’t costly outages or development teams aren’t getting texts in the middle of the night for emergency software change requests? This is where application performance management (APM) comes in.

    According to the market research firm Markets and Markets, the APM Market is expected to reach nearly $5 billion by 2019, up from $2.72 billion in 2014.

    There is a significant intersection between DevOps and application performance management. It’s also essential for application management teams, development teams and operations teams, and needs to be integrated in many DevOps processes. In this devopsy.kinsta.cloud Survival Guide, we provide resources to help you to get the skinny on using application performance management to help more tightly integrate Dev and Ops, find the right APM tools and successfully manage today’s more complex environments with application performance management.

    APM Prepares Prep Sportswear for Promising Growth – devopsy.kinsta.cloud

    In this story, David Geer looks at how custom sportswear vendor Prep Sportswear is using APM to prepare for growth

    14 Tools That Raise Web and App Performance – devopsy.kinsta.cloud

    Asaf Yigal lists his 14 Tools That Raise Web and App Performance

    Gartner Evaluates APM Tools for DevOps – devopsy.kinsta.cloud

    Grab this Gartner report on APM toolsets.

    5 Ways APM Can Solve Your DevOps Worries – devopsy.kinsta.cloud

    To have tight control over Devop’s environments we need APM at every step, contends this post by IBM’s Payal Chakravarty. APM can help break down the Chinese wall between Dev and Ops and eliminate the finger pointing that happens during outages. Here he lists five APM best practices to enable a smooth DevOps working environment.

    Continuous Monitoring: The Role of DevOps and APM – devopsy.kinsta.cloud

    IBM’s Arun Biligiri discusses the intersection of DevOps and APM.

    APM On-Premises or SaaS: What’s the Best Fit? – devopsy.kinsta.cloud

    Which APM deployment option makes most sense for your organization? There‘s no simple answer to this question. A lot depends on your environment and requirements. This post explores the points to consider in deciding between SaaS and on-premises monitoring.

    Webinar: Using APM to Turbocharge Continuous Integration – devopsy.kinsta.cloud

    Check out this Webinar with CA Technologies and CloudBees to learn how APM can Turbocharge CI.

    Can Your DevOps and APM Initiatives Increase Customer Loyalty?

    Can APM help to increase customer loyalty, CA’s Peter Waterhouse thinks so.


    — George V. Hulme

  • Synthetic Monitoring: The Start of the Monitoring Journey

    Synthetic Monitoring: The Start of the Monitoring Journey

    Under pressure to innovate and deliver rapid updates to their applications, developers often place monitoring as an after-thought. In today’s world, where a slowdown can translate to customer attrition and an outage can lead to millions of dollars in losses and negative press, ensuring satisfactory response time has evolved to be one of the most critical needs in the early stages of development and is a common goal to ensure DevOps success.

    The Shift-Left of Monitoring: To study emerging patterns of how and when DevOps teams start monitoring, we interviewed several DevOps squads. Almost unanimously the responses were:

    1. They care most about knowing, Is the application up and loading quickly? Are all critical user interactions with the application responding within acceptable standards?
    2. They would like to get this information proactively throughout the development life cycle so they can determine if any code check-in impacted the performance/
    3. They would like to monitor with minimum setup and configuration and don’t have the time to learn complex tools/

    To satisfy these needs, synthetic monitoring becomes the starting point for monitoring.

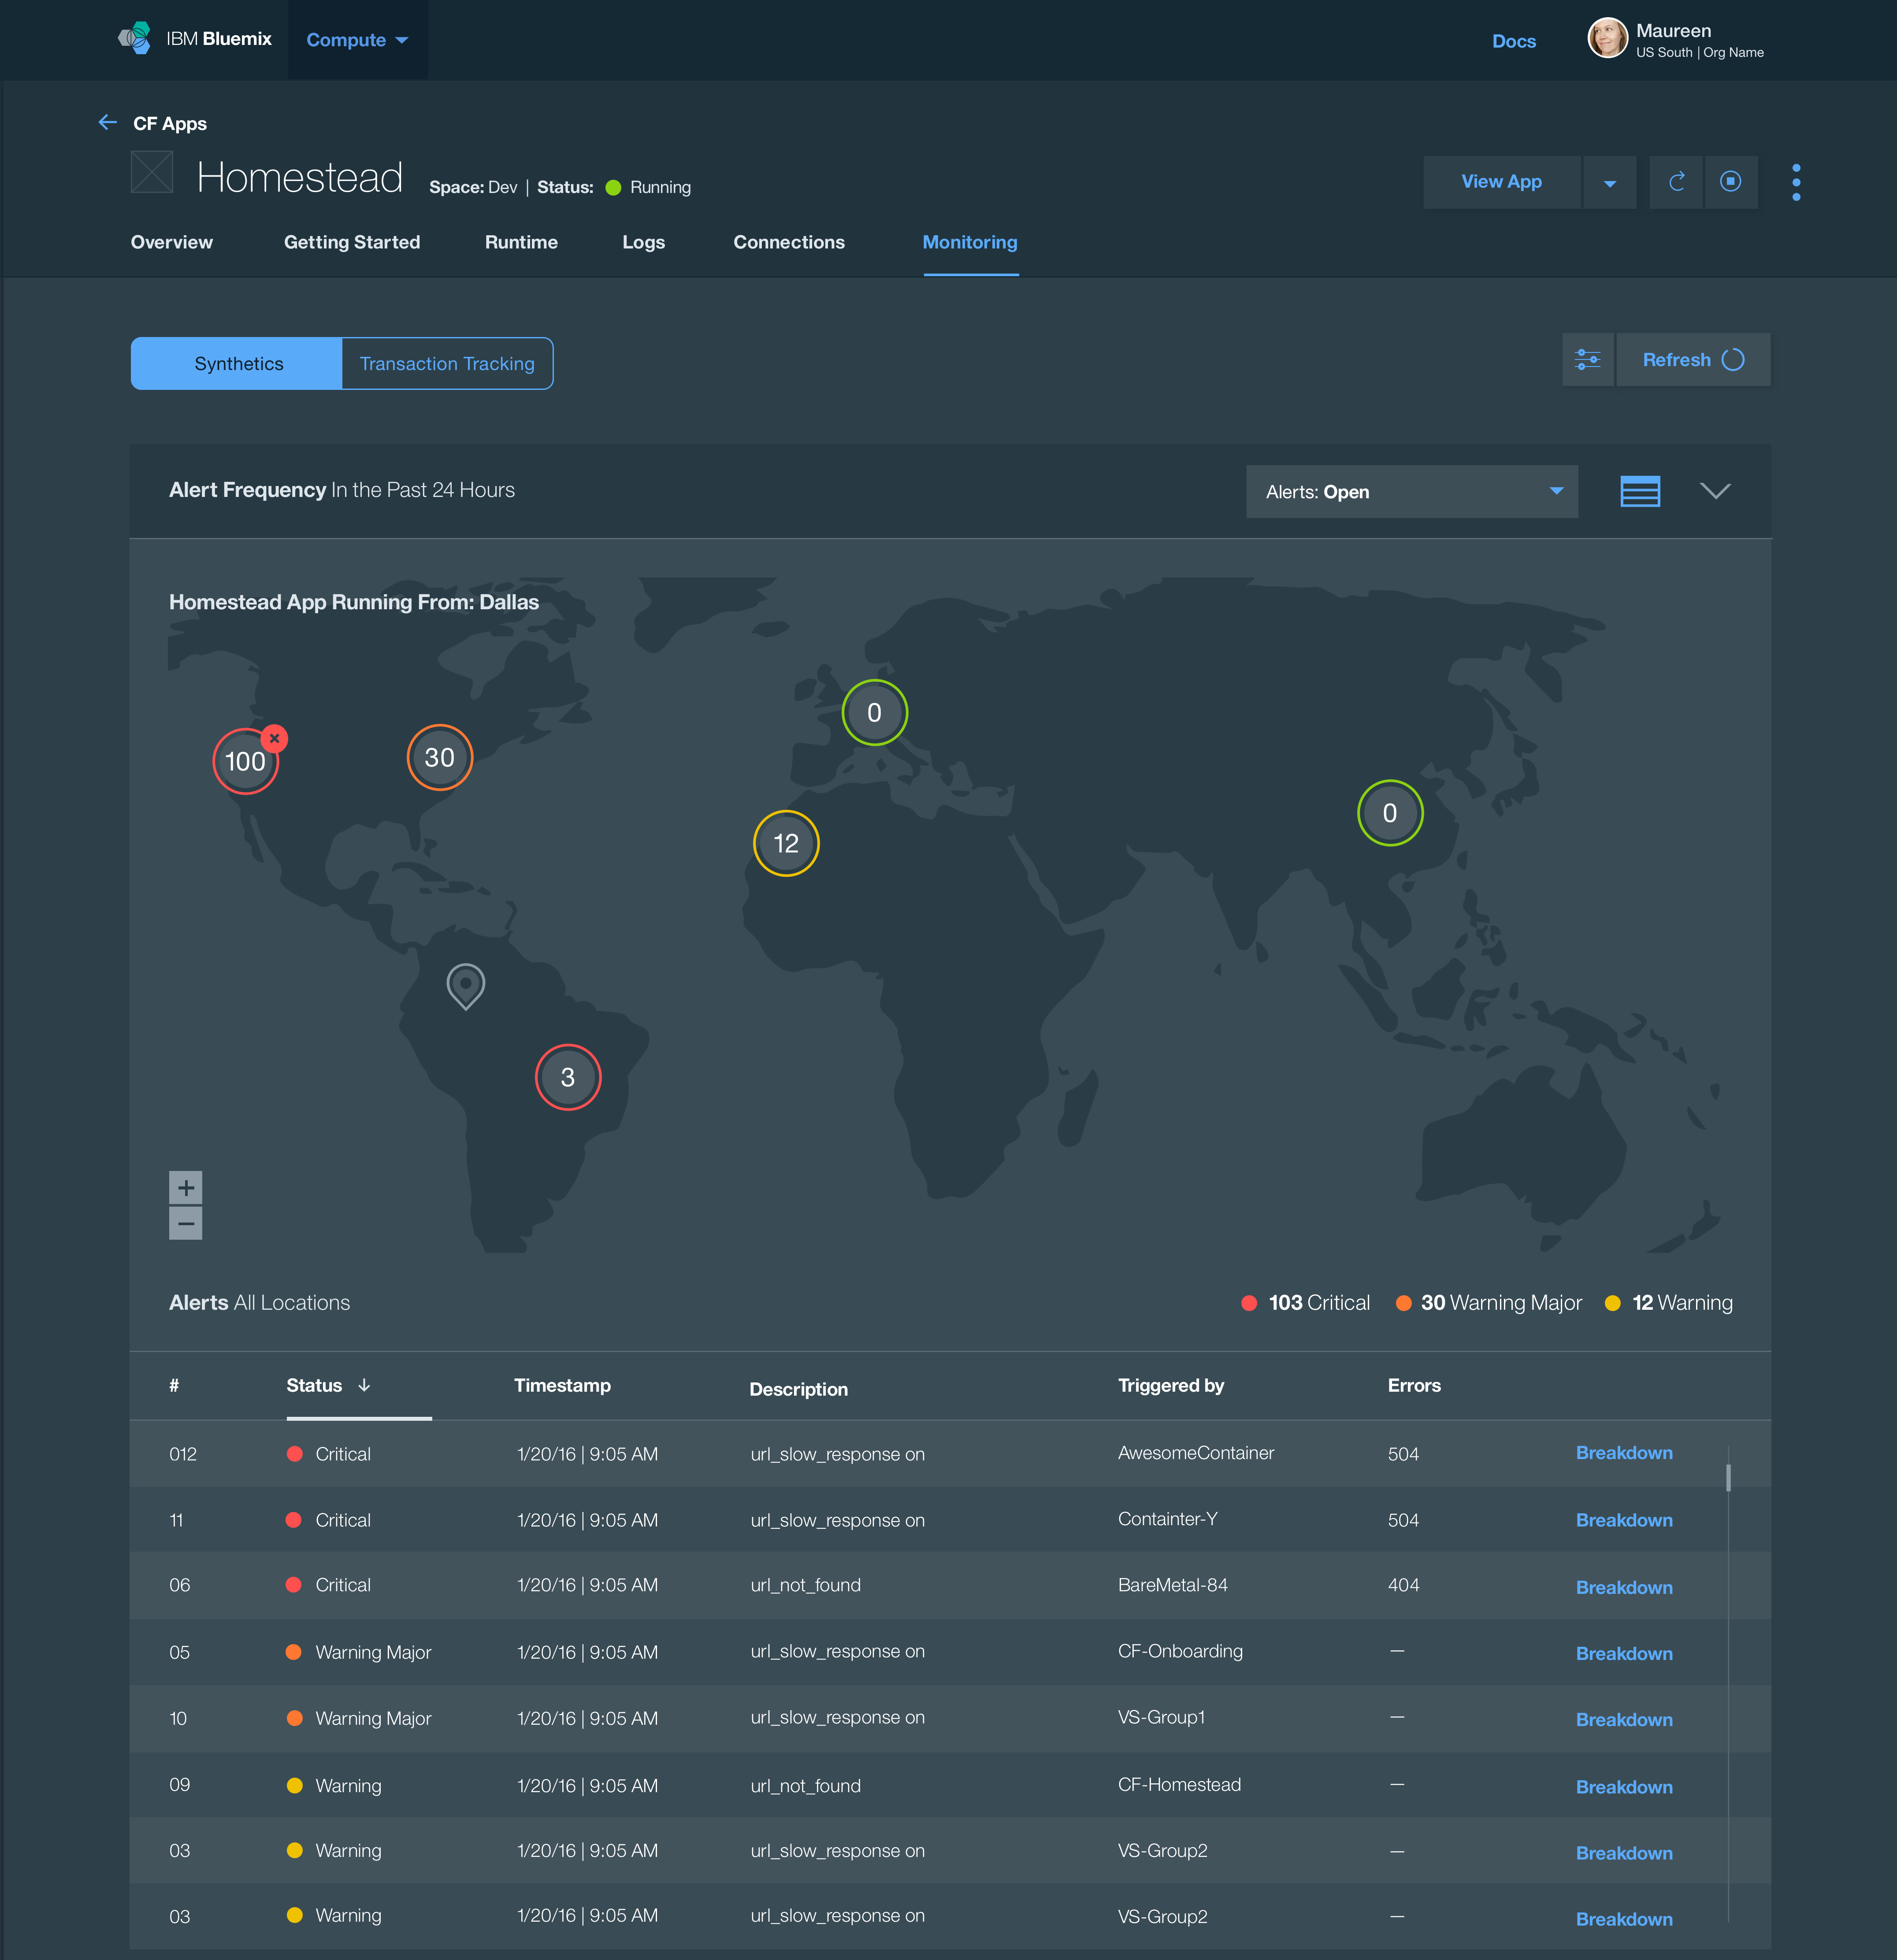
    With synthetic monitoring, DevOps teams can simulate user behavior and proactively detect performance problems from around the world and around the clock, before they impact their users. They can maximize uptime and ensure good response by pinging the application URLs and APIs and running simulations to check if the most common paths traversed by users are responding fine.

    Some of the key capabilities of synthetic monitoring that are important to DevOps squads:

    syntheric-pic

    • Reports availability, response time and user satisfaction score (such as Apdex) for all web pages, URLs and critical user interactions from around the world, 24X7
      • Runs synthetic tests as often as once per minute or even less than that, to test:
        • Webpage loads
        • REST API calls
      • Runs simulated user interactions through scripts once every few minutes
    • Requires minimum setup and maintenance with preferably a SaaS solution with globally hosted probes. Private probes are required for monitoring internal applications.
    • Incorporated into the DevOps life cycle as part of the delivery pipeline such that synthetic tests can be run in dev/test, staging and then in production.
    • Provides granular controls on what tests to run, how often, from where and what to validate in the HTTP response code.
    • Easy-to-use scripting tools that do not have a learning curve and preferably open-source. Often, automated regression test scripts used in development can be reused to run synthetic simulations in production.
    • Alerts users of issues through not only their preferred channel of notification, such as email or SMS but also through their primary collaboration channel.
    • Provides relevant alerts and avoids alert noise by appropriate alert filtering and retries on failure.
    • Identifies whether an issue was caused by an application deployment or change by presenting an auto-correlated view of alerts, metrics and deployment activities.
    • Isolate quickly whether the problem is in the application code or one of its dependencies such as a network latency issue or a third-party service slow down.
    • Diagnoses the exact step of failure by providing waterfall analysis of all page assets, pinpointing slow requests, broken links, large images, slow external API calls and more.
    • Accelerates diagnosis with an automated browser screenshot of the failure.
    • Compares two versions of applications to enable A/B testing.
    • Provides daily, weekly and monthly scores and reports to ensure that target SLAs for uptime and user satisfaction are being met.

    Stay tuned for the next blog on DevOps and log analytics in this five-part blog series and don’t forget to register for an upcoming interactive webcast, “Learn Why We Must Shift APM Left in the DevOps Lifecycle.”

    About the Author / Payal Chakravarty

    payal-chakravartyPayal Chakravarty is offering leader for the Application Performance Management portfolio at IBM. She has nine years of experience in enterprise technology in various roles including product management, strategy, DevOps and engineering management and software development. She defined and delivered software as a service (SaaS) and on-premises software for Application Performance Management, Hybrid Cloud Monitoring, Data Center Management, and Operational Analytics. Payal has an MBA from Duke University and a MS in Computer Science from North Carolina State University. You can find her on Twitter, where she tweets about all things DevOps and cloud. Connect with Payal on LinkedIn / Twitter

  • Continuous Monitoring: The Role of DevOps and APM

    Continuous Monitoring: The Role of DevOps and APM

    To enable faster and better response to changing customer needs, enterprises are increasing their release frequency for applications. This, in turn, demands tighter alignment and collaboration than traditionally has been seen between the line of business, development and IT operations, driving the need for enhanced collaboration, automation and information transparency among these groups. To achieve seamless internal collaboration, many enterprise customers are adopting a DevOps approach.

    DevOps is an enterprise capability that enables the continuous delivery and continuous deployment of software. It reduces the time needed to address customer feedback. DevOps brings once-siloed Dev and Ops together to improve agility and achieve these benefits:

    • Improves collaboration between developers and operations specialists by using shared DevOps tools.
    • Facilitates continuous delivery of software by enabling collaborative testing throughout the development and release processes.
    • Automates the manual processes of release management, infrastructure provisioning, orchestration, monitoring, containerization and virtualization.
    • Corrects misalignments of people and goals by building closer links between developers and operations.
    • Incorporates customer feedback in the development process to facilitate agile development.

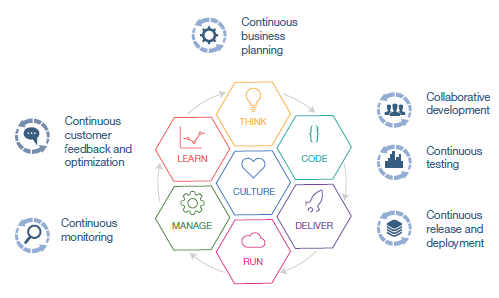
    IBM has identified six phases in the DevOps life cycle, plus necessary cultural considerations, for successful implementation of a DevOps approach (Fig 1).

    pic

    Fig. 1 – Six phases of the DevOps life cycle

    In the Manage phase of the DevOps life cycle, continuous monitoring of applications in production environments is typically implemented with application performance management (APM) solutions that intelligently monitor, analyze and manage cloud, on-premise and hybrid applications and IT infrastructure. These APM solutions enable you to monitor your users’ experience and improve the stability of your application infrastructure. It helps identify the root cause of issues quickly to proactively prevent outages and keep users satisfied.

    With a DevOps approach, we are also seeing more customers broaden the scope of continuous monitoring into the staging, testing and even development environments. This is possible because development and test teams that are following a DevOps approach are striving to use production-like environments for testing as much as possible. By running APM solutions earlier in the life cycle, development teams get feedback in advance of how applications will eventually perform in production and can take corrective action much earlier. In addition, operations teams that now are advising the development teams get advance knowledge and experience to better prepare and tune the production environment, resulting in far more stable releases into production.

    Applications are more business critical than ever. They must be always up, always fast and always improving. Embracing a DevOps approach will allow you to reduce your cycle times to hours instead of months, but you have to keep ensuring a great user experience! Continuous monitoring of your entire DevOps life cycle will ensure development and operations teams collaborate to optimize the user experience every step of the way, leaving more time for your next big innovation.

    This continuous monitoring blog is the first in a series that focuses on collaboration between development and operations teams. We will explore this topic in detail in upcoming blogs:

    • Synthetic Monitoring: Developers, testers and operations staff all need to ensure that their internet and intranet mobile applications and web applications are tested and operate successfully from different points of presence around the world.
    • Alert Management: Developers, testers and operations staff all need to send notifications via email, voice mail, text, mobile push notifications and Slack messages when specific situations or events occur in development, testing or production environments, to get the right people’s attention and to manage their response.
    • Deployment Automation: Developers, testers and operations staff use different tools to schedule and deploy complex applications and configure them in development, testing and production environments. We will discuss the best practices for these teams to collaborate effectively and efficiently and avoid potential duplication and erroneous information.
    • Analytics: Developers need to be able to look for patterns in log messages to identify if there is a problem in the code. Operations need to do root cause analysis across multiple log files to identify the source of the problem in complex application and systems.

    Stay tuned for the next blog on synthetic monitoring in the series and register for an upcoming interactive webcast, “Learn Why We Must Shift APM Left in the DevOps Lifecycle.”

    About the Author / Arun Biligiri

    Arun Biligiri

    Arun Biligiri is the leader of the Application Performance Management Offering Management team at IBM. Arun has over 20 years of experience in technology in various different roles including entrepreneurial, development, product management and sales engineering. He has worked closely with innovative enterprises and has extensive experience in addressing cloud, analytics needs in efficiently managing their data centers and clouds. He has an MBA from the Wharton School, and MS from the University of California, Berkeley. Connect with Arun on Twitter / LinkedIn

  • Application Monitoring in the Age of Big Data

    Application Monitoring in the Age of Big Data

    Operations (or ops, as it is known colloquially) has been necessary since the first shared systems came online in the ’60s. While the job title didn’t necessarily exist, the same questions needed answers then as they do now:

    • Is it up and accessible?
    • Is it responding in a reasonable time frame?
    • Is it performing better or worse now than previously?

    In a simple system, say a static web site, these questions are answered easily by requesting the page. In an automated fashion, of course.

    However, when you look at any “late model” technical infrastructure, you’ll find many, many moving parts. These range from border routers to web servers, work queues to databases and data caches to big data clusters. There are thousands upon thousands of computing instances, software processes, network storage devices and network links that can go down, up or just plain wonky. This means potentially millions of places where things can go wrong.

    How do you keep an eye on all of these potential issues? How do you know if they’re responsive? How do you know if things are getting better or worse?

    Some Monitoring Progress

    The “old” method was to write some sort of monitoring script that polled some data that you thought would represent the overall health of that component. Through the years things have gotten more granular. Our monitoring script libraries have grown and we’ve even instrumented our applications with counters (statsd, librato, etc.) and come up with big data storage (opentsdb) to house all of these data points.

    The question remains, Do we have any more clarity than before? We unarguably have more data points. So we must know more about the performance of our systems, right?

    Turns out, in practice, we just have a lot of data and a lot of people attempting to decipher what that data means. If you’ve worked in operations you’ve been up at 2 a.m. looking at status dashboards with green, yellow and red icons and many, many graphs, all in an effort to answer the question: What is going on?

    Sure, some incidents are easy: An instance was retired, or a fiber line was cut somewhere in Kansas.

    I’m talking about the ones that aren’t so clear cut, so to speak:

    • Site feels slow
    • Median response times are up 25 percent from yesterday
    • Usage is down week over week compared to some relevant time frame

    How do you answer those questions in a haystack of data points, up/down status and, in some cases, just plain noise? Application performance managers (APMs) came along and gave us tooling in the app frameworks and the browser. Now we have visibility into which calls are performing poorly and how our app “feels” to the end user.

    This has helped by breaking down the haystack into smaller haystacks and provided a way to search and sort potential performance issues. However, most APM tools depend on instrumenting code such as Java, .Net or Ruby, and are not able to provide monitoring insights for the rapidly growing open source frameworks such as Grails, Akka, Netflix OSS and the like. We’re still left with the haystack problem: What is going on?

    When I’m up at 2 a.m., stumbling over to the computer to find out what issue PagerDuty has alerted me to, I don’t really want to pore through page after page of graphs and up/down status. What would be really helpful is a system that can aggregate all those monitoring data flows and statuses, actually apply some intelligence. Then it could tell me, “Look at this response time of this component, and this metric is reporting something anomalous. This is most likely causing your issue right now.”

    In other words, it would be helpful to have a system that can show both the symptoms and the root cause of the issue. That system also would provide high-quality, high-value information about my infrastructure and combine anomaly detection with root cause analysis to provide real root cause detection.

    One new startup, OpsClarity, is hoping to make troubleshooting more accurate and efficient by combining data science and anomaly detection with root cause analysis.

    Perhaps this is the long overdue beginning of the next age in monitoring.


    About the Author/Michael Hobbs

    Michael Hobbs HeadshotMichael Hobbs is the director of Technical Operations at Expa, a startup studio based in San Francisco. Significant experience in building, operating and automating highly scalable application infrastructures has allowed him to contribute to the success of Infusionsoft and Stumbleupon, among others. Michael continues to put that expertise to work at Expa by advising and assisting the next generation of Internet companies. Michael is also a significant contributor to many open source projects, including dokku and herokuish.
     

  • The Role of APM in Continuous Integration and Continuous Release

    Today’s software-defined and -driven business requires fast changes in business models—a phenomenon permeating successful businesses. What this means is almost every company is learning how to make small, rapid changes and adjustments within their business, especially within software systems. As a result, IT is feeling immense pressure to evolve, and the net result is a major uptick in private cloud environments (especially Apprenda, Pivotal Cloud Foundry and Red Hat OpenShift) and public clouds (especially Amazon and Microsoft) within our install base of large enterprises. These new platforms enable faster development, testing and releasing of software.

    Enterprise customers are getting much smarter by using automation to drive the software life cycle, including continuous integration, and even experimenting with and using continuous release processes. This is no longer a startup scenario; it’s a strategy for our large, enterprise customers. These companies are trying to build agile development and operations teams by changing people, process and technology to enable a DevOps feedback loop:
    image02

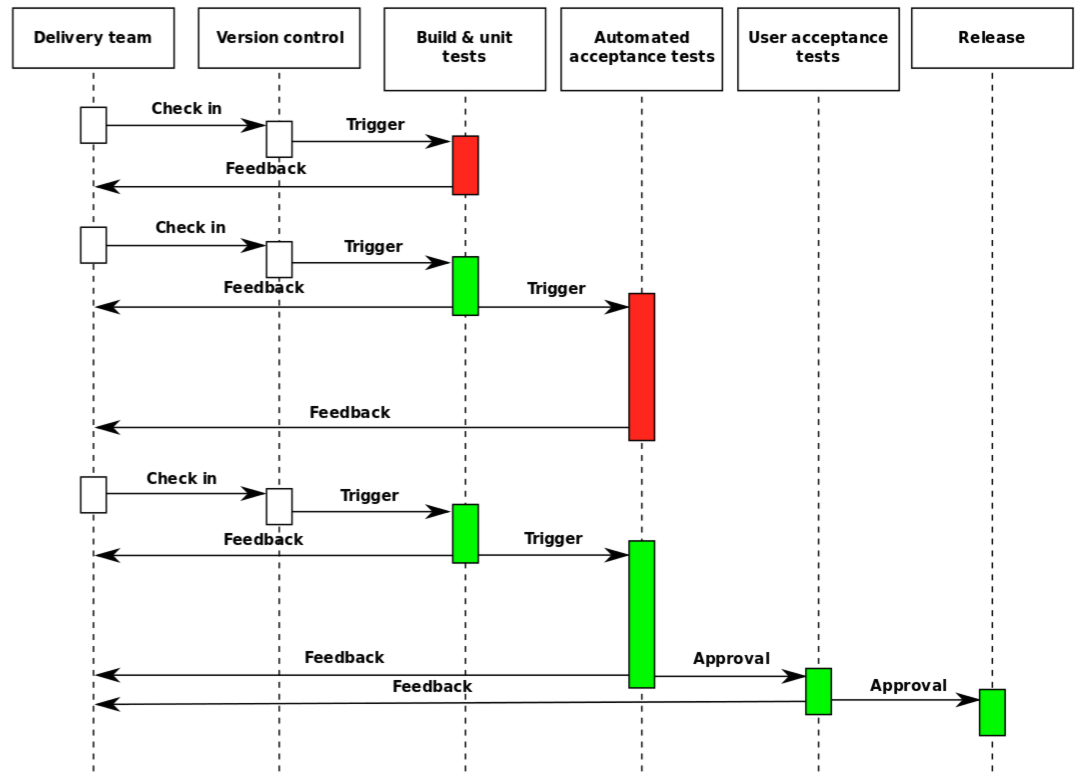
    Wikipedia describes the continuous delivery loop as follows:

    DeliveryLoop

    Within this loop, application performance management (APM) can be part of build, unit, regression and load tests to drive the automated acceptance testing before new code is pushed to production. In fact, at the recent AppSphere 2015 user conference we had several great talks on this subject.

    The first talk was presented by our customer The Container Store‘s  August Azzarello, who discussed, “How The Container Store uses AppDynamics in the Development Lifecycle.” The company began with APM in production, in an effort to improve software quality before production. It began the expansion by installing APM within test, integrating it into functional and performance test suites. It also enabled alerting from dev/test so that developers and testers both understood when there were performance deviations and issues before production.

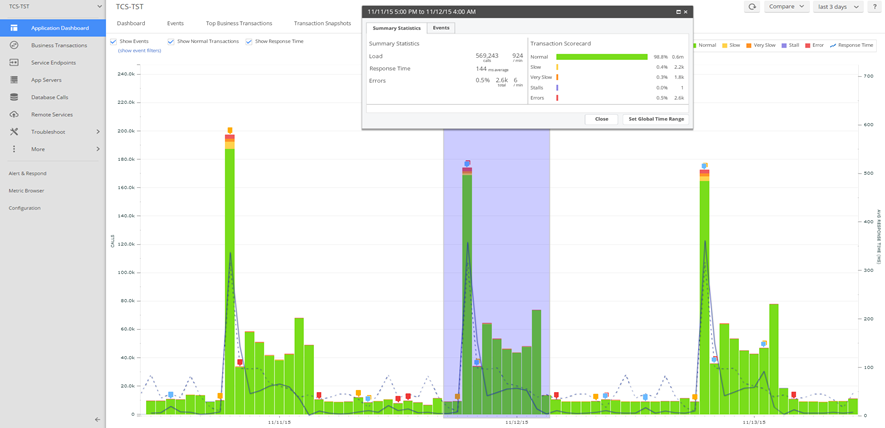
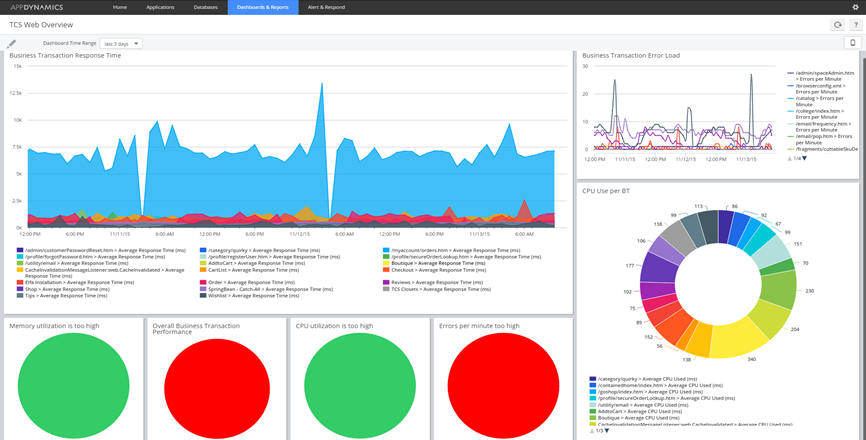
    Key features the company leveraged in pre-production included dashboards such as this one:image03

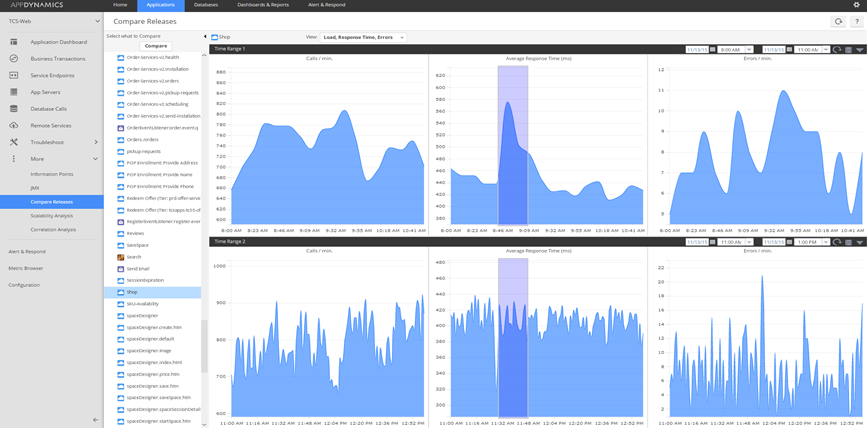
    Comparative analysis views such as this one:

    image04

    And being able to understand between releases if they were improving or degrading:

    image00

    The Container Store is using open source tools including Selenium for functional testing and Locust.io for performance testing.

    During his discussion, August also explained some of the major benefits the company saw from implementing APM in pre-production. Here are some best practices outlined by August in his discussion:

    • Monitor everything
    • Test continuously
    • Performance test early in development life cycle
    • Empower development & QA team members

    Some benefits The Container Store has seen, according to August, are:

    • Set performance expectations before production deployments – about 40 percent improvement since it started using AppDynamics in test
    • Fine-tune alert and business transaction policies prior to production deployments
    • Identify testing requirements and testing gaps
    • Decrease performance test result reporting to 20 minutes from five hours

    One of my favorite talks (which is why I selected it for the deep dive track at AppSphere) was the talk given by one of our senior sales engineers Steve Sturtevant, who came to AppDynamics from PayPal two years ago. In his talk, titled, “DevOps and Agile: AppDynamics in Continuous Integration Environments,” he explained the integration work he did. He also delved into the questions, Can you scale and auto implement monitoring in dynamic environments? Do you quantify the impact of change? Steve also offered a demo with integration between Puppet, Jenkins, ServiceNow and AppDynamics in his examples, with automation throughout the life cycle.

    One of our partners Electric Cloud specializes in continuous delivery and embraces an open ecosystem of technology providers and open source software. It has put together some great resources for people looking to explore the rest of the feedback loop: