Category: News

  • Survey Surfaces Multi-Cloud Computing and Cost Challenges

    Survey Surfaces Multi-Cloud Computing and Cost Challenges

    A survey of 360 CIOs and IT leaders in the U.S. and the United Kingdom found that, as the number of cloud platforms an organization employs expands, the number of tools they are required to deploy and master does, too.

    The survey, published this week by Virtana, a provider of a platform for managing cloud migrations, found nearly two-thirds of respondents (63%) reported their organization relied on at least five separate tools for migration, cloud cost optimization, integrated performance monitoring, application performance management and cloud infrastructure monitoring. A full 83% are expending some level of manual effort to consolidate data from all of these tools, or are simply using them in isolation from one another. Only 17% said data integration is fully automated.

    Nearly three-quarters (73%) also noted that siloed efforts limit their ability to realize the full potential of the cloud.

    It appears that multi-cloud computing only makes managing IT more challenging. Not to mention the increased pressure a multi-cloud approach puts on DevOps and developers that already juggle an overwhelming number of tools for development, DevSecOps and more. And, of course, the risk of cloud misconfiguration grows alongside the number of cloud platforms an organization uses.

    According to the Virtana survey, a total of 82% of respondents have a multi-cloud strategy, with more than three-quarters (78%) deploying workloads in more than three public clouds. A full 59% now run more than half of their workloads on public clouds. More than half (51%) also plan to increase the number of public cloud instances they support this year, with more than a third (34%) planning on using five or more cloud platforms.

    More challenging still, more than three quarters (76%) are in the early stages of implementing serverless computing frameworks. Overall, more than half (52%) will continue to maintain a hybrid environment as part of their core IT strategy. A full 96% of respondents see value in workload portability, but only 71% are in the early stages of achieving that goal. Top benefits anticipated include maximized cost savings (58%), reduced cloud service provider risk (46%) and increased business agility (43%). However, nearly three-quarters (75%) have either no or few cloud governance capabilities (34%) or have stitched together disparate tools to achieve that goal (41%).

    Jonathan Cyr, vice president of product management for Virtana, said that as the global economy becomes more challenging, it’s only a matter of time before sensitivity to cloud costs start to rise. Each time the overall IT environment expands, increases in complexity drive the total cost of IT higher.

    It’s not clear to what degree that sensitivity to cloud cost might drive more IT organizations to centralize the management of IT environments. In theory, a single control plane could be employed to manage multiple cloud computing environments, but today most clouds are still managed in isolation from one another.

    IT teams also find themselves inadvertently locked into a cloud platform. The more developers invoke proprietary application programming interfaces (API), the more difficult it becomes to migrate a workload from one cloud platform to another.

    It’s all but certain there will be a cloud management reckoning in the months ahead. Development teams may prefer one cloud platform over another for many reasons but, as the cost of IT continues to increase, there will soon be tougher cloud cost questions emanating from the finance office.

  • Datadog Adds Support for OpenTelemetry Protocol

    Datadog Adds Support for OpenTelemetry Protocol

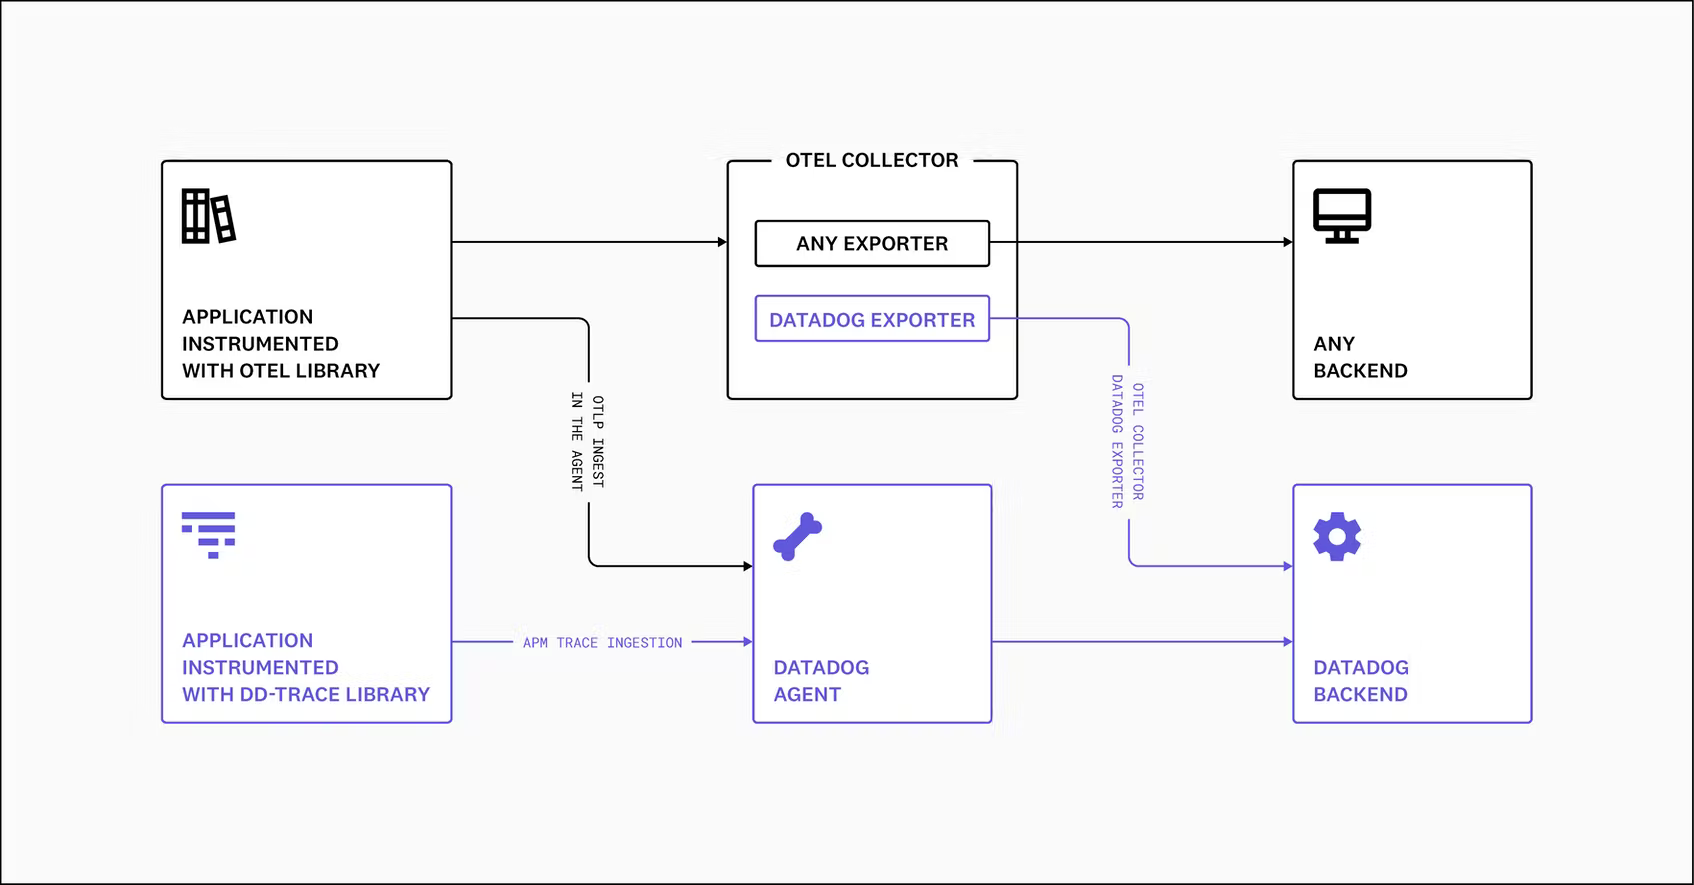
    At the KubeCon + CloudNativeCon Europe 2022 event, Datadog announced it made support for the OpenTelemetry Protocol (OTLP) generally available in the agent software it provides to instrument applications.

    Ilan Rabinovitch, senior vice president of product and community at Datadog, said that capability eliminates the need to install a separate OpenTelemetry collector to aggregate metrics, logs and traces from applications instrumented using the open source OpenTelemetry libraries being advanced under the auspices of the Cloud Native Computing Foundation (CNCF).

    The Datadog Agent can already collect application profiles, network data and infrastructure metrics via more than 500 integrations provided by Datadog. OpenTelemetry extends that capability with a set of application programming interfaces (APIs) and a wire protocol for instrumenting applications.

    Datadog is the latest in a series of providers of observability platforms that added support for the OpenTelemetry project that continues to gain momentum. The goal is to make it less costly to instrument applications using open source agent software that surfaces a consistent set of interfaces. Previously, each observability platform provider developed their own agent software that DevOps teams would need to install. Datadog is making a case for agent software that, in addition to collecting data from existing applications, is now compatible with the OLTP protocol created by contributors to the OpenTelemetry project.

    The issue that DevOps teams will need to come to terms with is that while OpenTelemetry agent software is free, many of them have already installed proprietary agent software to instrument applications. That agent software can often provide additional context that is not yet available in OpenTelemetry. History, however, shows that, in time, open source projects with larger numbers of contributors will outpace the ability of any single vendor to innovate.

    One way or another, DevOps teams will be instrumenting more applications as more microservices-based applications are deployed. The dependencies that exist between microservices make it too difficult to manage an application environment without additional instrumentation. The goal within many DevOps teams is to eventually replace the hodgepodge of monitoring tools that track a limited set of pre-defined metrics with an observability platform that not only aggregates metrics but enables DevOps teams to launch queries and surface IT issues before they become a major issue. In some instances, the rationalization of monitoring tools will help justify the acquisition of an observability platform.

    Observability, of course, is one of the core tenets of any set of DevOps best practices. Achieving it, however, has always been a challenge. Rabinovitch said an observability platform that regularly surfaces critical IT issues without requiring DevOps teams to launch queries to search for anomalies will eventually win the battle for observability supremacy.

    In the meantime, there is already no shortage of observability platforms. The challenge will be determining which one enables the highest level of instrumentation at the most reasonable cost.

  • Continuous Delivery Foundation Adds Interoperability Project

    Continuous Delivery Foundation Adds Interoperability Project

    At a CDEventscon event this week, the Continuous Delivery Foundation (CDF) announced it is hosting a CDEvents project through which it hopes to create a vendor-neutral specification for defining the format of event data across multiple services, platforms and systems.

    Andrea Frittoli, open source developer advocate at IBM, co-creator of the CDEvents project and member of the CDF technical oversight committee, said the open source consortium is launching this initiative to foster interoperability across continuous delivery (CD) platforms. In the context of the CDF, that mission spans both continuous integration and continuous deployment platforms that are subsets of CD.

    CDEvents itself is based on an existing CloudEvent specification created by the Serverless Working Group within the Cloud Native Computing Foundation (CNCF). As part of the effort, the CDF has already built a proof-of-concept implementation that enables Tekton pipelines and Keptn orchestration tools for managing application life cycles to communicate over a common event protocol.

    Collecting metrics from multiple DevOps platforms is a challenge because there is no standard for sharing event data. Analytics providers and value stream management platforms that collect metrics need to create connectors for each platform they support. CDEvents would provide a standard interface for collecting metrics from any developer tool or platform. That data would also make it easier to visualize workflows that describe artifacts and their metadata, he added.

    That lack of a common way to describe events means developers not only must constantly re-learn how to consume events, it also limits the potential for libraries, tooling and infrastructure to facilitate the delivery of event data across environments ranging from routers and tracing systems to software development kits (SDKs).

    Naturally, it may be a while before this continuous delivery specification results in increased interoperability across DevOps environments, but the need for one across what has become a patchwork of fragmented tools and platforms is self-evident. Many organizations are already investing in an assortment of analytics tools in the hopes of improving the rate at which applications can be developed and deployed. In too many instances, DevOps teams have inadvertently created bottlenecks that slow down the rate of development. The challenge is that, as new tools and platforms are added to a DevOps workflow, they are not likely to be able to share data with those applications until a connector is created.

    Not everyone, of course, is a fan of having more metrics. The goal should be to coach teams on how to become more efficient rather than implementing a set of draconian mandates. Arguably, such mandates are only going to drive away developers that are trying to strike a balance between coding as an art form and application development as a craft.

    Nevertheless, as organizations better appreciate the critical role software plays in driving business processes, the greater the desire to measure the pace and efficacy of their application development efforts—to justify the levels of investment in software development they are making.

  • Splunk Survey Surfaces Gains in Observability

    Splunk Survey Surfaces Gains in Observability

    A global survey of 1,250 observability practitioners, managers and other experts published today by Splunk found that sophisticated observability practitioners are able to cut downtime costs by 90%. That figure is based on an estimated cost of $23.8 million annually for comparative newcomers to $2.5 million. However, only 9% of respondents are advanced enough to be considered observability leaders compared to 59% that are still beginners.

    Those leaders reported they are seeing a 69% better mean-time-to-resolution (MTTR) for unplanned downtime or performance degradation thanks to investment in observability. The survey also noted those same organizations launched 60% more products or revenue streams from application development initiatives in the last year.

    Observability has always been a core DevOps tenet, but achieving and maintaining is a challenge. Most DevOps teams today aspire to be able to maintain some level of continuous monitoring. However, as it becomes easier and less costly to instrument applications, interest is rising in observability platforms that make it simpler to launch queries and investigate anomalies.

    Spiros Xanthos, senior vice president and general manager for observability at Splunk, said observability platforms are clearly driving down the cost of downtime. There is also a clear correlation between organizations that have embraced observability and the number of microservices-based cloud-native applications that have been deployed, he noted. In effect, increased complexity is driving organizations to turn to observability platforms to manage IT environments in the age of the cloud, said Xanthos.

    The survey found 75% of respondents have multiple cloud-native applications that run in multiple environments. Just over one-third (34%) of internally developed applications are based on microservices constructed using containers, with 28% of respondents reporting they exclusively run cloud-native applications on public cloud infrastructure.

    Overall, the survey also found that two-thirds of leaders reported their visibility into application performance is excellent compared to 44% of beginners, while 64% of leaders reported that visibility into their security posture is excellent compared to 42% for beginners.

    The survey also found 59% of leaders can push code to production on demand for most internally developed applications compared to 28% of beginners. A total of 41% of leaders said they can detect problems associated with internally developed applications within minutes compared to 20% for beginners.

    It’s still early days as far as adoption of observability platforms is concerned but, theoretically, IT should become easier to manage even as the number of platforms employed continues to expand. Advances in analytics and artificial intelligence (AI) are improving the signal-to-noise ratio so that not only are more issues being surfaced sooner but that more trusted recommendations are being made, said Xanthos.

    Observability is, of course, a journey. Most organizations are not even quite sure what type of questions they should formulate to get the most value from investment in an observability platform. Organizations should start small, with a finite project to gain an understanding of how to leverage observability more broadly as they gain more maturity, said Xanthos.

    Regardless of the approach to observability, the one thing that is certain is that traditional IT monitoring is no longer sufficient in an era where IT environments get more complex by the day.

  • Apple Allows 50% Fee Rise | @ElonMusk Fans: 70% Fake | Microsoft Salaries up by 100%?

    Apple Allows 50% Fee Rise | @ElonMusk Fans: 70% Fake | Microsoft Salaries up by 100%?

    Welcome to The Long View—where we peruse the news of the week and strip it to the essentials. Let’s work out what really matters.

    This week: Apple lets devs increase subscriptions “without consent,” Twitter has more than 19% spam accounts, and we dig into the claim that Microsoft is about to double salaries. (more…)

  • Observe, Inc. Dives Deeper Into Observability

    Observe, Inc. Dives Deeper Into Observability

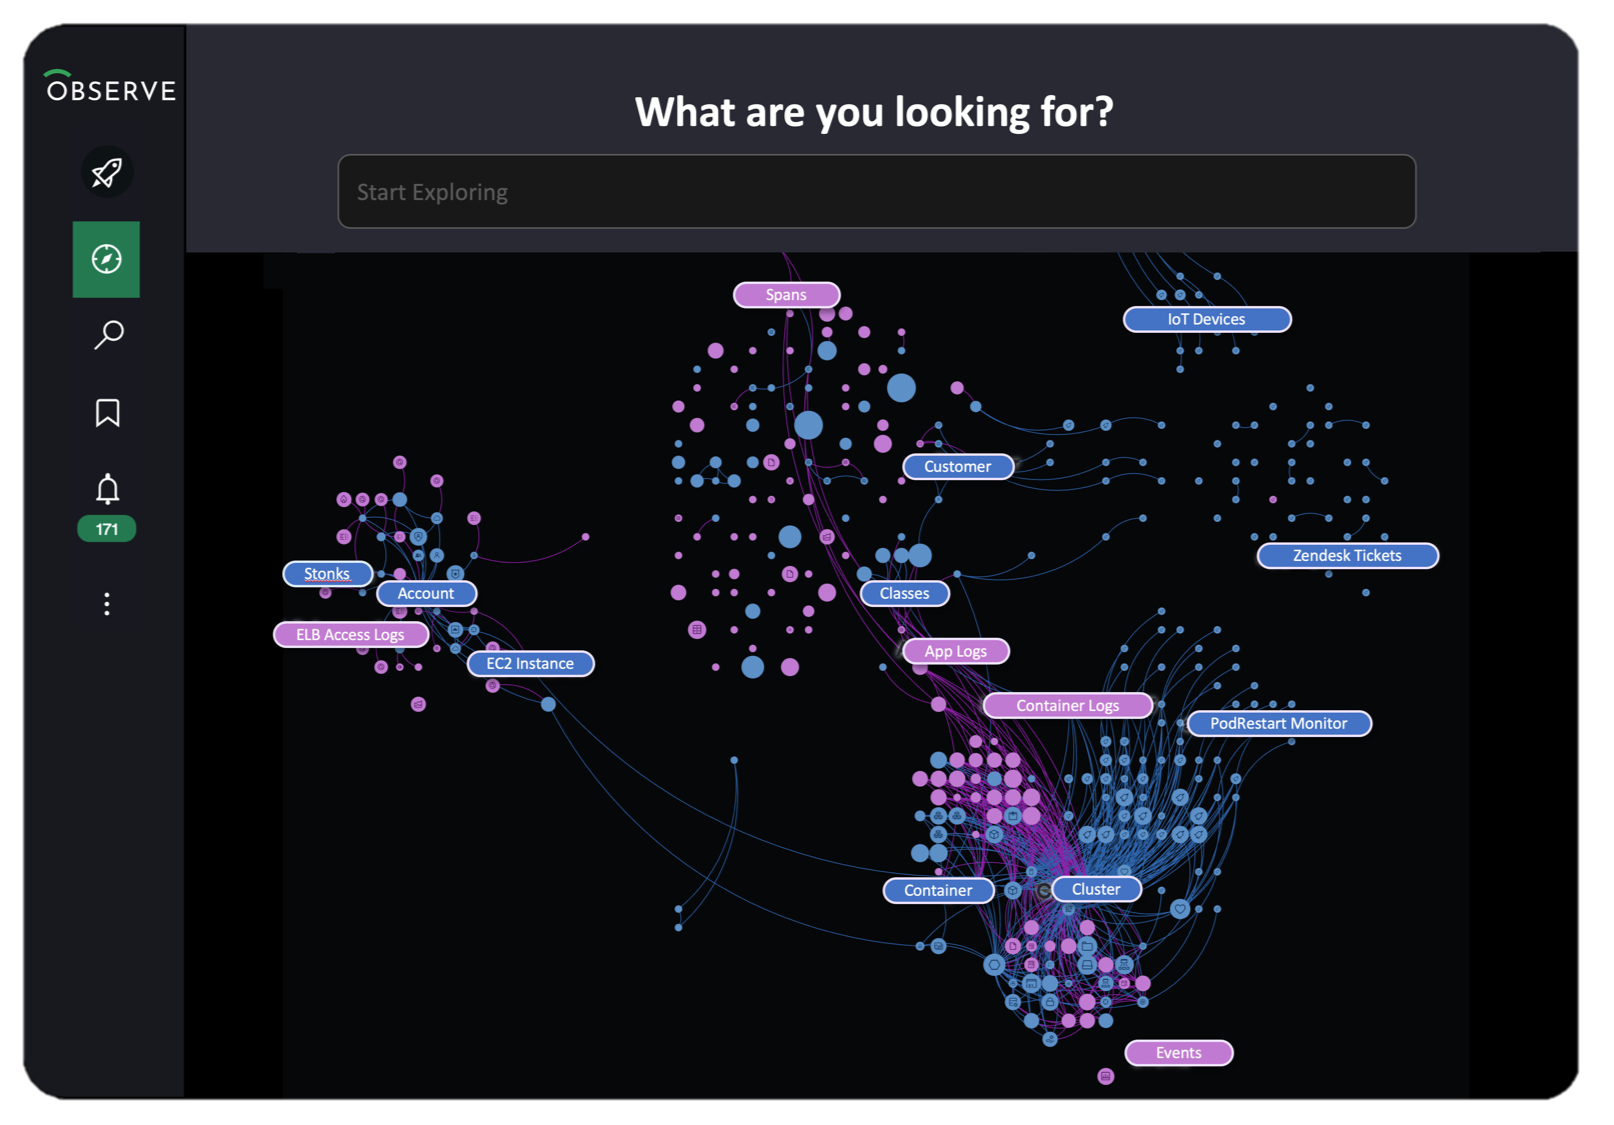
    Fresh from picking up an additional $70 million in funding, Observe, Inc. announced this week it has added multiple tools, dubbed Data Universe Maps, to its observability platform to visualize all datasets and surface underlying event data.

    The company also added pre-built applications for Kubernetes, Amazon Web Services (AWS) and Jenkins environments with editions for Google Cloud Platform (GCP) and Microsoft Azure planned for later this year. Observe Apps are intended to make it easy for IT teams to ingest data that is surfaced via pre-built dashboards that will generate alerts when issues arise.

    Finally, Observe, Inc. has added dashboards that provide transparency into its usage-based pricing model. IT teams can now more easily determine how many credits are consumed by both users and specific datasets to help contain costs.

    Observe, Inc. CEO Jeremy Burton said those tools are crucial because in the absence of tools to control data costs, most organizations will soon discover that observability is unsustainable.

    Of course, it’s not clear yet how many organizations are moving beyond monitoring metrics to embrace observability and launch queries to discover the root cause of performance issues. Many organizations don’t have the level of expertise required to structure such queries. However, as more organizations struggle to investigate and remediate issues impacting customer experience, interest in observability platforms is rising, noted Burton.

    Burton said thus far, as a startup, Observe, Inc. has expanded its customer base by a factor of three to now include 50 organizations, which has resulted in a five-fold increase in the number of monthly active users of the platform. The platform is now ingesting more than 40TB of data each day, with more than 25 million queries each day launched across nearly one trillion rows of more than 10 petabytes of data. Capital One is included among the investors in Observe, Inc.

    At the core of the Observe platform is a graph engine that makes it simpler to uncover the relationships between machine data that is ingested into the platform.

    Going forward, Burton said Observe intends to add support for distributed tracing using the open source agent software created by the OpenTelemetry project that operates under the auspices of the Cloud Native Computing Foundation (CNCF).

    Change within enterprise IT organizations happens slowly. Many will be using legacy monitoring tools alongside observability platforms for years to come. However, there is an opportunity to rationalize monitoring tools as the capabilities of observability platforms continue to expand.

    In the meantime, IT environments will continue to become more complex as more modern applications based on microservices and constructed using containers are deployed. These applications, over time, are generally more resilient than monolithic applications; given all the dependencies between microservices, determining the root cause of a performance issue can be a major challenge. As a result, it may be just a matter of time before this new class of applications ultimately forces the observability issue in the enterprise.

  • Nobl9 Shares SLO-as-Code Methodology

    Nobl9 Shares SLO-as-Code Methodology

    Nobl9 has released version 1.0 of an open specification for defining service level objectives, dubbed OpenSLO, and, in addition, has defined a repeatable SLO methodology.

    Kit Merker, Nobl9 COO, said the Service Level Objective Development Lifecycle (SLODC) methodology represents an effort to create a set of best practices for achieving and maintaining SLOs that are implemented as code within an application environment.

    A survey of more than 300 IT managers and executives conducted by Dimensional Research on behalf of Nobl9 found only 29% of respondents had no plans to implement SLOs. A full 94% of respondents that have or plan to implement SLOs intend to map them directly to business operations, with 91% reporting they expect that effort to improve decision-making. More than 80% also said their organizations are planning to increase the use of SLOs, with 87% indicating SLOs should improve overall microservices performance.

    The challenge is that most organizations have limited visibility into their IT environments. The survey, for example, found less than half of respondents (46%) had visibility into all their IT environments. Only 45% and 35% claim to have visibility into containers and microservices, respectively. More than three-quarters (78%) said hybrid clouds make observability more difficult.

    Ironically, 45% of companies reported they already employed 11 or more observability and monitoring tools. On the plus side, 31% have hired site reliability engineers (SREs), while nearly half (46%) planned to create that role.

    Nobl9 is trying to spur greater adoption of SLOs by making available an open source SLO specification that defines a common interface for constructing SLOs across a Git-based workflow. Since OpenSLO was initially launched, more capabilities have been added including a DataSource object that makes it easier to reuse connection details and which makes creating SLOs less verbose and three alerts have been defined: AlertCondition, AlertPolicy and AlertNotifcationTarget.

    Nobl9 is also releasing an OpenSLO-to-Nobl9 converter to transition OpenSLO YAML files into Nobl9 YAML when required.

    SLOs, of course, are not a new idea. They have been employed as a metric to track the performance of IT services for decades. However, as more microservices-based applications are built and deployed, it’s becoming more challenging to maintain SLOs across applications that have many more dependencies than legacy monolithic applications. Ultimately, each IT team needs to provide some sort of objective benchmark that assesses their overall effectiveness at delivering application services. SLO-as-code is intended to make it simpler to gather the metrics that confirm whether service levels are being achieved. Those SLOs are then tracked and integrated across everything from financial operations to supply chains, noted Mercer.

    It’s not clear to whether reliance on SLOs has waned over the years or if application environments simply became too complex to track meaningful metrics. However, as applications are increasingly viewed as services, it’s now only a matter of time before SLOs become more widely adopted across a modern application environment. The challenge, of course, is that defining an SLO is a lot easier than maintaining it—especially within today’s highly dynamic application environments where services tend to come, change and eventually go unexpectedly.

  • Progress Expands Scope of Compliance-as-Code Capabilities

    Progress Expands Scope of Compliance-as-Code Capabilities

    Progress this week extended its DevSecOps portfolio—built atop the Chef automation framework it acquired in 2020—to now include the ability to programmatically address compliance mandates.

    At the same time, Progress has updated the Progress Chef InSpec framework for automating the discovery of compliance issues to add support for SAP ASE, IBM DB2, Mongo, Cassandra, Oracle, MS SQL platforms along with RHEL, CentOS, Ubuntu and macOS Monterey.

    Progress has also updated the Progress Chef Enterprise Automation Stack (EAS) to add the ability to combine infrastructure configuration processing with compliance audits within a single consolidated policy definition along with a high availability capability that makes certain the platform is always accessible.

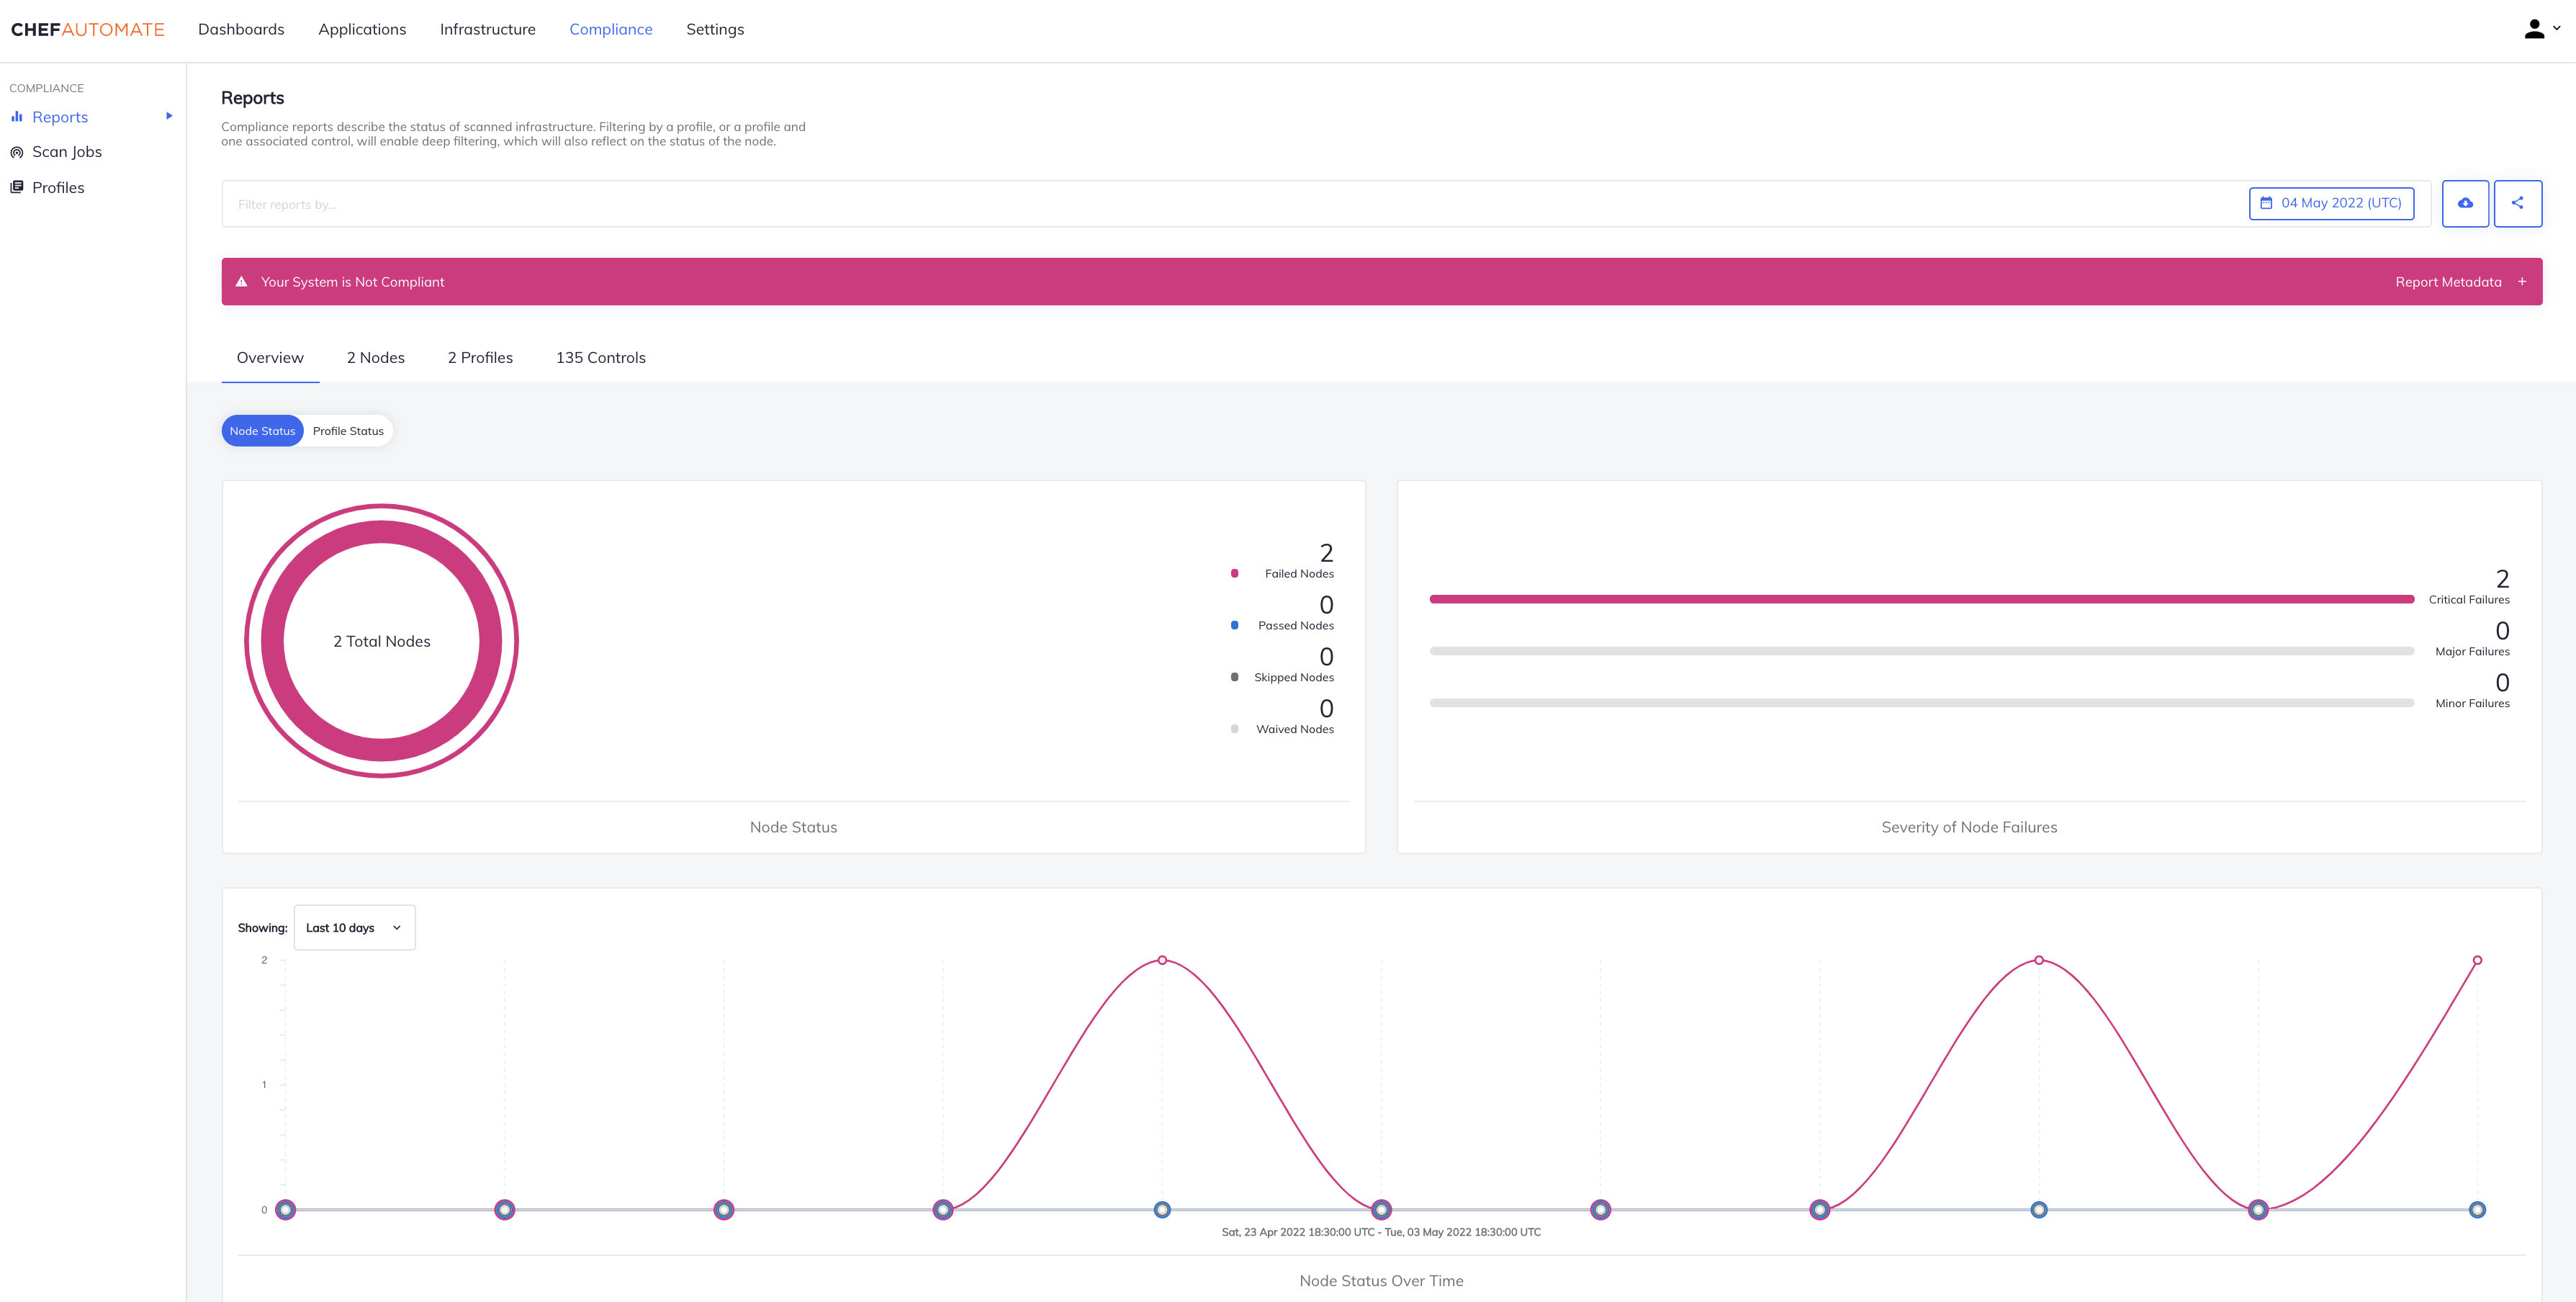
    Prashanth Nanjundappa, vice president of product management for Progress, said Progress Chef Cloud Security enables DevOps teams to take advantage of a single policy-as-code platform to consistently implement compliance policies alongside security controls across both multiple public clouds and on-premises IT environments.

    Progress Chef Cloud Security leverages certified industry benchmarks, such as the Center for Internet Security (CIS) benchmark, to continually scan and automatically detect security configuration issues at multiple stages within a DevOps pipeline. Progress has now expanded CIS benchmark profile coverage for Amazon Web Services (AWS), Microsoft Azure and Google Cloud Platform (GCP) to include more than 100 customizable pre-built service and resource templates. DevOps teams can take advantage of automated creation of code, test and documentation artifacts for those resources. Finally, visibility into the status and expected completion time for compliance scans has been added along with advanced Shell command support for control and testing without file output.

    In general, the ability to address compliance requirements within a DevSecOps workflow has become crucial because the number of misconfigurations that occur in the cloud has exploded. Developers that often have little to no security or compliance expertise are programmatically provisioning cloud infrastructure in a way that, for example, leaves ports wide open. As IT organizations embrace more cloud computing platforms, that security issue only compounds, noted Nanjundappa.

    More challenging still, cloud computing environments are becoming more complex with the rise of cloud-native applications based on platforms such as Kubernetes. The odds a developer is going to make a mistake only increase with each microservice deployed.

    Progress is betting that, as cloud computing evolves, responsibility for security and compliance will increasingly shift left toward DevOps teams; they’ll be responsible for implementing polices defined by cybersecurity and compliance specialists. The goal is to provide a set of guardrails that make configuration mistakes less likely because policies are being tested within the context of a DevSecOps workflow, said Nanjundappa.

    It’s only a matter of time before software supply chain security reviews that are occurring in the wake of a series of high-profile breaches force the DevSecOps issue within more organizations. The goal, of course, should be to eliminate the need to identify DevSecOps as separate from a DevOps workflow. Regardless of the approach, however, the one good thing about all this attention is that application environments will inevitably become a lot more secure.

  • Red Hat Adds Managed Ansible Service on Azure

    Red Hat Adds Managed Ansible Service on Azure

    Red Hat today announced general availability of a managed instance of the Red Hat Ansible Automation Platform on the Microsoft Azure cloud.

    Announced at the Red Hat Summit 2022 event, this offering makes it possible to deploy the control plane for Ansible on the Microsoft Azure cloud as an alternative to existing support for Amazon Web Services (AWS) or an on-premises IT environment.

    In addition, in version 2.2 of the Ansible Automation platform, Red Hat is previewing support for content signing technology that automatically validates content to improve overall security.

    Thomas Anderson, vice president of Ansible for Red Hat, said this managed service enables IT teams to take advantage of integrated Microsoft billing in addition to the latest features and content provided for the platform and other capabilities that have been added to optimize Microsoft Azure environments.

    The open source Ansible platform has been gaining traction as an automation framework that enables IT teams to declaratively automate tasks. It requires less programming expertise than rival automation frameworks, which Anderson said is the primary reason so many third-party vendors have adopted Ansible to automate a range of IT tasks.

    The challenge many organizations encounter today is managing multiple islands of automation across multiple clouds and on-premises IT environments. Ansible presents IT teams with the ability to begin unifying all those islands under a single framework, said Anderson.

    It’s not clear to what degree DevOps teams that have embraced rival automation frameworks might be willing to replace them with Ansible. However, as more IT teams embrace automation to make up for shortages of IT personnel, it’s apparent that Ansible is being used across a wide range of IT disciplines spanning everything from DevOps to network management.

    Regardless of the approach, the need to automate as many tasks as possible is becoming critical as IT environments grow increasingly more complex. Many of the scripts that IT teams created on their own simply don’t scale. More challenging still, they are not often documented, so every time the IT professional that created that script leaves the organization it becomes difficult to maintain that scripting code.

    In the longer term, of course, automation frameworks will be increasingly infused with machine learning algorithms capable of learning the unique nuances of individual IT environments. It’s not likely those algorithms will replace the need for IT professionals any time soon. However, rather than resisting automation, more IT professionals have concluded that the tasks required are simply too challenging to manually perform. Many will conclude they simply prefer to work for organizations that have a consistent approach to IT automation that makes it feasible for them to manage a wide range of IT tasks.

    One way or another, IT automation is becoming a standard capability that now goes well beyond the scope of a few isolated DevOps workflows. The issue is finding a way for IT professionals with varying skill levels to collaborate across a common framework that is both easily accessible and highly extensible.

  • Semiconductor Shortage May Be Here to Stay

    Semiconductor Shortage May Be Here to Stay

    Intel CEO Pat Gelsinger has cautioned that the semiconductor shortage will last until 2024, a scary reality for manufacturers, businesses and consumers alike.

    Semiconductor chips, or microchips, are essential for many digital consumer products. Anything that processes information uses these chips and with the exponential growth of technology, there has been a massive increase in demand. 

    “The rapid acceleration of the internet of things (IoT) to date and to come forever moves semiconductors ahead of oil as the world’s key commodity input for growth,” according to economic investment firm TS Lombard. 

    Although the U.S. leads the world in developing and selling semiconductors, manufacturing has shifted to Asia. Taiwan and Korea account for 83% of global processor chip production and 70% of memory chip output, according to the Semiconductor Industry Association. 

    In many of these Asian economies, harsh lockdown measures were put in place in response to COVID-19, causing bottlenecks in the supply chain. As a result, certain manufacturing tools are unavailable, limiting chipmaking capacity. 

    The shortage was originally projected to last until 2023, but Gelsinger now predicts that it will roll into 2024. 

    “The shortages have now hit equipment and some of those factory ramps will be more challenged,” Gelsinger explained.

    Semiconductor Shortage Impacts More Than Just Tech

    Semiconductors are especially important in the automobile industry. Microchips are an essential component of the modern-day car, and they enable many innovations within the industry. 

    As a result of the bottleneck, some automotive companies have limited or paused production. Tesla, for example, has halted production in 2022, citing supply chain issues as the limiting factor. 

    In response to the shortage, companies are urgently building new manufacturing facilities. Samsung is building a $17 billion semiconductor factory in Texas and Intel is spending $20 billion on two new factories in Arizona. 

    The shortage has also prompted legislative action in Florida and Texas that calls for increased funding for microchip and semiconductor factories. 

    “The more we have this capacity within our own country the more opportunities there’s going to be for people and the more secure both our economic supply chains will be and our national security,” Florida governor Ron DeSantis said of the measures he’s taking to combat the shortage. 

    No Definitive End in Sight

    Although industry experts predicted the shortage will end in 2024, there is no definitive end in sight, prompting manufacturers and businesses to strategize accordingly. 

    Some companies, like Tesla, have resorted to alternative chips and software-based solutions to endure the shortage. Companies like Latent AI offer software packages that optimize alternative hardware, which could prove to be a technological lifesaver for the many companies affected by the shortage. 

    Although the current shortage is a byproduct of the pandemic, some of the alternative solutions that have arisen may be revolutionary in filling the ever-growing demand for semiconductors.