Category: Microservices Journal

  • SOA vs Microservices

    SOA vs Microservices

    Some say microservices architecture is proof that SOA is still alive. I contend that microservices architecture replaces SOA due to deficiencies in how SOA has been implemented as well as the original intent.

    In the mid-1990s there was a surge of investment for implementing enterprise applications to replace the aging homegrown legacy applications. These new applications managed complex activities around accounting, supply chain, human resource and manufacturing. They also were easy to integrate with other facets of the business, including existing legacy applications that were not going away and new and emerging web applications for customer and internal use.

    Out of necessity, there was a rise in the number of point-to-point integrations occurring. Over time, the web of point-to-point integrations became so complex to manage that even small changes resulted in major failures. To correct this problem, a category of software emerged to make integration easier by simplifying the control plane that focused on cataloging the endpoints, fostering connections and marshalling the data. These control planes were identified as enterprise application integration (EAI). Early EAI products did not inspect or act on the data.

    Somewhere along the line, vendors became aware that there was another underlying issue: The old system and the new system used different vocabularies and message structures. Initially, the consumer of the EAI tool output did the translation itself, but then vendors saw an opportunity to increase the capabilities of the EAI tooling to also become a data plane. So, then, the EAI tooling would also handle mapping and translation.

    Now, if your source systems never change, the value of an intelligent middleware that acted as a control and data plane seems both logical and of great value. However, when the source systems change, middleware comprised of dynamic routing and mappings from the source to the target becomes a considerable limitation. Any change to the source requires comprehensive regression testing on the entire system, and you must hope you have an example of every permutation of every message that may ever be delivered as input to ensure the change does not introduce future problems.

    Having been an integration consultant during this era, I can attest to weekly failures due to message combinations that no one had ever conceived of during testing.

    So, what does any of this have to do with SOA and microservices?

    The above approach I just described evolved with the products that acted as a control and data plane morphing into the enterprise service bus (ESB). The ESB became the cornerstone of the SOA strategy and together they formed the strategy for modernizing legacy systems. Hence, SOA, as it was ultimately delivered, ended up being an expensive mapping exercise from legacy data structures and messages to a newly appointed business language, also called the canonical representation. In some cases, these new SOA services would derive these new business data structures by querying and massaging data from multiple legacy systems, while in other cases, new business logic would be made available via the bus expanding the ecosystem of available capabilities.

    With SOA, the canonical message became the product of innovation and, hence, ultimately its downfall. Perhaps unfairly so, but, SOA never fostered continued modernization of the legacy systems into re-platformed and redeveloped services. It was about exposing the systems of record, both data and process, for inclusion into business processes, facilitating minimal changes to the legacy systems all handled through intelligent pipes.

    While digital transformation may be a popular concept that every business is now chasing, SOA’s failure demonstrates that simply exposing the existing systems was not enough to become the agile business we strive to be. Indeed, the systems of record that are brittle, burdened with technical debt and developed in a monolithic fashion were already impairing businesses’ ability to compete long before Uber and Airbnb came into existence. The appearance of these businesses just increased the urgency to address the legacy issue.

    Enter microservices architectures. First, I’ll reiterate my favorite soapbox topic: Putting a legacy app inside a Docker container does not in and of itself define a microservice. A microservice follows specific tenets of design. One of these tenets—and one that is very relevant to this discussion—is smart endpoints and dumb pipes. I find this design principle very interesting, considering what I’ve stated above about SOA. For me, it’s clearly a rebellion against SOA strategies.

    Also, I believe microservices approaches legacy modernization from a slightly different perspective. Microservices architectures by nature focus less on tooling (they’re polyglots by design) and more on the contextual bindings to business domains. Additionally, as someone eloquently stated on Twitter (which I cannot find now and so will paraphrase here), a microservice should be designed to be easily deleted without impacting the operations of the system. I believe the statement illustrates that a well-designed microservice isn’t intertwined with other services nor does it share intimacy of design.

    Some will debate—present company included—that this is what SOA was supposed to deliver. Unfortunately, this was not how it got implemented. So, this time we reduce the scope. Instead of a SOA service that represents the entire business domain, we deliver smaller, more well-focused entities representing subsets of the business domain. Subsequently, these services are designed to operate more independently, allowing them to better align with greater use of agile techniques.

    In microservices, architecture agility is the product of innovation. Ultimately, the improvements in speed, cost and quality are why microservices will succeed where SOA has failed.

    — JP Morgenthal

  • Microservice Usage at Honeycomb

    Microservice Usage at Honeycomb

    I recently joined Honeycomb, an observability startup where we are working to help generalist software engineers solve problems with their apps in an increasingly distributed world. The architecture we use to deliver our product can be described as using microservices, but interestingly, to use microservices specifically was not a deliberate design choice. It was instead the result of various factors that are becoming increasingly common in today’s world:

    1. The desire of software engineers to be involved with infrastructure and vice versa
    2. The desire for increased visibility and debuggability (monoliths make it hard to pinpoint issues)
    3. DevOps tooling is now mature enough to offload some operational burden onto

    In this article we’ll take a peek behind the scenes at the systems that power Honeycomb. I’ll focus on what our implementation looks like here, but for a general summary of microservices, feel free to peruse the Microservices Journal overview.

    Why Microservices?

    Some teams start with a “monolith” and split that into separate services over time, but due to a variety of incidental factors the architecture at Honeycomb leaned toward microservices from day one. For instance, the team consisted of strong operational experts, so the infrastructure challenge to implement them was not quite as intimidating in our case. Having experienced the pitfalls of monoliths in previous roles, the team was strongly inclined toward splitting programs out by functionality from the beginning. This allowed us to avoid conflating things such as traditional SaaS app logic and the unique data layer of Honeycomb.

    Before we dive in to architecture details, here is a quick summary of the basic functionality of Honeycomb:

    1. Honeycomb ingests “events,” structured as JSON, which describe some happening worth tracking. (e.g.: A user made an HTTP request to our app).
    2. Honeycomb stores these events on the backend for later querying.
    3. Users can execute queries to gain insight into their (usually production) systems by accessing our web app.

    This type of app has several pieces that do not obviously suggest at first glance whether they should be rolled into one program or split into several. Splitting the functions out has operational challenges, but can provide a lot of benefits for things such as scaling and debugging. Because Honeycomb’s founders and early employees were a world-class ops team who cut their teeth running systems at Linden Labs, Parse, Facebook and elsewhere, the operational challenge of running these as separate components in a distributed system was not as intimidating as it might be to more junior admins.

    Another important consideration in splitting these out was that, to handle this expected large influx of event traffic, we were driven to design a system that leans heavily on a pivotal piece of third-party technology: Apache Kafka.

    Kafka is a tool for publishing and receiving “messages” from one instance of a program to another more safely. For instance, consider two programs running on separate computers that wish to communicate: If one program makes a request and fails to reach the other computer, the other has no way to know if the message failed to send, or no message was sent in the first place. This can cause all sorts of problems in real production systems. An in-between “broker” program can help fix this and encode logic to handle failures and ensure message delivery.

    Due to using Kafka as a middleman, splitting out the “sending messages” (ingesting events) and “receiving messages” (storing them for later querying) became much easier to separate into distinct components. Let’s take a look at the specific services Honeycomb uses to get a feel for that.

    A Peek Into Honeycomb

    Honeycomb used to be a company called Hound, so all of Honeycomb’s microservices are named with a dog theme. (Curiously, our actual office dog is named after a famous movie dinosaur named after yet another animal—”Ducky”).  Most of them are written in Golang, but there is at least one written in NodeJS because it was a better fit. This is a noteworthy advantage of microservices: You can use the right tool for the right job more easily, albeit at the cost of additional operational complexity.

    As mentioned above, there is a service which receives events (JSON payloads) in the first place. This service is called Shepherd. Shepherd sits behind the endpoint api.honeycomb.io and serves a variety of functions which are somewhat unique to fronting an API. For instance, rate limiting is handled by Shepherd so that a client sending us a huge burst of events does not cause problems for other customers. Shepherd will also handle business logic around things such as event schema (e.g., updating your dataset’s metadata if a new field has been received) and will hand the received events off to Kafka for storage.

    When events hit Kafka, they are received by a process called Retriever, which is our persistent storage engine. Kafka lends itself well to being an intermediary in this split-up use case because even if Retriever is offline for a while (due to a deploy, panic, etc.), events simply accumulate in the backlog and remain available for later processing. This provides a lovely amount of resiliency to the Honeycomb service.

    When Retriever receives events it writes them to disk in the proper location for later querying. Retriever serves as both the writer and reader of persisted event information. Thus, when we want to execute a query of the user events, our front-end web application called Poodle (which is what backs ui.honeycomb.io) calls Retriever directly. Retriever’s stateful and distributed nature makes it more likely to be fickle and troublesome to debug than some of the other pieces, so having it split into its own service is extremely useful for debugging and maintenance. Since Honeycomb deploys multiple times per day, it can become tricky to identify the source of issues (although it’s worth noting that we also have our own separate “dog food” Honeycomb cluster to debug Honeycomb with Honeycomb!).

    If everything were mashed together into one binary, identifying performance issues (such as processes dying due to being out of memory) would be a nightmare. Any piece of the app might have an effect on any other piece of the app. All hope of doing things such as using an appropriate AWS instance type (for instance, one with faster disks) depending on the service would be dashed. But by having our architecture split into several component pieces, we can address these needs and more.

    We also have at least two more services that slot in nicely: A service called Doodle, written in NodeJS, which makes pretty pre-rendered pictures of queries for posting flattened images in Slack. Another is called Basset and works to supervise Triggers, which tip users off when the value returned by a query of interest changes.

    How Honeycomb Uses Honeycomb

    One interesting aspect about Honeycomb’s architecture is that it happens to be exactly the type of system that benefits strongly from being observed and debugged using the user-facing Honeycomb product! However, we cannot send events from our production website to itself, since this could potentially result in nasty feedback loops and unsolvable problems. Therefore, we created another “dog food” (as in eat your own dog food) cluster that we use to maintain the health of our production cluster.

    For instance, in one case we were alerted that an end-to-end check we use to ensure the quality of our site was failing. Events which were being written to Shepherd could not successfully be read back later by Retriever/Poodle. Using a Honeycomb Break Down (similar to a SQL GROUP BY) in our dogfood cluster, we were able to group the events we attempted to write based on the data partition they were meant to be written to and by whether or not they succeeded (shown below).

    This allowed us to quickly identify that a particular instance of our data partitions (of which there are many) was the one having issues without having to dig through a mountain of logs or staring bleary-eyed at a pile of pre-aggregated metrics wishing that we had access to more information. From this discovery we were able to compare other metrics such as API latency and write latency and deduced that the problem seemed to be within Kafka itself rather than in our systems surrounding it. Our dogfood cluster allows us to gain the benefits of using Honeycomb to debug a distributed system to debug Honeycomb itself, a complex application with many moving parts and microservices.

    If you are interested in more details of our dogfood cluster, we have a series of blog posts explaining our setup.

    Conclusion

    We hope this article gave you a peek at what a microservices world looks like. There are, of course, tradeoffs with any architecture, but we have been quite satisfied with our choices so far.

    Please reach out to us at support@honeycomb.io if you have any questions! Honeycomb is a tool designed to help with debugging in a distributed world, so we’re happy to help. We also have a free trial available if you are interested in signing up.

    — Nathan LeClaire

  • Sharding for Scale: Architecture Matters

    Sharding for Scale: Architecture Matters

    In the days of monolithic applications, scale was simple. As every instance of the app was the same, it really didn’t matter which one processed a request, as long as it was processed. On the back end, a single, ginormous data store held everything. This model ran into serious issues as apps migrated to the web and APIs introduced even more users. The ability of the database to scale efficiently without impacting performance became a serious issue.

    A microservices-based architecture, on the other hand, is far from simple. Not only are there more moving pieces to track, but our understanding of scalability has matured and morphed under the staggering weight of the increased use of apps and APIs over the past decade. Some of those moving pieces are intimately tied to the decentralization of data, which is no longer monolithic, either, and so the microservices responsible for interacting with that data are impacted by these new data models.

    Sharding was introduced before microservices existed. The premise was simple and based in part on the foundations of load balancing: Distribute the load. Data stores were split up and given responsibility for only a subset of data. This made them more efficient and faster, which in turn benefited everyone.

    As microservices have become more prevalent to improve development velocity and agility, they also have introduced new variables into the sharding equation. It’s no longer a matter of just sharding the data; it’s now a matter of how to distribute the responsibility for sharding throughout the architecture.

    The way in which you design your microservices—your decomposition strategy, if you will—to handle sharding has a serious impact on how ultimately you scale the services. It’s no longer just a matter of tossing a load balancer in front and praying for the best.

    Sharding Decisions

    The Scale Cube, as defined by the most excellent book, “The Art of Scalability,” provides some guidance on architecting for scale. Of particular note are Y- and Z-axis scaling.

    In Y-axis scaling, applications are decomposed into individual services, each responsible for a single or closely related set of functions. This allows each to scale independently. It is well-suited for microservices, obviously.

    With Z-axis scaling, the focus is on scaling by cloning. That is, multiple copies of the same service are horizontally scaled to increase capacity. The kicker is that each of those copies is responsible only for a subset of requests or data. It is most often used to scale databases (sharding) but it also can be beneficial for scaling based on location or another identifiable user-based attribute. Two of the most pressing challenges with a Z-axis-based architecture is granularity of the shard definitions—too fine, and you waste a lot of resources. Too broad, and you risk running into performance and scale issues if you succeed and grow.

    Best practices today are to employ some sort of data sharding. So, the question is not whether you will shard your data; it is, what piece of your architecture will be responsible for managing it?

    There are primarily two options: shard at the microservice layer or at the data layer.

    Sharding at the Service Layer

    Sharding at the microservice layer takes advantage of a Y-axis scale pattern. It assumes there are services designated for handling a subset of requests. This pattern requires an upstream decision point capable of inspecting requests and determining how to route them. This means data must be sharded on some identifiable variable carried within either the HTTP headers (preferable) or within the payload (data) itself.

    Architecturally, there are a number of ways of scaling this pattern. The simplest is to use a single, smart ingress “router” to both route and scale at the same time. The more complex way is to use an ingress router to route requests to load balancers that scale each service individually.

    It is important to note that containerized environments—popular for deploying microservices—operate primarily on the more complex pattern. A single ingress controller acts as the decision point, with either native or plugged-in load balancers distributing requests across the nodes that comprise the service.

    Sharding at the Data Layer

    Sharding at the data layer is easier on the overall architecture, but couples microservice code to your sharding strategy more tightly. This is because the services take on the responsibility of routing and must implement the sharding strategy. Any microservice can accept any request. The microservice then determines which data store is appropriate, given the relevant variables.

    This pattern relieves complexity on the ingress as there’s no real need to do anything but distribute the load across available microservices. It does, however, increase network complexity on the back end between the service and data tiers, as every service must be able to communicate with every data store.

    Depending on your implementation, this can require more networking assistance to ensure optimal performance and routing.

    This pattern also puts more stress on the data stores, as they are required to communicate with every instance of the microservice. Depending on your language of choice, this can have unintended consequences on capacity and performance as the database connection pool becomes the primary bottleneck in scaling.

    Shard Smartly

    There is no single “best” answer for how you should shard data when adopting a microservices architecture. There are pros and cons to both, and each method has consequences. Understand the impacts—not just on the microservice architecture but on the overall architecture, including scale. As scale has become a must-have rather than a nice-to-have capability, it’s important to understand the impact of application architectural choices on that function.

    Shard on. Scale smart.

    — Lori MacVittie

  • How to build 12-factor microservices applications on AWS with Containers

    How to build 12-factor microservices applications on AWS with Containers

    If you are developing software in 2017, chances are you are looking at microservices-based architectures. Microservices is an approach to application development in which a large application is built as a suite of modular services. Containers are a natural fit because of the isolation and packaging they provide. Containers further enable speed, resource density, flexibility and portability.

    To get the benefits of containers and microservices, look to a methodology known as the 12-factor app, a popular methodology for building “software-as-a-service apps that:

    • Use declarative formats for setup automation;
    • Have a clean contract with the underlying operating system, offering maximum portability between execution environments;
    • Are suitable for deployment on modern cloud platforms;
    • Minimize divergence between development and production, enabling continuous deployment for maximum agility;
    • And can scale up without significant changes to tooling, architecture, or development practices.”

    In this article, we will highlight implementing the paradigms stated for deploying application in containers using AWS primitives.

    Developing Microservices

    An effective way to achieve a clean contract in the system is by defining the boundaries for services is specific to your application’s design. The microservices define a clean contract in the application layer. The microservice can be tracked in a version control system such as Git or AWS CodeCommit, a fully managed source control service that makes it easy for companies to host secure and highly scalable private Git repositories, as an alternative to GitHub.

    Isolation of crashes, isolation for security and independent scaling all need to be considered. Containers wrap application code in a unit of deployment that captures a snapshot of the code as well as its dependencies, thus extending portability. Microservices architecture inherently grant that if one micro piece of your service is crashing, only that part of your service will go down.

    Docker provides the packaging of operating system, application and dependencies thus enabling portability. Running many Docker containers at scale is a hard problem of the order of O(n2). Amazon EC2 Container Service (ECS) is a highly scalable, high-performance container management service that supports Docker containers and enables Docker-based applications on a managed cluster of Amazon EC2 instances. Amazon ECS eliminates the need to install, operate and scale cluster management infrastructure, enabling a highly concurrent environment.

    There are multiple container orchestration platforms that do a good job of running containers at scale, but managing them on the platform itself is a challenge. This requires the user to spend considerable time on operating the platform instead of focusing on the application.

    While Docker enables clean packaging of software, the application should be written to be consistent across environments; environment dependencies should be removed from the code to enhance disposability.

    Parameter Store, a feature of Amazon EC2 Systems Manager, provides a centralized, encrypted store for sensitive information such as secrets and configuration. The service is fully managed, highly available and highly secure. Parameter Store is accessible using the Systems Manager API, AWS CLI and AWS SDKs. Secrets can be easily rotated and revoked. Parameter Store is integrated with AWS KMS so specific parameters can be encrypted at rest with the default or custom KMS key. Importing KMS keys enables you to use your own keys to encrypt sensitive data.
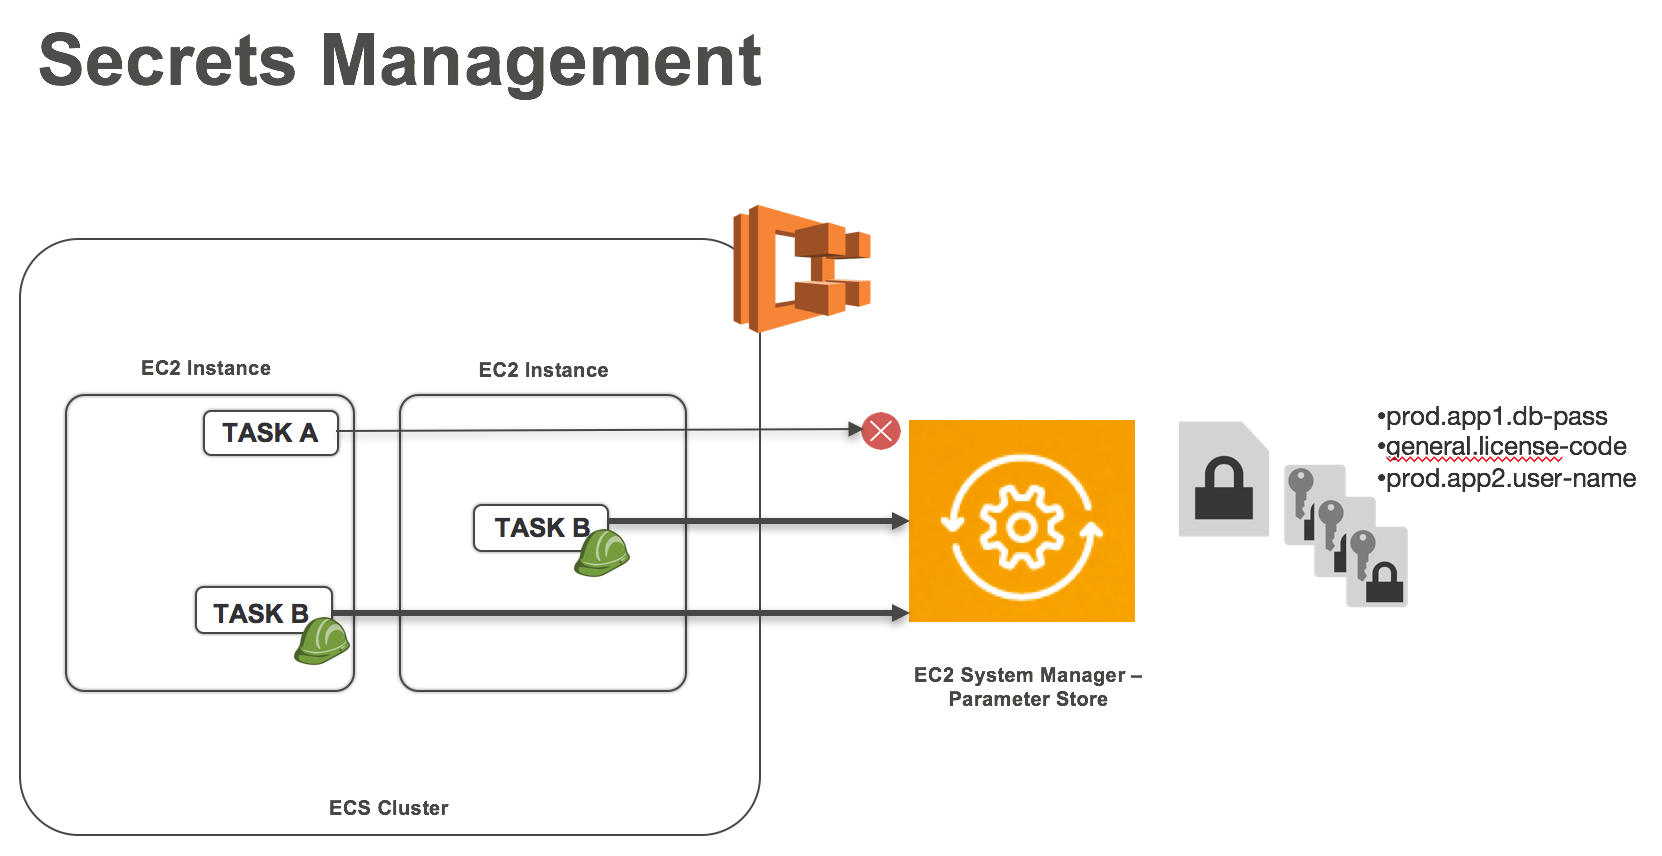
    Figure 1: Storing Container Secrets in parameter store

    Access to Parameter Store can be controlled by IAM policies and supports resource level permissions for access. An IAM policy that grants permissions to specific parameters or a namespace can be used to limit access to these parameters. CloudTrail logs, if enabled for the service, record any attempt to access a parameter. Containers deployed on Amazon EC2 Container Service (ECS), which provides orchestration for your containers, can access these secrets from the parameter store.

    Amazon EC2 Container Service allows you to lock down access to AWS resources by giving each service its own IAM role.

    Scalability

    An ECS service can be configured to use service autoscaling to adjust its desired count up or down in response to CloudWatch alarms. Autoscaling gives an effective usage of the compute resources. Amazon ECS publishes CloudWatch metrics with the service’s average CPU and memory usage. These service utilization metrics can be used to scale the service up to deal with high demand at peak times and to scale the service down to reduce costs during periods of low utilization.

    As services scale and run multiple applications on an ECS cluster, dynamic port-mapping becomes essential. Application Load Balancer offers a high-performance load balancing option that operates at the application layer and allows to define routing rules based on content. With Application Load Balancer, you can specify a dynamic host port to give your container an unused port when it is scheduled on an EC2 instance. The ECS scheduler will automatically add the task to the Application Load Balancer using this port.

    Using AWS CloudFormation gives developers and systems administrators an easy way to create and manage a collection of related AWS resources such as Application Load Balancer, ECS Clusters, VPC, service definitions and task definitions.

    As described above, using a secret management store such as the Parameter Store allows for the application to be executed in the execution environment as one or more processes. The services are stateless, share nothing and rely on a stateful backing service to persist data.

    The services can rely on backing services such as data stores (Amazon RDS, DynamoDB, S3, EFS and RedShift), messaging/queueing system (SNS/SQS, Kinesis), SMTP services (SES) and caching systems (Elasticache). The code for a 12-factor app makes no distinction between local and third-party services.

    Fig 2: An example microservices deployment on AWS.


    Continuous Deployment

    Delivering new iterations of software at a high velocity is a competitive advantage in today’s business environment. The speed at which organizations can deliver innovations to customers and adapt to changing markets is increasingly a pivotal attribute that can make the difference between success and failure.

    Continuous deployment enables developers to ship features and fixes through an entirely automated software release process. Instead of batching up large releases over a period of weeks or months and conducting deployments manually, developers can use automation to deliver versions of their applications many times a day as new software revisions are ready for users. In the same way cloud computing abbreviates the delivery time of resources, continuous deployment reduces the release cycle of new software to your users from weeks or months to minutes. Various techniques such as rolling updates, blue-green and canary deployments can be used to enable a continuous delivery pipeline.

    Updating a service in Amazon ECS is enabled at the scheduler level. A running service can be updated to change the number of tasks that are maintained by a service or which task definition is used by the tasks. When the service scheduler replaces a task during an update, if a load balancer is used by the service, the service first removes the task from the load balancer and waits for the connections to drain. AWS provides AWS CodeCommit, CodePipeline and CodeBuild to enable an efficient continuous delivery pipeline. The below reference architecture illustrates such a pipeline.

    Fig 3: Continuous Delivery and Deployment

    In the above reference architecture, the developer commits code into a CodeCommit, which triggers a CodePipeline. The CodePipeline branches into provisioning the infrastructure using AWS CloudFormation and builds a Docker image using CodeBuild. CodeBuild builds the Docker image and pushes it to ECR, while CloudFormation has deployed the ECS cluster. The ECS service, which is in autoscaling mode, picks the image and deploys. The same workflow works for updates, with the added step of an update stack. With update stack, the delta change is understood by CloudFormation and the update service replaces the containers with the new image.

    Blue/green deployments are a type of immutable deployment that help you deploy software updates with less risk. The risk is reduced by creating separate environments for the current running or “blue” version of your application, and the new or “green” version of your application. This type of deployment gives you an opportunity to test features in the green environment without impacting the current running version of your application. When you’re satisfied that the green version is working properly, you can gradually reroute the traffic from the old blue environment to the new green environment by modifying DNS. By following this method, you can update and roll back features with near zero downtime.

    Fig 4. Implementing Blue Green with ECS

    As demonstrated in the above reference architecture, a target group and path-based routing at the application load balancer could be used to direct traffic from the ALB to a blue (live) service and a green (test) service. Once the testing is completed, the target groups could be switched to redirect all live traffic to the green (live) service and all internal traffic to blue (deprecated) service.

    Canary release is a technique to reduce the risk of introducing a new software version in production by slowly rolling out the change to a small subset of users before rolling it out to the entire infrastructure and making it available to everybody.

    Fig 5. Implementing Canary deployment for Containers on AWS

    In the above reference architecture, a container can emit CloudWatch events that can be used to determine whether to increase the flow of traffic. When a container specifies it can take more traffic, the Amazon R53 weighted routing can increase the traffic to the application load balancer and thus to the container. As canaries proliferate, maintaining the state of each canary is important for rollback and deployment. DynamoDB and a lambda filter allows the state to be stored in the pipeline based on CloudWatch events. AWS Step Function helps coordinate the components of the pipeline using visual workflows.

    Another consideration is that the development, staging and productions system should be as similar as possible. By setting up an efficient deployment pipeline this can be achieved. The environment from an operational and a development perspective should be closely aligned in terms of the operating system, Docker version, shared libraries and microservices deployed.

    Developers can also run one-off admin processes as a task, in an identical environment as the regular long-running processes of the app. They run against a release, using the same codebase and configuration as any process run against that release. Admin code can be shipped with application code to avoid synchronization issues.

    Monitoring and Governance

    Application logs are useful for many reasons. They are the primary source of troubleshooting information. In the field of security, they are essential to forensics. Web server logs are often leveraged for analysis (at scale) to gain insight into usage, audience and trends. A 12-factor app never concerns itself with routing or storage of its output stream. Streaming logs collected from the output streams of all running processes and backing services to centralized logging such as AWS CloudWatch. Amazon ECS provides a logdriver on the task definition that ships streams logs to CloudWatch.

    Centralized logging has several benefits: Amazon EC2 instance’s disk space isn’t being consumed by logs and log services often include additional capabilities that are useful for operations. For example, CloudWatch Logs includes the ability to create metrics filters that can alarm when there are too many errors and integrates with Amazon Elasticsearch Service and Kibana to enable you to perform powerful queries and analysis.

    While debugging issues, tracing and troubleshooting is an important aspect. The AWS X-Ray daemon is a software application that gathers raw segment data and relays it to the AWS X-Ray API. The daemon works in conjunction with the AWS X-Ray SDKs and must be running so that data sent by the SDKs can reach the X-Ray service. You can easily run AWS X-Ray as a daemon on a ECS cluster to enable tracing of the containers.

    Governance is a key aspect of software design and development. Maintaining a consistent style and standard along with operation SLA is paramount to enterprise deployments. SLAs around security, recovery time objective and recovery point objective must be considered. AWS Service Catalog could be used for listing microservices stacks in a catalog, with access control and notifications mechanism.

    Conclusion

    With AWS primitives, you can utilize the 12-factor app pattern to achieve scalable, fault-tolerant and highly available microservices with continuous deployment. You can find further resources at: https://aws.amazon.com/ecs/getting-started/ and https://aws.amazon.com/ecs/resources/

    Arun Gupta is a Principal Open Source Technologist at Amazon Web Services. He has built and led developer communities for 12+ years at Sun, Oracle, Red Hat and Couchbase. He has deep expertise in leading cross-functional teams to develop and execute strategy, planning and execution of content, marketing campaigns, and programs. Prior to that he led engineering teams at Sun and is a founding member of the Java EE team. He has extensive speaking experience in more than 40 countries on myriad topics and is a JavaOne Rock Star for four years in a row. Gupta also founded the Devoxx4Kids chapter in the US and continues to promote technology education among children. A prolific blogger, author of several books, an avid runner, a globe trotter, a Docker Captain, a Java Champion, a JUG leader, NetBeans Dream Team member.

    Asif Khan is a Tech leader with Amazon Web Services. He provides technical guidance, design advice and thought leadership to some of the largest and successful AWS customers and partners on the planet. His deepest expertise spans application architecture, containers, devops, security, machine learning and SaaS business applications. Over the last 12 years, he’s brought an intense customer focus to challenging and deeply technical roles in multiple industries. He has a number of patents and has successfully led product development, architecture and customer engagements.


    — Asif Khan

  • Continuous Deployment and Monitoring of Microservices

    Continuous Deployment and Monitoring of Microservices

    Continuous deployment and continuous monitoring have grown up in DevOps, and microservices have grown up as a delivery platform. While all are relatively stable concepts at this point, there are still a fair number of practitioners that are struggling with the merging of these concepts to create a holistic environment that allows for deep understanding and easy deployments.

    So I thought we could take a look at what’s out there, how it’s going, and even mention a resource or two for you.

    Continuous Deployment

    While continuous delivery (CD) and continuous integration (CI) are well in hand, continuous deployment has lagged a bit behind. There are reasons—both good and bad—why this is true, but true it is. Continuous deployment is the act of actually deploying the results of the CI/CD cycle. The whole point of continuous deployment is to speed the release of new features to market by releasing them as soon as they pass the CI/CD muster, or soon after, or for some industries, on demand. Continuous delivery is a little different from CI/CD in that the rest of the organization—sales, support, marketing, accounting, etc.—have to be ready for the release, so in the slowest case, the point is that IT is not the hold-up to releasing new features under the continuous deployment model.

    Microservices

    Simply put, microservices are decomposition of an application into smaller parts that can be run independently. There are a lot of different ideas for what “smaller parts” means, with some shops breaking their application down to the functional level similar to serverless functions, so an API named calculateSalesTax would do that and only that, given location and dollar information, while others prefer a more broad definition that includes entire groupings of APIs. In this scenario, one company split all database work into a single microservice that was scalable. Either way, you will have more instances (normally containers, but sometimes VMs or even physical servers) running to build the application than historically would be the case.

    Why Containers

    As mentioned above, normally a microservices architecture is built on containers. The portability of a container definition is one of the major reasons why companies lean this direction. The ability to say, “This container can run on our hardware, on our private cloud, on a public cloud, in a public cloud VPC or on a VM,” is a way to ensure that you can target the system to the environment most suited to the organization’s needs.

    Containers are also far lighter than VMs, meaning faster spin-up times, and an easier time expanding the microservices architecture to meet changing user needs.

    Container Management

    Speaking of containers, container management systems are used to make certain that containers are alive and responding. In advanced cases, they can be made to check that a container is doing what it is supposed to do also. While I am a fan of Apache Mesos, the world seems to have gone for Kubernetes, so we’ll focus on it, without further reference to the others out there.

    On top of making certain the correct number of a given container are running, and taking steps to spin up new ones if one disappears, Kubernetes does things such as manage secrets for containers, perform load balancing between instances in a group (these groups are generally called a service in container management speak), scaling up/down of instances as directed, and provide rolling updates to services so the service is not down while being updated.

    This makes a container management tool an important part of any continuous delivery and continuous monitoring effort.

    Taken together

    That gives us tools including Jenkins for CI and CD, and often for release management, though other tools specialize in the release portion, too. Combine Jenkins with an infrastructure-as-code solution such as Teraform or any of the others we’ve discussed in the past. Add in a tool such as Prometheus for gathering monitoring data, and a tool such as Grafana for visualizing the data, and you’re on the road to continuous delivery and continuous monitoring.

    Of course, it isn’t that simple, I’m overviewing here. While researching this blog, the people at Infostretch shared some information with me, and they too would see this as the 50,000-foot view. But that’s where we start. For a more complete picture, here is a simple diagram of continuous deployment that Infostretch shared with me:

    And as long as we’re discussing the information that Infostretch shared with me, let’s also look at a sample of what the company monitors. You’ll see it isn’t “everything under the sun,” but focused points that give them actionable intelligence. A few application-specific monitoring points from within the application, and this turns into an application performance gold mine.

    Classification Metrics
    Cluster Metrics Overall Cluster Memory Utilization
    Overall Cluster CPU Utilization
    Overall Cluster FS Utilization
    Multi-series graph for individual service CPU Utilization
    Multi-series graph for individual service Memory Utilization
    Multi-series graph for individual service FS Utilization
    Application Metrics


    Service Request rate
    Service Error rate
    Service latency

    There is so much more

    There really simply isn’t enough room in a single blog to cover all that is required and possible in continuous delivery and continuous monitoring. I’ll continue to try continuous blogging to help you out, and the other authors here on devopsy.kinsta.cloud have good things to share on the topics also.

    — Don Macvittie

  • DevOps: Time for Developers to Dig In

    DevOps: Time for Developers to Dig In

     Speaking to developers and project managers at the Gartner Catalyst Show, Jenkins World and Atlassian Summit revealed some insights about how most IT specialist perceive DevOps. Yes, I had a busy end of summer schedule attending events and talking to a wide range of developers and project managers about DevOps.

    two dogs digging together in one hole in the ground

    What I learned is that most people have not yet figured out what is meant by DevOps. What most people told me is that they are doing DevOps explaining they have a CI/CD pipeline. When questioned further about how they perceived DevOps, they believed DevOps was about creating a CI workflow that developers and sometime-testing teams could execute to automate builds, deploys and testing. One of the most ironic of these conversations was project managers making the claim that their CI server performed builds and deploys.

    Well folks, DevOps is not about a CI/CD pipeline. And contrary to popular beliefs, your CI server does not perform builds and deploys any more than it performs automated testing. Your CI/CD pipeline orchestrates build and deploy processes in the same way that it executes an external tool for test automation. The ugly truth is that your CI/CD pipeline is executing one-off build and deploy scripts, the same scripts used in your waterfall practice, but just triggered by your CI/CD process. These scripts cannot easily adapt across the continuous delivery pipeline. Testing and production environments are configured differently. The build and deploy scripts must be tweaked, maintained and debugged in the same way they were during waterfall practices. Once ready, they are then called by your CI/CD workflows. DevOps is different.

    DevOps demands that your developers and operation teams share and collaborate from the earliest phases of a project. In essence, this requires that more of the operational duties be shifted left and directly onto the shoulders of developers. This is precisely were the responsibility and control should be. Operation teams need knowledge and transparency so they can communicate infrastructure requirements early and often to the developers. Eventually what we will see is a decline in the number of operational resources. A “release engineer” who managed production deployments said, “If we define our DevOps process correctly, my job will not exist in the future. Instead, automation will replace the manual Ops scripts, allowing Dev teams to do 70 percent of my work.” And that, my friend, is real DevOps.

    Developers, Dig In

    So it is time for developers to really dig in to DevOps. What I mean is developers must begin walking away from automating most of the processes by a one-off script and begin incorporating tools that perform DevOps tasks from continuous deployment, security scanning and performance monitoring. And different platforms need different tools. Project teams will need the power to select the tools that work for them. The days of “legacy” purchases of a single tool for the enterprise is long gone. High-dollar operational tools are high-risk and incur technical debt when developers choose to use a different solution. DevOps means giving development teams more control and purchasing authority for automation tools that can be managed at a project level, not an enterprise level. These tools must support a process where the developers work on the declarations followed by testing and production consuming the process with a good amount of transparency. Scripts cannot achieve this, even when triggered by CI.

    Our future is becoming more and more complex. Most companies I spoke to still managed over 70 percent of monolithic applications. The writing on the wall is in the 30 percent. With microservices and containers, operational tasks are going to become more complex, not less. The sooner developers can become the core owners of operational tasks, the easier it will be to adopt a microservices architecture. Managing microservices will not be the job for the operations team. It will need to be done by the developers who have the intimate knowledge of their application.

    To mature from CI/CD to DevOps is going to require a close look at the engine under your CI/CD hood. When developers and project managers begin to really dig in and see how the engine is running, it will be clear that achieving DevOps is a bit down the road. And there is urgency in this process. Leaner and better ways of writing and releasing code is upon us. Most of us are just not ready to toss out some of the old habits from waterfall practices to get there.

    Some departing thoughts:

    • Acknowledge that CI/CD is a good place to be, it is just not DevOps.
    • Look carefully at your underlying processes that are called by CI/CD. How well do they support your production environment?
    • Can your CI/CD workflow at Dev support a production deploy? If not take the time to understand why.
    • Are your developers working late to get a code update to production?
    • Do you have a clear continuous feedback loop that shows where a code update is running, and on what exact endpoints?
    • Do your developers know what infrastructure updates are going on in production today?
    • How do your developers communicate infrastructure updates to production teams? Can they do it alone?

    The time is now for self-examination and a clear honest appraisal of just how automated your core operational tasks are. If they are built upon one-off scripts, you should assume you have some work ahead to really begin moving to a DevOps practice that can be declared by developers, consumed by all runtime environments and is transparent to all.

    And remember, microservices are chasing you.

    About the Author / Tracy Ragan

    Tracy Ragan is COO and Co-Founder, DeployHub. She has extensive experience in the development and implementation of business applications. It was during her consulting experiences that Ms. Ragan recognized the lack of build and release management procedures for the distributed platform that had long been considered standard on the mainframe and UNIX.  In the four years leading to the creation of OpenMake Software she worked with development teams in implementing a team-centric standardized build to release process. Connect with her on LinkedIn.

  • One Team’s Microservices Journey and CD Growth

    One Team’s Microservices Journey and CD Growth

    Dev Manager Vadim Madison published a chronicle of his team’s move from a monolithic application to a microservices model. In the process, the tools and methodologies they used for continuous integration/continuous delivery (CI/CD) had to be expanded and even changed out in several stages. It’s a long read, but with the time, as there are not a lot of people documenting the case of full-on conversion.

    One of the more interesting pieces of his work is the software infrastructure they have to build up to cover CI/CD/monitoring of the application. This is a lot more complex than the original application was, and it all must be managed. One of the benefits of DevOps is to make management of these tools easier, and he does talk a bit about scripting it out and implementing APIs to take problem instances out of the pool and determine what went wrong so they can go through the Dev/CI/CD cycle again.

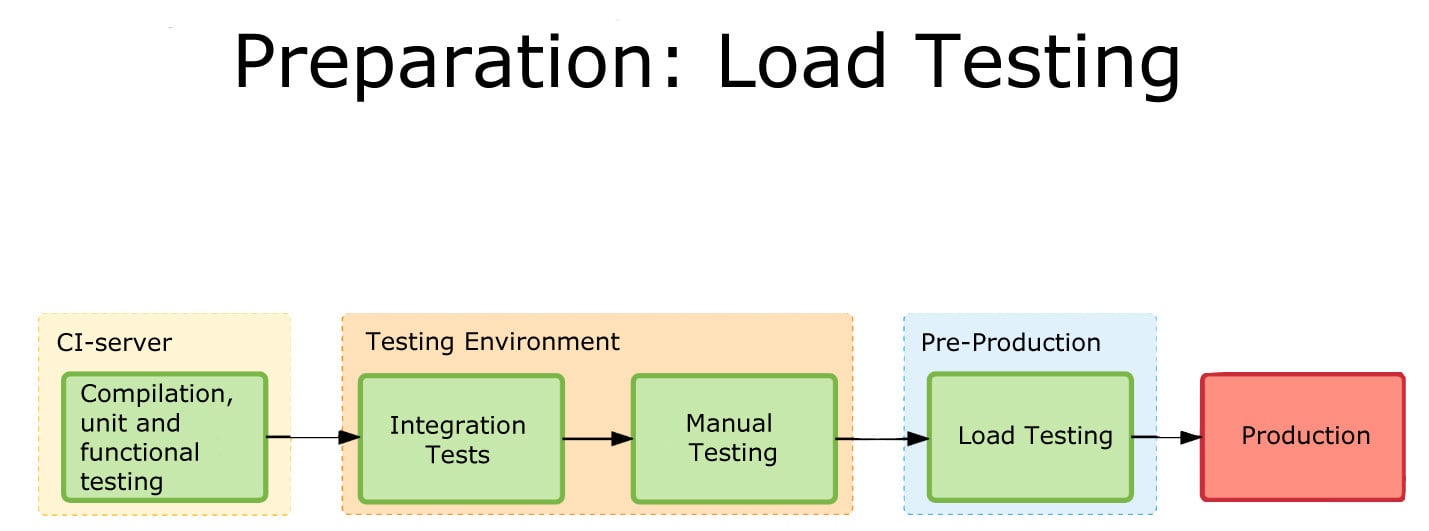
    Load Testing
    One of the graphics showing integration.

    What makes it interesting is where the team found limitations and switched tools midstream. This being a process, Madison at the end alluded to the fact that they have started eliminating TeamCity (or at least limiting what they’re using it for). I think that when most people begin to go high-rate DevOps, or even constant monitored low-rate DevOps, some of the items his team ran into escape their notice until they find an issue. The architectural growth will occur—you are automating more, building more, monitoring more and releasing more. The question is, how far ahead do you look? Until recently, the answer was pretty much, “Not far,” because we didn’t have cases like Madison’s to draw on and see parallels with what we were doing. But that is starting to change.

    CI/CD/ARA vendors can help, of course. Collectively they have a lot of knowledge about the lay of the land, and how people are using the tools to tackle the needs of new architectures. But more public documentation such as Madison’s would be great, too.

    Even though you’re moving at a much faster pace, looking ahead and increasing the steps taken in the CI/CD/ARA space can provide that added bit of resiliency, and monitoring at a level appropriate to your project’s maturity can add that extra bit of “we know, we can recover.” There have been some spectacular failures that were indicated by monitoring, but the volume of data flowing through monitoring was enough to mask it. Today, the best solution is to monitor at the appropriate level and then feed that monitoring back into the system.

    But you’ll be supporting more software infrastructure. The growth of tools is pretty inevitable: As you spread the functionality across machines/instances/containers, you will need to stretch CI/CD/ARA tools to multiple interrelated targets and monitor the overall system and its performance bottlenecks. And for now, the tools chosen will not always be widely known, so a process to bring new Dev/DevOps team members quickly up to speed on the more obscure tools should be on your list of to-dos.

    — Don Macvittie

  • From Monolith to Microservices – and Beyond!

    From Monolith to Microservices – and Beyond!

    Software application development and delivery often involves multiple development, infrastructure and operations teams, each with their own preferred “tools of the trade” for building, testing and deploying code changes

    For years, virtualization and cloud technologies have provided agile, on-demand infrastructure. The advent of Microservices promises even more agility– but what is required to take advantage of Microservices?

    Join Electric Cloud CTO Anders Wallgren and Trace3 Principal Consultant – DevOps Marc Hornbeek as they discuss what is required to:

    • Overcome culture and architecture challenges created when decomposing monolithic applications into Microservices-based applications.
    • Coordinate integration, testing, monitoring, packaging, release approval and deployment of Microservices-based applications over elastic infrastructures
    • Create a controlled and auditable delivery pipeline to support
      Microservices-based application.
    • Prepare for “future” applications, pipelines and patterns.

    RECORDING

    SLIDES

    [slideshare id=72784830&doc=microservicesandbeyondwebinarv2-jessica-170303190452]

    — Jules Louis

  • An Operational Approach to Benchmarking Microservices

    An Operational Approach to Benchmarking Microservices

    Benchmarking microservices often falls behind on the engineering team’s to-do list. However, those that aren’t are missing out on a key component. The fundamental goal of benchmarking is to better understand the software, and test out the effects of various optimization techniques for microservices. In this post, I’ll describe an effective approach to benchmarking microservices.

    First, create a spreadsheet for tracking your benchmarking. One convenient way to document a series of benchmarks is in a Google Spreadsheet. It allows collaboration and provides the necessary features to analyze and sum up your results. Structure your spreadsheet as follows:

    • Title page
      • Goals
      • Methodology
      • List of planned and completed experiments (evolving as you learn more)
      • Insights
    • Additional pages
      • Detailed benchmark results for various experiments

    Then, before you engage in benchmarking, clearly state (and document) your goal. Examples of goals are:

    • “I am trying to understand how input X affects metric Y”
    • “I am running experiments A, B and C to increase/decrease metric X”

    Next, pick one key metric, stating clearly which one metric you are concerned about and how the metric affects users of the system. If you choose to capture additional metrics for your test runs, ensure that the key metrics stands out.

    Now, you’re going to have to think like a scientist and perform a series of experiments to better understand which inputs affect your key metric and how. Consider and document the variables you devise and create a standard control set to compare against. Design your series of experiments in a fashion that leads to the understanding in the least amount of time and effort. You’ll then need to define a methodology for running your benchmarks. It is critical your benchmarks be:

    • Fairly fast (several minutes, ideally)
    • Reproducible in the exact same manner, even months later
    • Documented well enough so another person can repeat them and get identical results

    Document your methodology in detail. Also document how to re-create your environment. Include all details another person needs to know:

    • Versions used
    • Feature flags and other configuration
    • Instance types and any other environmental details

    In most cases, to accomplish repeatable, rapid-fire experiments, you need a synthetic load generation tool. Find out whether one already exists. If not, you may need to write one. Understand that load generation tools are at best an approximation of what is going on in production. The better the approximation, the more relevant the results you’re going to obtain. If you find yourself drawing insights from benchmarks that do not translate into production, revisit your load generation tool.

    It is then important to validate your benchmarking methodology, and repeat a baseline benchmark at least 10 times and calculate the standard deviation over the results. You can use the following spreadsheet formula:

    =STDEV(<range>)/AVERAGE(<range>)

    Format this number as a percentage, and you’ll see how big the relative variance in your result set is. Ideally, you want this value to be less than 10 percent. If your benchmarks have larger variance, revisit your methodology. You may need to tweak factors like:

    • Increase the duration of the tests.
    • Eliminate variance from the environments.
      • Ensure all benchmarks start in the same state (i.e. cold caches, freshly launched JVMs, etc).
      • Consider the effects of Hotspot/JITs.
    • Simplify/stub components and dependencies on other microservices that add variance but aren’t key to your benchmark.
      • Don’t be shy to make hacky code changes and push binaries you’d never ship to production.

    Important: Determine the number of results you need to get the standard deviation below a good threshold. Run each of your actual benchmarks at least that many times. Otherwise, your results may be too random.

    Now that you have developed a sound methodology, it’s time to gather data. Some tips include:

    • Only vary one input/knob/configuration setting at a time.
    • For every run of the benchmark, capture start and end time. This will help you correlate it to logs and metrics later.
    • If you’re unsure whether the input will actually affect your metric, try extreme values to confirm it’s worth running a series.
    • Script the execution of the benchmarks and collection of metrics.
    • Interleave your benchmarks to make sure what you’re observing aren’t slow changes in your test environment. Instead of running AAAABBBBCCCC, run ABCABCABCABC.

    Now, you’ll need to create enough loads to be able to measure a difference. There are two different strategies for generating load:

    1. Redline it! In most cases, you want to ensure you’re creating enough load to saturate your component. If you do not manage to accomplish that, how would you see that you increased its throughput? If your component falls apart at redline (i.e. OOMs, throughput drops, or otherwise spirals out of control), understand why, and fix the problem.
    2. Measure machine resources. In cases where you cannot redline the component, or you have reason to believe it behaves substantially different in less-than-100-percent-load situations, you may need to resort to OS metrics such as CPU utilization and IOPS to determine whether you’ve made a change. Make sure your load is large enough for changes to be visible. If your load causes 3 percent CPU utilization, a 50 percent improvement in performance will be lost in the noise. Try different amounts of load and find a sweet spot, where your OS metric measurement is sensitive enough.

    As you execute your benchmarks and develop a better understanding of the system, you are likely to discover new factors that may impact your key metric. Add new experiments to your list and prioritize them over the previous ones if needed.

    In some instances, the code may not have configuration or control knobs for the inputs you want to vary. Find the fastest way to change the input, even if it means hacking the code, commenting out sections or otherwise manipulating the code in ways that wouldn’t be “kosher” for merges into master. Remember: The goal here is to get answers as quickly as possible, not to write production-quality code—that comes later, once we have our answers.

    Once you’ve completed a series of benchmarks, take a step back and think about what the data is telling you about the system you’re benchmarking. Document your insights and how the data backs them up. It may be helpful to:

    • Calculate the average for each series of benchmarks you ran and to use that to calculate the difference (in percent) between series — i.e. “when I doubled the number of threads, QPS increased by 23 percent on average.”
    • Graph your results — is the relationship between your input and the performance metric linear? Logarithmic? Bell curve?

    Finally, you’ll need to present your insights. Here are some final tips for exhibiting to management and/or other engineering teams:

    • Apply the Pyramid Principle. Engineers often make the mistake of explaining methodology, results and concluding with the insights. It is preferable to reverse the order and start with the insight. Then, if needed/requested, explain methodology and how the data supports your insight.
    • Omit nitty-gritty details of any experiments that didn’t lead to interesting insights.
    • Avoid jargon, and if you cannot, explain it. Don’t assume your audience knows the jargon.
    • Make sure your graphs have meaningful, human-readable units.
    • Make sure your graphs can be read when projected onto a screen or TV.

    — Stefan Zier

  • The devopsy.kinsta.cloud Containerization and Microservices Survival Guide

    The devopsy.kinsta.cloud Containerization and Microservices Survival Guide

    Containerization and microservices seemed to have leaped out of nowhere and smack into the center of the enterprise IT scene. But neither leaped from nowhere. Both containerization and microservices have been part of the fabric of enterprise tech for some time—within Linux for containers and service-oriented architecture for microservices.

    Largely, thanks to containerization, both now are moving quickly to become central components of enterprise tech. Containers in recent years—and especially in recent months—have moved from tools used in development environments to production. And the ability to manage containers as discrete services is enabling enterprises to be able to respond quickly and be agile to technology demands.

    According to a recent survey from app performance vendor NGINX, of roughly 1,800 IT professionals, while container and microservices software adoption is limited it’s use is accelerating. The survey found that only 20 percent of respondents said they are using containers in production, while about one-third are doing the same for microservices.

    That survey, not surprisingly, indicated that microservices and container use will continue to accelerate, as roughly two-thirds of respondents said that they are currently evaluating containers and 70 percent microservices.

    Microservices are workloads that perform a single task and they are not dependent on the infrastructure or other applications for their ability to complete their designated task or “service.” Microservices are very effective at providing enterprises the ability to rapidly build software that solves business problems. They also make it possible for development teams to scale their efforts and build a more resilient architecture.

    With all of that in mind, and considering the nature of the inflection point most enterprises find themselves in now, we’ve assembled this microservices and containerization survival guide. The guide consists of some of the most important storage on microservices and container management that we’ve ran in the past year.

    DevOps Teams: Containers Will Help You Become Future Ready

    According to The State of Containers 2015 Docker Adoption Survey, more than 70 percent of respondents are either using Docker or evaluating for future use. Given the overwhelming popularity of containers, this post provides three trends that DevOps teams must be prepared for.

    7 Web Interfaces for Container Management and Orchestration

    Managing containers used to be a command-line affair. But a rich and growing ecosystem of web-based interfaces for containers has now emerged. This post provides an overview of the different web UIs available for container management and orchestration.

    ‘Containers-as-a-Service’ Is a Hot Trend

    Containers are still sort of the new kid on the IT block, but already containers-as-a-service is emerging as a thing. Here’s what you need to know.

    A Closer Look at Container Monitoring

    Enterprises have to ensure that all of their microservices perform well and provide their services as designed. Beyond that, how much do they really need to know about what’s going on inside their containers? The answer to this question varies. In this post Gerald Haydtner provides an overview for container-monitoring options.

    Containers: Not One to Rule Them All

    When it comes to the container platform ecosystem, not all container platforms are created equal. This post will help you sort through the options.

    Building Microservices: A Few Considerations

    An experienced practitioner details the top five design considerations when building microservices.

    5 Docker Best Practices You Should Follow

    Support for Docker has been integrated into many products and platforms and a lot of organizations are either already using Docker containers or trying to understand how to do so themselves. Our Tony Bradley provides the Docker best practices one needs to know to succeed.

    How to Choose a Cloud Platform for Containers

    Containerization has broadened from one or two vendors to a broader, more container-agnostic world and a drive to better scalability, redundancy, interoperability and security. Amazon, Google and Microsoft each have their own unique approach to addressing these cloud container concerns as they battle each other for supremacy. Here’s a look at how to evaluate each.

    Container Security: Why Bother?

    Are containers secure? Probably not. But knowing each approach’s strengths and risks—and available options—could help ease adoption.

    Container Security Challenges: Are Container Scanners Enough?

    How secure are containers? Not very, according to open source company Red Hat, which has published a blog post blasting the container ecosystem for lacking good security processes. Here’s a synopsis of what Red Hat has to say about container security, and some additional perspective.

    For Container Security, Automation Is Key

    Regardless of the IT infrastructure element in question, if it connects to a network—even through proxies or human intermediaries—eventually someone will find a security flaw and exploit it. Compatibility issues with new applications or infrastructure elements will emerge. Because of these reasons, all IT infrastructure elements need to be managed, without exception.

    Containers and Security Q&A: Putting a Lid on Risk

    How do containers affect security? And how can IT teams do everything they need to do in order to ensure the containers in use are as secure as they reasonably can be?

    — George V. Hulme