Category: Features

  • 5 Mean-Time Reliability Metrics To Follow

    5 Mean-Time Reliability Metrics To Follow

    Most folks working in DevOps or SRE roles are familiar with metrics like mean-time-to-recovery (MTTR). Keeping track of the average time a team takes to respond to incidents is crucial to identifying bottlenecks in the support process. It’s also something executives like to show higher-ups when sharing a snapshot of overall platform performance. However, focusing on one single metric might be missing the greater picture.

    For example, how long did it take to discover the incident? How long did it take from discovery until action was taken? What was the timeframe between filing a ticket and updating all clients that had a bug? When can you say you’ve completely resolved an issue? As you can see, there are many potential metrics that could inform software reliability and the platform engineering process. “One number is never going to tell you a complete story,” said Emily Arnott, community relations manager, Blameless.

    I recently met with the Blameless team for a closer look into mean-time reliability metrics. Below, we’ll explore the nuances behind five different types of MTTX metrics and consider the business value of keeping tabs on each type.

    1. Mean-Time-To-Detect

    Mean-time-to-detect is a measurement of how long it takes, on average, to detect that an incident is present. This often happens automatically within a monitoring system. Perhaps a tool sends out an alert when latency meets a certain threshold, for example. But, detection could also come from other sources, such as a customer complaint.

    For example, consider Log4j. Perhaps a runtime vulnerability scanning tool noticed one of your components is impacted by a novel CVE and automatically sent a notification to the appropriate team channel.

    2. Mean-Time-To-Acknowledge

    Now, just because an incident is detected doesn’t mean it’s immediately acknowledged. Mean-time-to-acknowledge, then, is a measurement of how long it takes a human being to realize the incident and begin to act on it.

    In our CVE example, this would be the time between vulnerability detection and initial response. For example, the on-call incident manager received a vulnerability notification, read the exposure details and then filed a JIRA ticket and contacted the relevant team members.

    Many factors might extend mean-time-to-acknowledge. Perhaps someone isn’t logged into Slack, or a hardware issue stalls the notification. Alert fatigue may also get in the way, or there may be a reluctance to file a ticket and introduce more toil. Depending on the severity of the incident, someone simply might not believe the alert is worth responding to.

    3. Mean-Time-To-Recover

    Now, the following metrics are a little more open to interpretation, but we’ll do our best to define each. Mean-time-to-recover is the average time it takes to introduce a temporary fix after discovering an incident.

    For example, if a particular region is experiencing outages, engineers might temporarily divert traffic to a more stable server. This is not a permanent fix, but the system recovers and operations are generally unaffected. This helps maintain the status quo while a more permanent solution is ideated, tested and applied.

    4. Mean-Time-To-Repair

    Mean-time-to-repair (or restore) is the mean time it takes to issue a permanent repair to a system after discovering an incident. In order for a system to be considered fully repaired, it has to not just be working, but working robustly.

    For example, let’s say the incident in question involves performance issues. Perhaps a patch is issued to the core branch to remove bulky code that’s causing slow load times for clients. Mean-time-to-repair introduces a more permanent solution but still might not be the complete resolution to the problem.

    5. Mean-Time-To-Resolve

    Mean-time-to-resolve can be thought of as the average time between when an incident occurs to when the issue is completely resolved. Not only is the core codebase patched, but all clients reliant upon the software have been updated, as well. Lessons are learned and mitigation plans are set to respond to similar incidents or vulnerabilities in the future.

    Mean-time-to-resolve is about resolving the incident entirely, said Jake Englund, senior site reliability engineer, Blameless. This includes addressing the underlying fundamental contributors, completing all logs that remain on the back burner and following up with a retrospective.

    Using Mean-Time Metrics

    Mean-time metrics can provide a quantitative picture of incident response performance, which can be valuable for overall business operations. Mean-time-to-acknowledge, for example, can expose gaps in the remediation process, such as cognitive strife in reporting incidents, said Matt Davis, intuition engineer, Blameless. Understanding these technical and human factors are the first step to making the resolution process swifter.

    Of course, the above metrics rely on incident data, which may not always be a top priority. According to Davis, encouraging a culture that declares incidents—even minor ones such as a configuration change—can improve knowledge sharing within a team. “If you declare an incident, you could enact more systemic change,” added Arnott.

    Limitations of Mean-Time Metrics

    These mean-time metrics do have some limitations. “A number is only one part of the story,” said Davis. As a result, teams might struggle with deciding precisely what to detect. MTTR can be a helpful metric, but it’s the context that matters, he explained. Therefore, tracking multiple metrics can help provide a more sophisticated, nuanced picture. This involves looking beyond averages to consider outlier events, added Englund.

    There are also semantic nuances between the MTTX metrics defined above. “There’s a lot of ambiguity around these words,” said Davis. As a result, organizations might compute each figure differently. Some of these figures use time-markers which may not be technically possible to track consistently, especially since each incident is unique. Demarcating the precise moment an incident began might require guestimation. You might know when a service is fully restored, but the lasting customer perception is harder to gauge.

    Also, another potential downside is that mean-time metrics could easily be manipulated or misinterpreted, whether deliberately or inadvertently. Operations leads might selectively recall specific windows when showing MTTX metrics to higher-ups, leaving out other statistics that paint a different picture.

    Treat MTTX As A Guidepost

    Improving incident response is becoming mission-critical to maintain fully-functional systems as things like outages, downtime, slow speeds and zero-day vulnerabilities can negatively impact user experience. Sometimes, these issues must be addressed immediately to maintain SLAs.

    But tracking reliability averages isn’t all that simple, and they will likely mean something different to each organization. “It’s about embracing complexity and asking the right questions,” said Davis.

    In summary, mean-time reliability metrics provide helpful insight into the ongoing state of incident response. Yet, such metrics shouldn’t be imposed as a strict target — instead, they should be viewed as an informative guidepost. “Metrics can help you find what is discussion-worthy, but it’s not a discussion itself,” said Arnott.

  • More Than Half of DevOps Pros Have Backdoor Access to IT Infrastructure

    More Than Half of DevOps Pros Have Backdoor Access to IT Infrastructure

    A survey of 600 DevOps professionals conducted by strongDM, a platform for managing access to IT infrastructure, found nearly two-thirds (64%) had productivity impacted on a daily or weekly basis because of access issues.

    It’s not surprising that, as a result, DevOps teams created a number of workarounds to gain access, even though those methods don’t comply with cybersecurity best practices, according to the survey. More than half of respondents (55%) maintained backdoor access to systems, and 42% have embraced shadow IT to get access to tools and systems they needed for their roles, the survey found.

    Worse yet, the survey found that 53% of respondents admitted they are sharing credentials across teams.

    Well over half (57%) of respondents said it could take days or weeks for access requests to be approved, with 40% reporting it takes days to add tools to existing access solutions. Nearly three-quarters (73%) of respondents also noted it requires 15 minutes or more to gain access to infrastructure.

    More than half of respondents (52%) said they have missed deadlines due to issues with accessing infrastructure, with 53% of those respondents being held accountable for the missed deadline even if it was caused by their lack of access to infrastructure.

    Justin McCarthy, CTO for strongDM, said despite all the hype surrounding identity management and zero-trust IT, it’s clear many organizations are still struggling with the basics of access control. That issue has been further exacerbated by the need to enable more DevOps professionals to work from home since the start of the COVID-19 pandemic more than two years ago, he added.

    Many of those organizations are still relying on virtual private networks (VPNs) even though it’s been shown that stealing the credentials to access those VPNs is relatively trivial, McCarthy added.

    In place of those approaches to access IT infrastructure, strongDM is making a case for a dedicated infrastructure access platform that manages and audits access to databases, servers, clusters and web apps. It is based on local client software, a gateway intermediary and configuration tools that track roles and permissions.

    The benefits of that approach span everything from lower IT support costs to faster onboarding of new IT staff, noted McCarthy.

    Managing infrastructure access for DevOps teams is, of course, always going to be a challenge. DevOps teams are made up of engineers—among the most challenging types of end users to support. Many of them will use their own expertise to circumvent any process they deem to be inefficient. The trouble is, many of those end-runs would not pass muster with cybersecurity teams responsible for access management. The challenge each of those cybersecurity teams needs to come to terms with is the amount of time they want to spend time looking for these cybersecurity policy workarounds versus making it easier to securely access IT infrastructure.

    The sad truth is both DevOps and cybersecurity professionals are wasting a lot of time and effort trying to outwit each other when that time could be put to better use.

  • Why Your DevSecOps Initiative Will Fail

    Why Your DevSecOps Initiative Will Fail

    When you’ve been in and around the security industry for long enough, you get used to the industry hype machine turning a cool innovation into, uh, meh. This hype cycle starts at the RSA conference each year, and folks like me look for new hot stuff on the show floor. For perhaps only the second time in 25 years, I wasn’t at the show in person, but it seems that DevSecOps was the preferred bandwagon on which every vendor jumped. Sigh.

    I’m not sure whether it’s my increasing age or this business that has made me cynical, but here we are.

    To be clear, from a customer’s perspective, there is great value in the concept of DevSecOps, as evidenced by the upcoming DevOps Connect: DevSecOps @ RSAC 2022 virtual event. Having these (sometimes) mortal enemies working together toward a common goal is great, in theory. But alas, in practice (and similar to what happened when DevOps hit the scene), it’s easier said (or displayed in a vendor booth) than done.

    Thus, I’ve come to a sobering conclusion: Your DevSecOps initiative will fail.

    Most organizations will talk a good game for a while and they may even try some stuff, buy some kit, send folks to training and the like. But in the end, despite all these efforts, you guessed it—they will still fail.

    Is this a foregone conclusion for every organization? Well, no. But this isn’t my first rodeo, and I’m pretty sure this one will end like the others—in failure.

    But let’s say you want it to be different this time. Really, you do. And you are willing to take some actions to give yourself a chance at success. If that’s the case, here are a couple of tips to increase your chances, however small.

    Culture

    First and foremost, DevSecOps is not a thing. It’s not a set of tools (no matter what the vendors tell you); you don’t buy it on a VAR line card. DevSecOps (like DevOps) is a cultural shift. Your teams need to work together. They need to collaborate. They need to have shared incentives. And they need to experience the consequences of not playing nicely in the sandbox.

    Cultural shifts are hard. People don’t like to change. They resist. They undermine. They sabotage. It all sounds nefarious, but they do. So unless you can change your culture, you’ve got no shot.

    Shift Left

    Another one of these security-marketing-terms-run-wild is shift left. It means you want to integrate security testing directly into the development process as early as possible. You should be running security checks in the developer’s IDE to ensure they don’t violate security policy (like hardcoding API keys in their source, for example) before they even commit the code.

    You must also integrate security testing into the CI/CD pipeline(s). Thus, you need tooling that works with your preferred pipeline.

    Security Champions

    Security testing will create angst for your developers. They will have false positives. They will have to fix things that they probably don’t understand. It will cause them to miss delivery dates. Of course, they should build it right the first time, but in their mind, they’ll see it as the security folks causing delays.

    The developers will be annoyed, and you’ve got to manage that annoyance—or have senior management quash any rebellions, but that’s not a long-term solution.

    On the other hand, you could establish a security champions program, which anoints (and trains) developers on each team to “represent” security within the development team. They help educate the developers on the tools and secure coding. They diffuse irritation when something goes wrong.

    A strong security champions program is one of the leading indicators of DevSecOps success.

    Break the Build

    Finally, the security team must have the juice to break the build if a critical issue is found during the deployment. We talk about this with many organizations and they nod their heads. But they are lying to me and to themselves. When it comes down to it, someone on the dev team calls someone in senior management and, all of a sudden, that critical issue is now an alert, not a failed deployment.

    Not being able to stop a build will kill your DevSecOps program. It’s like when a quality control issue forces someone to stop the assembly line. If you don’t stop the line, faulty products can result. In a security context, that means some critical vulnerabilities will be much more expensive to fix later.

    So, there you have it. If you can evolve your culture, integrate security testing into your toolchain, empower security champions and empower your team to stop a deployment, you’ve got a chance at a successful DevSecOps program.

    Unfortunately, you probably can’t do these things, and you’ll likely fail. In that case, I have some lovely property by a waterfall I’d like to sell you.

  • Survey Shows Increased Reliance on DORA Metrics

    Survey Shows Increased Reliance on DORA Metrics

    A new survey found just under a quarter (23%) of respondents are now tracking all four of the DevOps metrics defined by the DevOps Research and Assessment Team (DORA), with another 17% now tracking three.

    The State of Developer Experience survey polled 129 IT professionals that play a role in software development and was conducted by LeanIX, a provider of a platform for managing the building of enterprise applications.

    Dominick Rose, vice president of product management and strategy for LeanIX, said the ability to track DORA metrics such as deployment frequency (77%), failure rate (73%), lead time for changes (63%) and mean-time-to-recovery (MTTR) (55%) are leading indicators of DevOps maturity.

    DORA metrics, which are defined and maintained by a unit of Google, are being used most frequently to drive agile planning (69%) and optimize continuous integration/continuous delivery (CI/CD) platforms (58%), the survey found.

    Overall, the survey revealed just under half of the respondents (47%) said their organization had a high level of DevOps maturity, defined as having adopted three or more DevOps working methods. Those working methods are: Being flexible to changes in customer needs; having implemented a CI/CD platform; all engineers build, ship and own their own code; teams are organized around topologies and each team is free to choose its own technology stack.

    Of course, each individual organization will determine for itself what level of DevOps depth is required. For example, not every organization would see the need for teams to be organized around topologies or be free to choose its own technology stack. In fact, Rose said the survey made it clear that larger enterprise IT organizations tended to have a lower overall level of DevOps maturity. One reason for that is many larger organizations are still employing legacy processes to build and deploy software, noted Rose.

    Most developers are also further along in terms of embracing continuous integration (CI) than IT operations teams are in adopting continuous delivery (CD), added Rose. However, as the number of applications being developed using low-code and no-code tools continues to increase, it’s only a matter of time before application delivery needs to become more automated, he said. Achieving that goal will become easier as more artificial intelligence (AI) is incorporated into IT operations, Rose added.

    Nevertheless, the survey made it clear there is still a long way to go in terms of bridging the divide between DevOps teams and the rest of the business, with only 20% of respondents indicating that they use a value stream management (VSM) platform to track engineering efficiency to tie development activities to actual business results.

    A total of 71% of respondents, however, tracked open support tickets as a measure of customer value, followed by 66% that tracked monthly users and 45% that tracked feature adoption.

    It remains to be seen how DevOps will be further promulgated throughout organizations but as more organizations realize how dependent they are on software, it then becomes a question of how fully they embrace DevOps best practices as the pace at which applications are being built and deployed continues to accelerate.

  • TechStrongCon: Time to Build an Army of Citizen Developers

    TechStrongCon: Time to Build an Army of Citizen Developers

    DevOps teams need to start drafting a strategy to support what will soon become an army of citizen developers.

    Speaking at the virtual TechStrongCon event, JP Morgenthal, global director for modern applications development at DXC Technology, told conference attendees that the time to build an army of citizen developers is now.

    Citizen developers are typically end users that have developed enough expertise to build an application using low-code or no-code tools. Most organizations don’t have enough professional developers to address their application development backlogs, so it’s imperative that they enable end users to build applications, noted Morgenthal.

    Those citizen developers, however, need to be supported by DevOps teams to ensure guardrails are in place for building secure applications that scale. In addition, DevOps involvement also reduces the friction that a citizen developer will most certainly encounter when building an application, he added. “DevOps is fundamental, “ said Morgenthal. “We need to invest in it heavily.”

    Otherwise, citizen developers—who typically have other tasks that require their attention—will simply abandon their application development efforts, he noted. “This is not their primary task,” said Morgenthal. “They are going to need to be nurtured.”

    Most professional developers are focused on applications that are systems of record. The problem is that there simply are not enough of them to build necessary applications to drive systems of engagement, noted Morgenthal.

    That increased reliance on citizen developers is, in fact, part of a larger wave of democratization of IT in which individuals that don’t have advanced technology degrees take advantage of automation to build and deploy applications, he added.

    Organizations, however, run into issues when they fail to test those applications, make sure that configurations are not manually changed or don’t address the technical debt that inevitably accrues over time, said Morgenthal.

    Burnout can also become an issue, so Morgenthal said organizations need to make sure that agile development practices are used to first create a minimally viable product (MVP) and then plan development sprints to update and maintain it.

    Finally, there also needs to be a plan in place for shifting responsibility for the application to someone else when the individual that created it eventually leaves the organization, he added.

    Citizen developers, of course, are not the only ones using low-code and no-code tools. Many professional developers are using those same tools to build applications faster. In fact, it’s not clear how many end users have the skills required to successfully build applications, even though low-code and no-code tools automate much of the process. One way or another, many professional developers are now also collaborating more frequently with end users to build applications using low-code/no-code tools that make it easier for end users to, at the very least, describe the workflow of the application they want to build and deploy.

    Regardless of who builds the application, it’s a given that a lot more code will be moving through DevOps pipelines in the months and years ahead. DevOps teams, as a result, will inevitably need to revisit workflows and platforms to continuously update and maintain those applications at scale.

  • Rust in Linux 5.20 | Deepfake Hiring Fraud | IBM WFH ‘New Normal’

    Rust in Linux 5.20 | Deepfake Hiring Fraud | IBM WFH ‘New Normal’

    Welcome to The Long View—where we peruse the news of the week and strip it to the essentials. Let’s work out what really matters.

    This week: Linus says next release will support Rust, FBI warns scammers are getting hired in deepfake interviews, and 80% of IBM staff stay at home. (more…)

  • Buildkite Adds Analytics Tools to Identify Flaky App Tests

    Buildkite Adds Analytics Tools to Identify Flaky App Tests

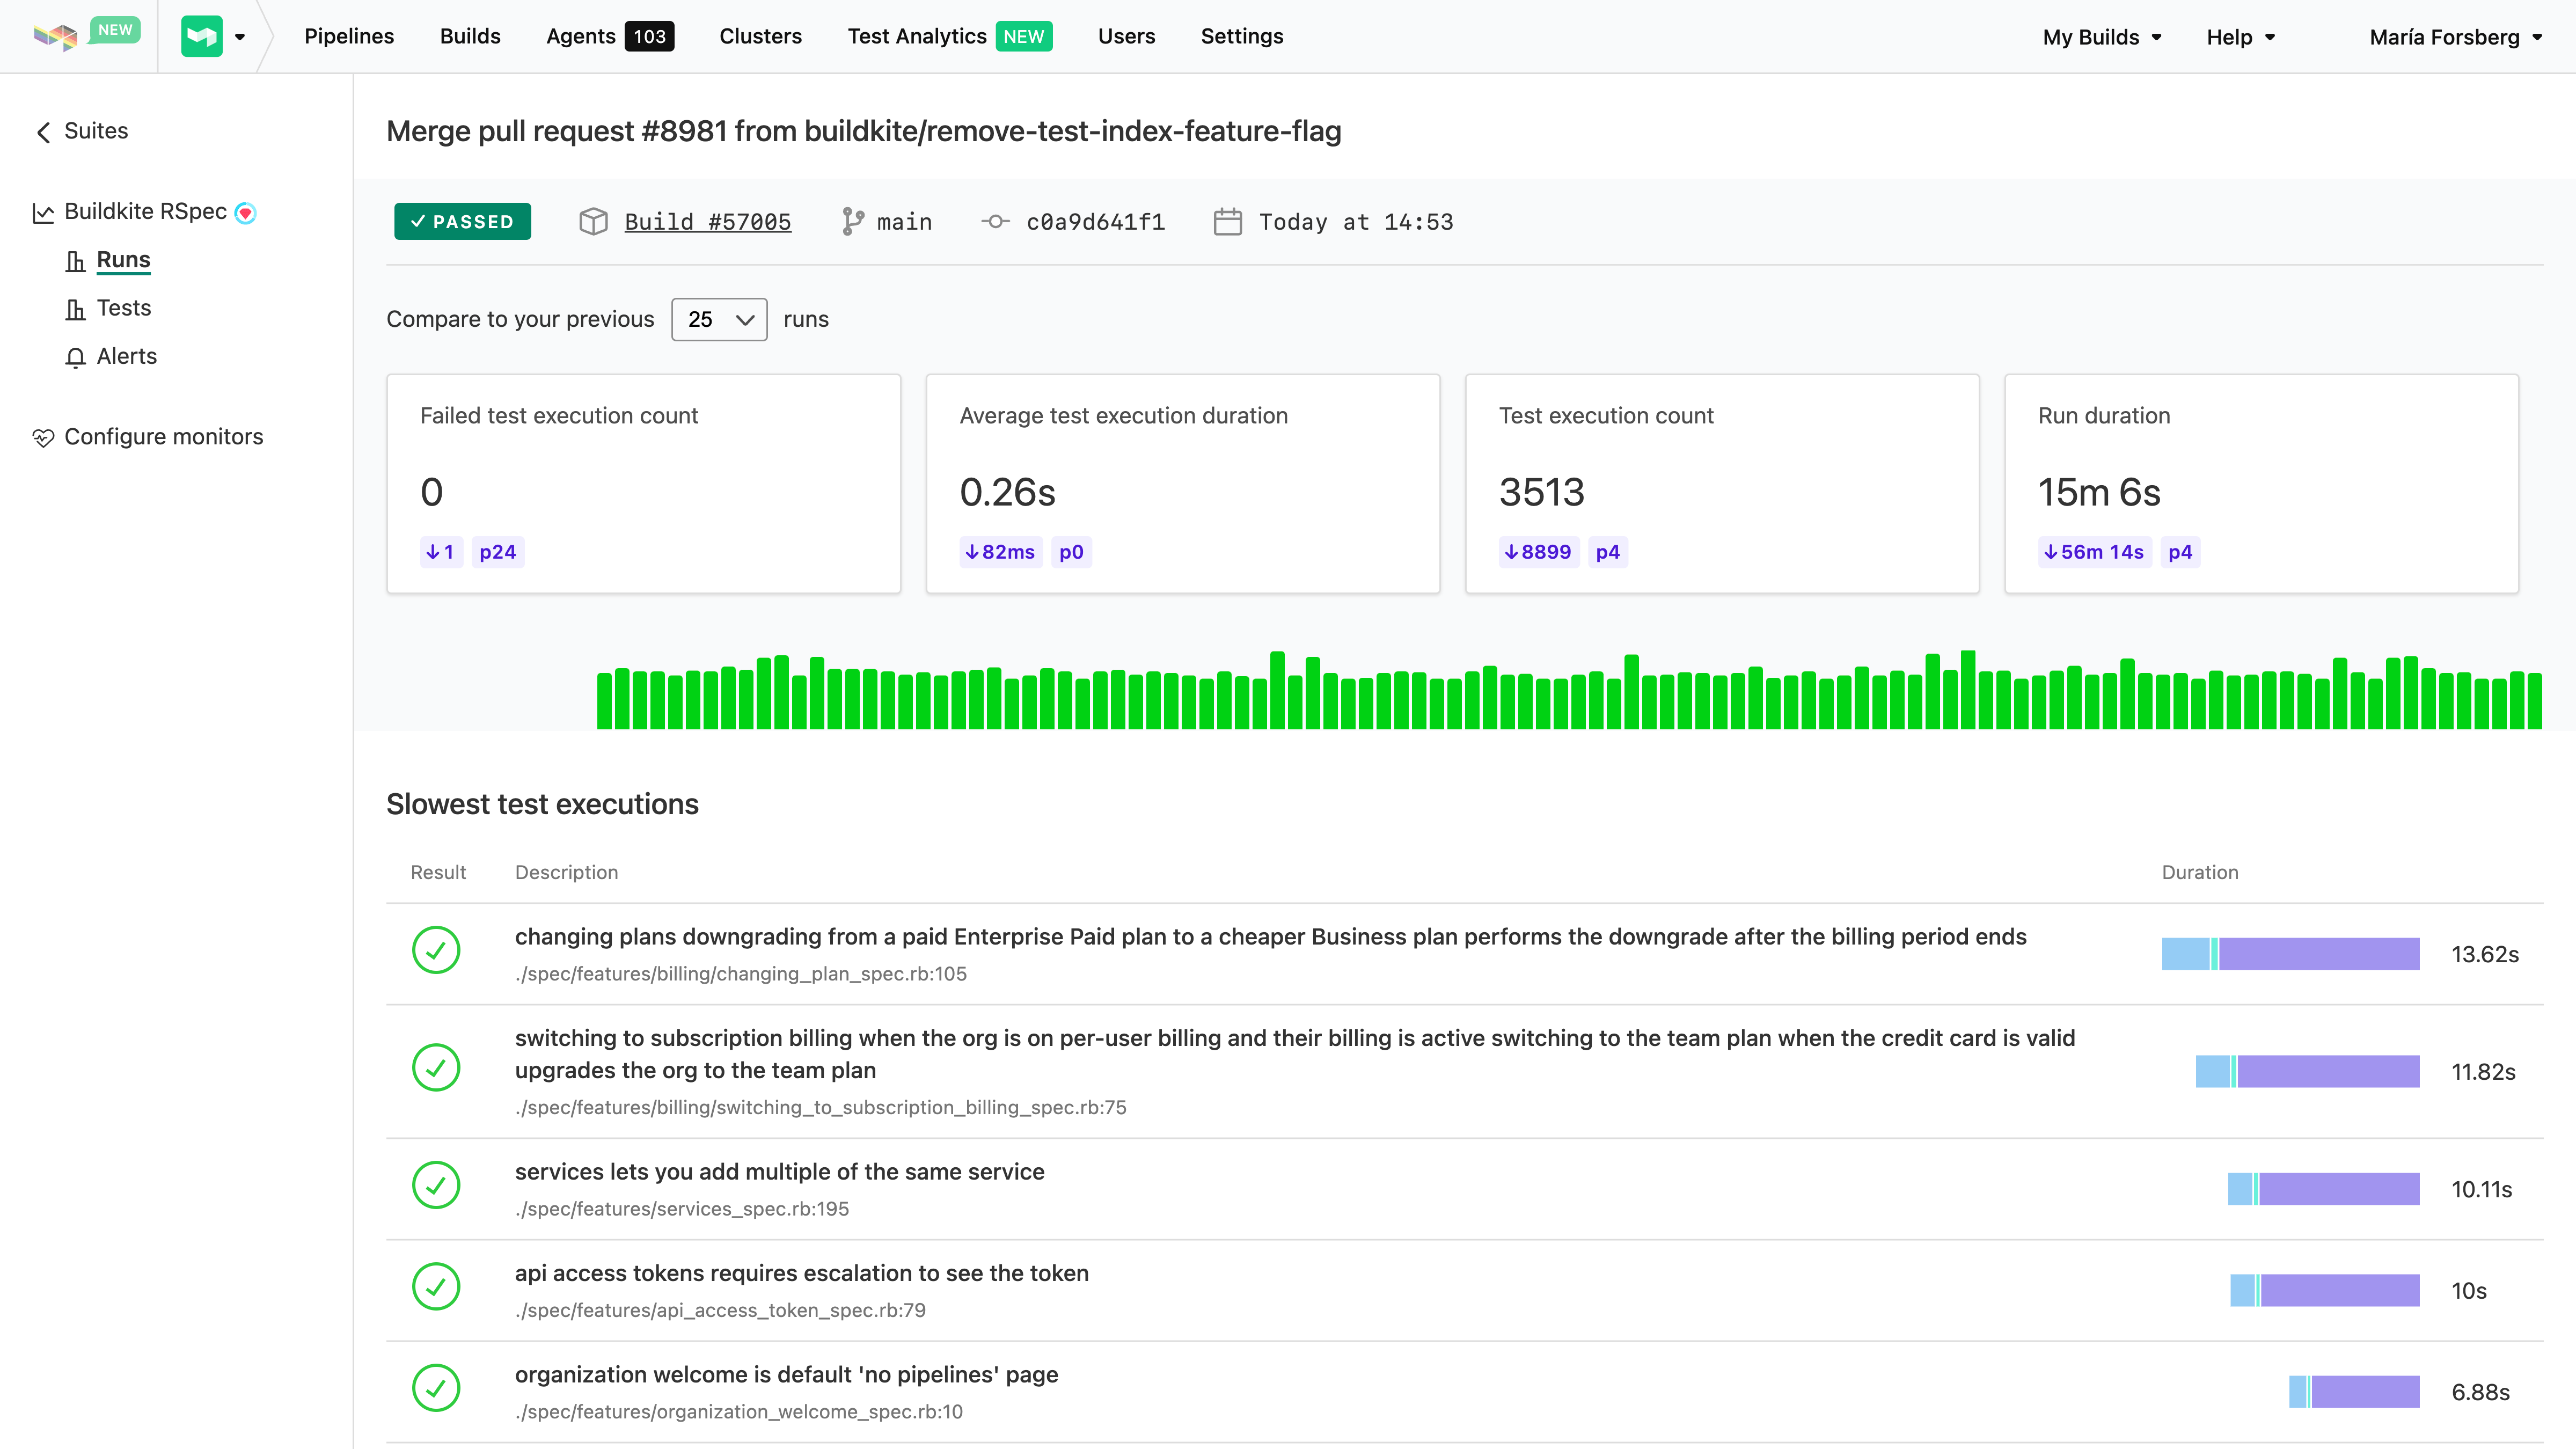
    Buildkite has added an analytics tool to its continuous integration/continuous delivery (CI/CD) platform that identifies flaky tests.

    Buildkite’s co-CEO Keith Pitt said the company’s Test Analytics tool enables continuous performance monitoring and real-time insights for test suites that, when not properly written, only serve to waste DevOps teams’ time. Rather than eliminating those tests, most DevOps teams just opt to run them again on the assumption that the code they are testing will eventually pass because the test is poorly constructed, noted Pitt.

    Buildkite reports there are more than 800 million seconds—or the equivalent of 25 years—of flaky tests manually re-run on its platform by developers each month.

    In addition to being integrated with the Buildkite CI/CD platform, the Test Analytics tool can also be applied to tests residing in CI platforms such as CircleCI, GitHub Actions and Jenkins.

    Test Analytics includes a dashboard that identifies the slowest and least reliable tests to help prioritize test remediation efforts. Historical views and trend graphs are also available to provide further insight into recurring issues.

    DevOps teams can also take advantage of user-defined thresholds to define whether a test is slow or unreliable, which generate custom alerts when discovered. Finally, there are integrations with commonly used testing frameworks to determine where tests are, for example, wasting time running database queries against application programming interfaces (APIs) that have timed out.

    Pitt noted that most tests today are created by developers and software engineers rather than dedicated testing teams. As such, the chances there will be an issue with a test that is returning flaky results are high.

    Organizations are, of course, trying to determine how far left to shift application testing. Developers can write their own tests, but how thorough and objective those tests are is debatable. There are also certain tests that should be applied to all applications that organizations can embed within their DevOps workflows to make sure they are always run.

    Obviously, the more testing that occurs the fewer issues DevOps teams will encounter after an application is deployed. However, when tests are flaky, it becomes easier for developers to justify not running them even though that test might still surface an issue they should address. In addition to increasing confidence in the quality of those tests, knowing which tests are flaky allows a DevOps team to determine which tests should be run first. That’s critical at a time when more organizations are trying to increase developer productivity; that productivity is often adversely impacted by waiting for tests to be completed before more code can be written.

    Eventually, the overall quality of tests should improve as machine learning algorithms and other forms of data science are applied. In the meantime, however, the onus for improving application testing is clearly on the engineers that create them. The challenge is many of those engineers may not even be aware how flaky a test really is until someone shows them some empirical data that can’t be disputed.

  • Survey Reveals High Cost of Application Modernization

    Survey Reveals High Cost of Application Modernization

    A survey of 250 software developers and architects in the U.S. found nearly three-quarters of respondents (74%) reported that the average cost of an application modernization project is nearly $1.5 million, with 79% noting that at least one of these projects has failed.

    Conducted by Wakefield Research on behalf of vFunction, a provider of a platform that automatically converts monolithic applications into microservices, the survey polled developers and architects at organizations with 5,000 or more employees that have been in business for at least 15 years and are maintaining Java applications. The survey found that the primary reasons application modernization projects failed were expectations not being set correctly (43%) and the need for organizational structural changes (37%).

    Despite the cost and inherent risks, however, the survey also found a full 92% of respondents planned to or are currently modernizing applications. Nearly two-thirds (62%) said having the right resources and tools is the key to application modernization success.

    Well over half of the respondents (58%) also noted that, on average, it takes 16 months to complete these projects, with more than a quarter (27%) noting it takes two years or more. Not surprisingly, a full 97% said they expected someone in their organization would push back on a proposed project.

    Application modernization, of course, is something of a catch-all phrase that can involve everything from providing applications with a web frontend to lifting-and-shifting them into the cloud or completely refactoring them to run natively on a cloud platform.

    vFunction CEO Moti Rafalin said that regardless of the scope of the initiative, most organizations should first pick these projects based on what makes the most sense for the business. Once identified, it then becomes critical for IT teams to have a deliberate strategy in place to achieve that goal given the high cost of failure, he added.

    Organizations would also be well-advised to determine how job roles will evolve, because one of the biggest inhibitors to application modernization is concern over how any job might be impacted, noted Rafalin.

    It’s not clear how quickly organizations are opting to modernize existing applications versus replacing them outright. However, as more organizations opt to run applications in the cloud, the level of interest in using microservices to build applications has risen sharply. The goal is to employ microservices to make applications both more resilient and secure. The tradeoff is that microservices-based applications tend to have lots of dependencies that make them more challenging to manage and secure.

    Regardless of approach, it’s more a question of when an application will be modernized or retired versus if. The level of technical debt that accrues over time for each application eventually becomes unsustainable. The issue, of course, is that most organizations don’t have the resources required to modernize every application at once, so it may take a decade or more to work through an entire application portfolio—even as that portfolio continues to grow. In fact, as technologies continue to evolve, it may turn out that application modernization is not a task to be completed as much as it is a permanent state of IT affairs.

  • Salesforce Adds RPA Bots to MuleSoft Integration Platform

    Salesforce Adds RPA Bots to MuleSoft Integration Platform

    Salesforce today announced that it is now using robotic process automation (RPA) to connect disparate data via a no-code tool developed by its MuleSoft unit.

    Shaun Clowes, chief product officer for MuleSoft, said bots created using an RPA-infused integration platform can now automate much of the effort previously required to integrate data residing in different systems. Salesforce acquired MuleSoft in 2018 and, since then, has been working to make the platform for integrating application programming interfaces (APIs) a core element of its business process workflow tools.

    The news was announced at the MuleSoft CONNECT 2022 conference. The overall goal is to employ RPA and no-code tools to accelerate digital business transformation initiatives without writing code, noted Clowes. Overall, Salesforce claimed its customers are running 4.8 billion MuleSoft transactions daily, resulting in a 74% decrease in operational costs and a reduction of more than 100 billion hours of work every month, using Salesforce Flow tools that are integrated with the MuleSoft integration platform.

    In theory, no-code tools that integrate disparate data sources can be used by professional and so-called citizen developers alike. That capability should reduce the time and effort required to create those integrations. A recent survey conducted by Salesforce found nearly 96% of respondents said that modifying and rebuilding automation is a challenge as systems and business requirements change. In addition, four out of five respondents noted that restructuring existing application and data landscapes to support automation would likely compound their organization’s technical debt.

    More than half of respondents (53%) said they are using integration and API management capabilities to some extent, with 44% employing those capabilities to drive business process automation initiatives. A full 80% said they are working toward putting hyperautomation on their technology roadmap within the next 24 months.

    Of course, the MuleSoft platform can be employed beyond the portfolio of software-as-a-service (SaaS) applications provided by Salesforce. However, it’s also become apparent that more organizations are building and deploying custom applications on top of a range of SaaS applications in addition to building and deploying applications written in procedural code that might be running in the cloud or in an on-premises IT environment.

    It will be up to each IT organization to determine how much they need no-code integrations as part of a larger DevOps workflow, but as it becomes easier to create integrations using RPA tools their numbers should increase. The impact all those integrations will have on DevOps pipelines remains to be seen, as well. Many organizations will need to revisit their DevOps workflows as the number of application development projects being simultaneously launched continues to increase.

    In the meantime, it’s clear that no-code/low-code tools infused with RPA capabilities will empower more end users. That shift will have a profound impact on DevOps teams, as the sheer volume of code and associated integrations increases. The challenge, of course, will be finding a way to make sure that the integrations created are secure and that they can actually scale as more data sources are added.

  • GitLab To Embed Observability in CI/CD Platform

    GitLab To Embed Observability in CI/CD Platform

    The latest version of the GitLab continuous integration/continuous delivery (CI/CD) platform added a range of monitoring and visualization capabilities as part of an effort to embed a full set of observability capabilities in the core platform within the coming year.

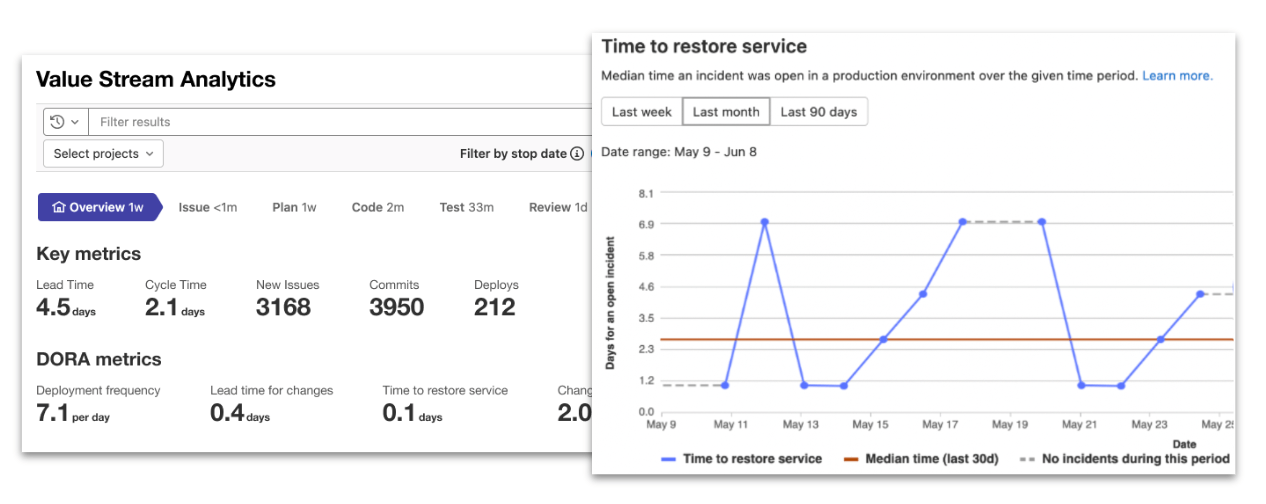
    As part of that effort, the latest version of GitLab, 15.1, has now added support for all the metrics defined by the DevOps Research and Assessment (DORA) team that is also part of Google.

    In total, the 15.1 version of the GitLab platform has more than 30 updates. These include additional security capabilities in the form of support for the security assertion markup language (SAML) Group Sync and the Supply chain Levels for Software Artifacts (SLSA) framework defined by Google.

    Finally, GitLab added links to all configuration files and templates included in the CI/CD platform to the pipeline editor to make it easier to manage large and complex pipelines.

    Cindy Blake, director of product marketing for GitLab, said the monitoring, observability and security capabilities added to the platform are part of an ongoing effort to eliminate the ‘digital duct tape’ that many DevOps teams currently rely on to extend a CI/CD platform. In fact, as many DevOps teams look to better secure their software supply chains, many are now taking advantage of the moment to replace do-it-yourself (DIY) approaches with an integrated CI/CD platform based on a common codebase, noted Blake.

    As part of that effort, Blake said GitLab is building its own dynamic application security testing (DAST) tools that are more tightly integrated with its CI/CD platform.

    In general, there is now an expectation that the tools required to secure software supply chains should be made available within a CI/CD platform, but organizations are still working through the processes that will need to be implemented to achieve that goal, added Blake.

    It’s not clear to what degree organizations are looking to replace legacy CI/CD platforms as they modernize application development and deployment. In many cases, however, the technical debt associated with maintaining custom integrations across their DevOps environment has become considerable. Many organizations are revisiting their DevOps workflows as part of an effort to increase overall developer productivity. The challenge, of course, is that migrating from one CI/CD platform to another requires considerable time and effort.

    In the meantime, the number of organizations embracing DevOps best practices continues to grow. GitLab is betting that as the total size of the CI/CD market continues to expand, most of those organizations will prefer an integrated platform rather than writing and maintaining custom integrations themselves.

    Regardless of approach, the ability to monitor and observe workflows is an essential element of any DevOps workflow. There is, of course, no shortage of observability platforms available. It’s not clear whether IT organizations will adopt one of those offerings versus taking advantage of observability and monitoring embedded within a CI/CD platform. One way or another, however, it’s getting easier to discover the root cause of any IT issue.