Category: Blogs

  • Observe Seeks to Put More IT Metrics in Context

    Observe Seeks to Put More IT Metrics in Context

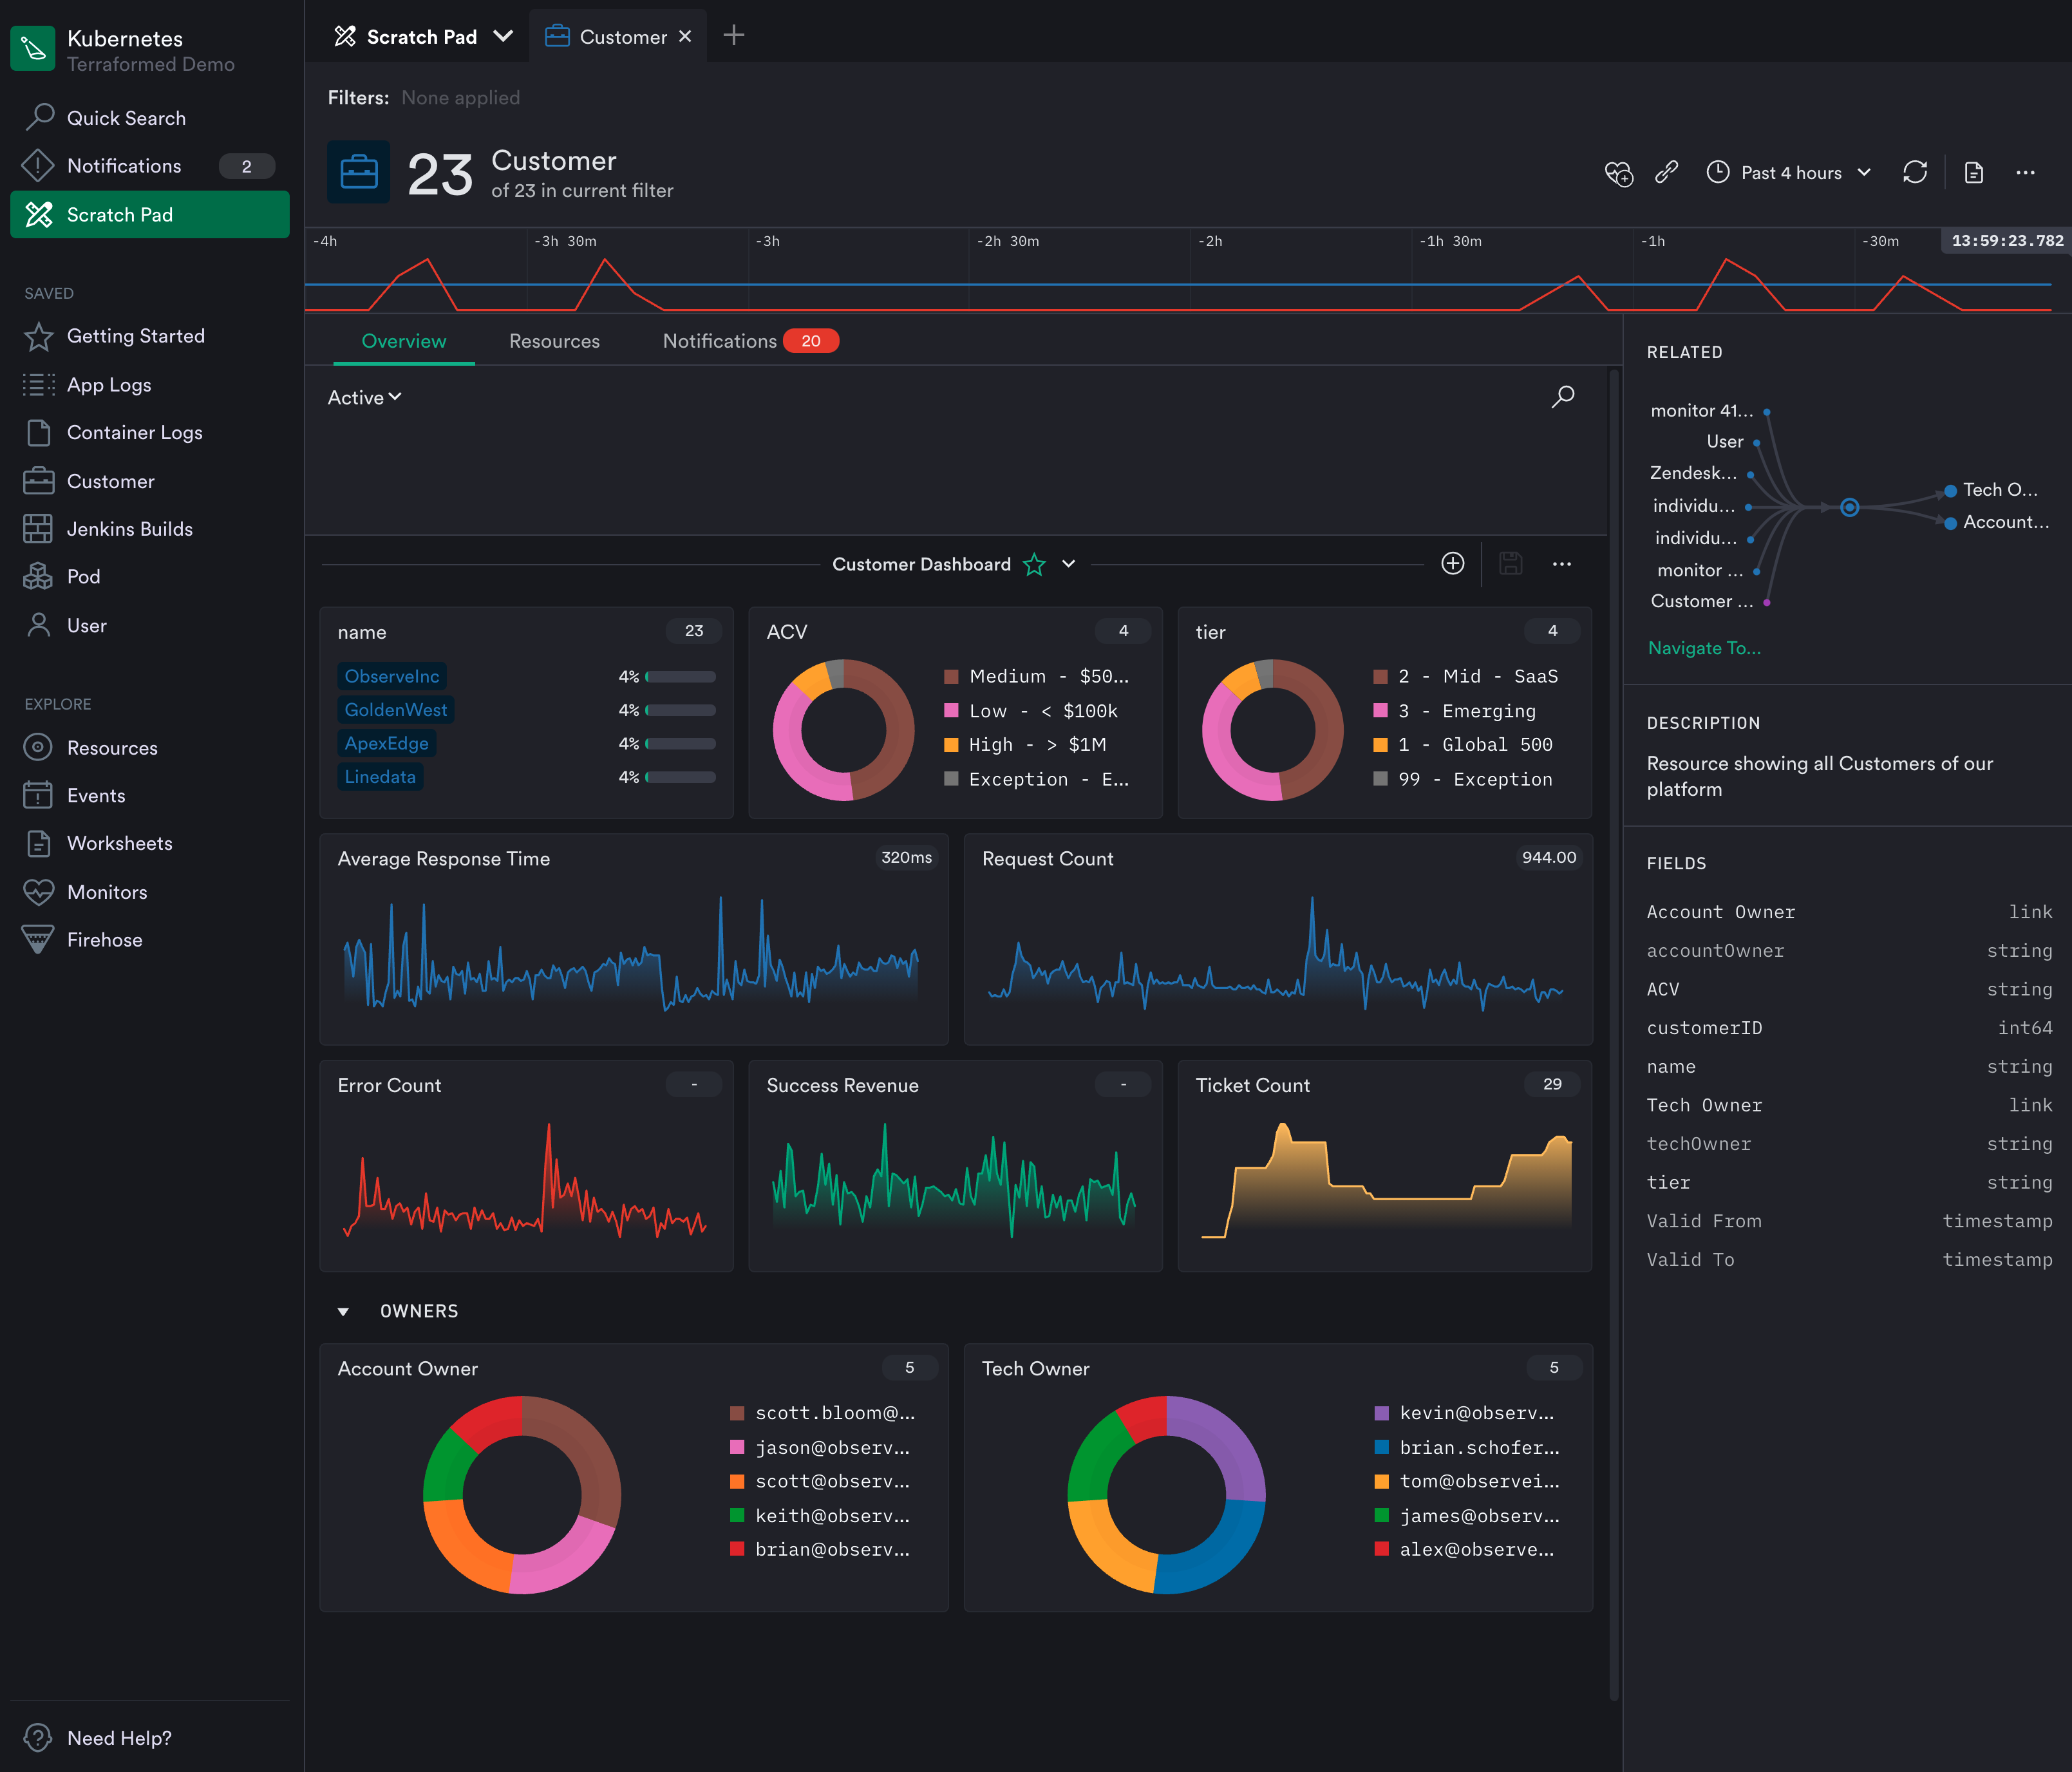
    Observe, Inc. announced today it has updated it observability platform to add support for metrics based on time series data. In addition, the company is revamping how the platform generates alerts as part of an effort to surface more actionable intelligence.

    Jeremy Burton, Observe CEO, said rival observability platforms require IT teams to sift through hundreds of metrics that are generated using elaborate tagging schemes that ultimately drive up the cost of storage. The Observe platform curates metrics by associating them with, for example, a customer, to provide more relevant context, Burton noted.

    That approach eliminates the need to present IT teams with overwhelming lists of metrics in addition to reducing storage costs by removing the need for a complex tagging scheme, added Burton.

    The latest update leverages that approach to metrics to only generate alerts based on curated metrics attached to customers, pods, shopping carts or containers. Rather than simply being alerted to a drop in response times, for example, the IT team can also easily see which customers or pods might be affected. That shift will reduce the volume of alerts that are already overflowing in email inboxes and across other communications platforms.

    Fresh from raising an additional $7 million, Observe today also revealed it has added 20 paying customers since launching the platform on top of the Snowflake cloud service residing on the Amazon Web Services (AWS) public cloud. Rather than reinventing the same core infrastructure, Observe is leveraging a data analytics engine that is already widely employed in IT environments.

    For now, Observe will continue to primarily focus on metrics as part of an effort to deliver insights in a form IT operations teams are prepared to consume today, said Burton. Over time, however, Observe will add support for distributed traces via tools such as OpenTelemetry and Jaeger as it adds additional application performance management (APM) capabilities, added Burton. Rather than telling IT operations teams they are managing IT in the wrong way, the goal is to meet IT operations teams where they are today, noted Burton.

    That strategy also enables the Observe platform to be employed to manage both monolithic and microservices-based applications running on Kubernetes clusters, noted Burton. The immediate goal is to provide IT teams with an alternative to legacy monitoring tools that provide more context at total lower cost by allowing IT organizations to rationalize tools that don’t tend to be especially well integrated, added Burton.

    In the longer term, Observe will also employ machine learning algorithms to collect data more efficiently. However, Burton said the company remains skeptical of visions of an IT future that depend on machine learning algorithms to continuously learn IT environments that are not only unique, but subject to frequent changes.

    Competition among observability platform providers is already fierce. Each IT team will need to decide what type of platform makes the most sense for them based on costs and their preference for specific capabilities one vendor might have that another doesn’t provide. One way or another, however, the way IT environments are managed will soon be changing for the better.

  • Leveraging AI in DevOps for Non-Linear Scaleup

    Leveraging AI in DevOps for Non-Linear Scaleup

    With technology evolving in leaps and bounds, AI is shaping the future of digital transformation for every business seeking speed, scalability, quality and flexibility.

    Since DevOps is on the verge of delivering exceptional software development environments, DevOps in AI is undeniably the next breakthrough in technology. We’ve witnessed every industry racing toward the adoption of AI to transform their business. To support this transformation, smart automation solutions coupled with AI implementations is becoming the new normal.

    So if you’re thinking about reinforcing your enterprise’s DNA by leveraging AI, DevOps principles for artificial intelligence are vital to these efforts. Here’s how businesses can unlock the true potential of AI and stay ahead of the curve.

    DevOps and AI

    DevOps has been s game-changer for numerous businesses. Applying AI can helps DevOps teams achieve the operational efficiency of machine learning (ML) models all the way through the journey from design to production.

    Artificial intelligence undeniably enhances automation and fast-tracks the performance of DevOps. Since the digital transformation process is quite challenging for diverse businesses, DevOps and AI ensures the right processes are in place that can further bring flexibility throughout the journey.

    DevOps enables continuous deployment and quick delivery of AI models via:

    • Speed: Improved overall development and delivery time by reducing unnecessary activities
    • Scalability: On demand and auto-scaling AI models
    • Quality: Boosting cleaning datasets and eventually promotes consistent learning that further enhances AI
    • Data monitoring: Decision making and computing helps handle huge amount of data with precise data monitoring

    Benefits of Integrating AI in DevOps

    There are endless benefits to integrating AI in DevOps.

    Analysis

    Data analysis is the key to business success, especially in times when there’s a huge list of competitors rushing to gain consumer trust. Since DevOps produces an enormous amount of data, it isn’t practical for humans to analyze the data without technological intervention.

    Artificial intelligence’s smart analytics eases the process by identifying and solving problems in a
    more systematic way, resulting in efficiency and increased consumer satisfaction.

    Data Correlation

    In the wider technology environment, development teams have their own set of issues and errors, which arrive while monitoring the processes. Since the communication scope is minimal and there’s a lack of mutual learning across teams, artificial intelligence can help to accelerate the learning cycle.

    Artificial intelligence helps to improve data insights from multiple platforms, which, in turn promotes better communication and establishes better data correlation.

    Failure Handling

    Machine learning is paving the way to better error resolution based on data, and eventually artificial intelligence will be able to predict signs of failure by examining patterns. Since humans cannot match the observation capabilities of AI, certain indicators of failure can only be analyzed through AI. This further enhances the overall development processes, as quick identification helps identify issues before they can impact the software development life cycle.

    Breaks Down Silos

    DevOps with AI has the ability to streamline business processes and establish proper communication among diverse systems, removing barriers that slow down the development and deployment processes. Furthermore, the ability to automate, continuously integrate and enhance communication helps business leaders to focus more on other aspects that can further accelerate business growth.

    Economic Growth

    Since the basic function of an AI-based model is automation, it can help businesses save money and enhance human resources. For any business, eliminating repetitive human work is a tough nut to crack. but a necessity when businesses are demanding continuous innovations. Artificial intelligence could be the best way for enterprises to cut costs and eventually helps the organization to use human resources more creatively and productively.

    Makes Software Intuitive

    Besides endless business benefits, AI-based software is more intuitive and user-friendly, since it prioritizes the reduction of human error. While DevOps is a well-known, reliable, business-driven approach for delivering software, intermingling artificial intelligence could enhance the user experience by integrating technology more deeply into the system.

    The perfect harmony of simplified interactions between humans and AI helps businesses achieve their desired goals of speed, efficiency, scalability and security.

    AI-driven systems are providing promising and scalable solutions for enterprises that are on a hunt
    for innovative and rapid ways to scale business growth. AI in DevOps is undoubtedly the best solution for accelerating growth through precise monitoring, automation and process improvement. This is the right time for businesses to ensure they operationalize artificial intelligence as a core business objective to stay ahead of their competitors.

  • Make a Plan for Test Automation

    Make a Plan for Test Automation

    The amount of testing that we could be doing is massive. Most of us don’t look at testing across the spectrum and all-inclusively, but let’s do that for a second.

    We have functional testing at the code level, which is reasonably well automated already, if your shop is using such automation. Then we have integration testing, which is a superset collection of API testing, code integration testing, usability and regression testing. Integration testing is automated, and sometimes that’s done well, but this massive space is still growing. Next up would be security testing, which covers much of the same code that other testing is interested in from a strictly security focused perspective. Then, there is actual usability testing, which is more important for some areas than others—embedded needs far less usability testing than web apps, for example—and has different levels of automation at this point in time.

    Really, when you think about it, the complexity of this environment is massive. We not only need to test an array of different functionalities from an array of different perspectives, but we have to do it on an array of platforms. Testing on Windows is different than testing on Linux; testing in the cloud can use different tools than testing in-house; clients can be on any given platform, depending on the application and target market … we really do have a beast, here.

    And testers have always been behind, or have not covered things well. This is not a ding on testers, this is the result of the complexity at hand and the fact that, in many instances, one line of code can go wrong in a bunch of different ways.

    Enter automation, which is growing rapidly in the world of continuous integration (CI). Automated testing tools range from broad to very focused, and all help facilitate testing. The DevOps increase in development means more testing, and testing was already behind. This has been discussed pretty thoroughly in the past, but it finally feels like we’re getting to a point where we have viable solutions to the problem. If testers become test developers that review results of automated tests, and through CI those automated tests are increasingly worked into the process of development, we’ll see testers getting better coverage and quality seeing a continued increase.

    But that does mean you should keep your eyes on the market as it continues to grow, and pick tools that offer the most functionality that is most useful to your test team. And get them up and running. More testing means more work setting up tests. Even no-code test solutions for UI require someone to record the actions that are necessary to complete the test, and that takes someone’s time. But the return is long-term testing that doesn’t require a person until a red flag is raised by automation.

    I’m all for it. Both testing and security have the most to gain from automation, because they’ve been the most behind historically, and corner-cutting has cost organizations dearly. So, let’s get with it; check out some new test tools (there are plenty listware articles giving you a place to start), and let’s make great software better!

  • Grafana Labs Advances Open Source Visualization and Observability

    Grafana Labs Advances Open Source Visualization and Observability

    During the online GrafanaCONline conference today, Grafana Labs announced that version 8.0 of its open source visualization software widely employed by DevOps teams is now generally available. In addition, version 1.0 of Grafana Tempo, an open source back end platform for collecting distributed traces that are needed to drive observability across an application environment, is also generally available.

    At the same time, Grafana Labs revealed that Grafana Tempo is now available as a service on Grafana Cloud.

    Version 8.0 of Grafana adds support for additional types of visualizations such as streaming panels, state timeline, status history, bar chart and histograms in addition to a revamped unified alerting system that enables DevOps teams to view and edit alerts generated by Grafana and open source Prometheus monitoring platform via a common user interface. The notification system adopted to achieve that goal is based on a Prometheus alert manager that provides capabilities such as grouping, deduping and silencing of notifications alongside advanced message templates.

    The latest release of Grafana also improves startup and graph rendering performance, thanks to a major reduction in initial download size and graph rendering time.

    The enterprise edition of Grafana has also been updated to provide support for fine-grained access controls, improves caching of back end data sources and improved reporting capabilities such as live dashboard links that can be embedded in email.

    Overall, Grafana Labs claims there are now more than 750,000 active installations of Grafana that organizations are employing to create visualizations that correlate data collected from multiple back end sources.

    In addition to contributing to Grafana and Grafana Tempo, the company is running a cloud service that makes multiple instances of Prometheus running on different clusters accessible from a central console.

    Torkel Ödegaard, creator of the Grafana project and chief Grafana officer for Grafana Labs, said Grafana Tempo promises to further advance observability thanks mainly to its ability to employ object storage to capture complete distributed traces. Rather than only sampling traces, it’s now feasible to trace every request. Grafana Tempo is also compatible with any open source tracing protocol, such as Jaeger, Zipkin and OpenTelemetry, and can be integrated with metrics, logs and dashboards via a managed Grafana Cloud service.

    It’s not quite clear how quickly organizations are embracing distributed traces to improve application observability or, for that matter, to what degree traces might eliminate the need for certain types of metrics or log analytics. The one thing that is certain is DevOps teams require more context than ever to proactively manage complex IT environments. Distributed traces make it simpler to track interactions between application services. The challenge is they can require IT teams to store a lot more data.

    In time, of course, distributed tracing will become more commonly employed as developers more routinely instrument applications based on microservices that tend to have lots of dependencies that are difficult to discover in the absence of some type of distributed tracing capability. Of course, distributed tracing has been around, in some form or another, in application performance management (APM) platforms for some time. The difference now is that, as open source software, it’s becoming more affordable to implement.

  • HashiCorp Increases Terraform’s Enterprise Appeal

    HashiCorp Increases Terraform’s Enterprise Appeal

    During the online HashiConf Europe conference today, HashiCorp debuted the general availability of a 1.0 release of HashiCorp Terraform along with updates to HashiCorp Terraform Cloud service.

    Meghan Liese, senior director of product marketing for HashiCorp, said in both cases HashiCorp is moving to enable organizations to better secure and govern IT infrastructure-as-code provisioned using open source Terraform tools.

    Version 1.0 of HashiCorp Terraform provides access to a stable application programming interface (API) that will foster interoperability and simplify future upgrades.

    The Terraform Cloud service, which eliminates the need for IT teams to set up and manage a Terraform platform, adds workflows enhancements to the Terraform Cloud that include the ability to publish curated modules to a private registry, enhancements that make it easier to visualize elements of a workspace and a preview of an ability to check with third-party tools related to a Terraform run.

    Overall, the goal is to make it simpler for organizations to compose, collaborate and reuse infrastructure-as-code using modules and the public and private registry options, said Liese. The public registry already has more than 5,000 modules. Terraform Cloud now offers a native workflow to publish modules from the public registry directly into an organization’s private registry.

    Terraform, of course, has been widely employed since it first debuted in 2014. There have been 15 major updates prior to the release of Terraform 1.0, which is intended to provide a foundation that ensures backward compatibility between releases going forward.

    In some instances, Terraform can be too much of good thing. It has considerably accelerated the rate at which IT infrastructure can be provisioned within the context of a DevOps workflow. The challenge, though, is developers often lack the security expertise required to prevent infrastructure from being misconfigured at a time when cybercriminals have become more adept at scanning for those vulnerabilities. To enable IT teams to prevent those misconfigurations, HashiCorp makes available both an enterprise edition of Terraform as well as its Terraform Cloud service. Terraform Enterprise is used by more than 1,200 enterprises, while Terraform Cloud has more than 120,000 users that execute more than 30,000 runs per day.

    It’s not clear if security concerns might one day lead to a backlash against the concept of shifting more responsibility left toward developers to improve productivity. In some cases, developers are simply deploying more insecure applications faster. HashiCorp is making a case for Terraform platforms that allow centralized IT teams to exercise more control over how infrastructure is provisioned as code. The need for that approach is becoming more pronounced, as organizations not only employ Terraform to provision cloud infrastructure but also on-premises IT environments.

    Regardless of how infrastructure is provisioned by developers, security of infrastructure, both inside and outside of the cloud, remains a priority as more workloads than ever are deployed. In effect, the attack surface that needs to be defended has dramatically expanded. Of course, the best security issue of all is the one that never happened because infrastructure is being provisioned right the first time and every time thereafter.

  • What Biden’s Cybersecurity EO Means for DevOps Teams

    What Biden’s Cybersecurity EO Means for DevOps Teams

    On May 12, 2021 President Biden issued Executive Order 14028, also known as the Executive Order on Improving the Nation’s Cybersecurity. This EO covers a lot of ground, and like all executive orders, it instructs agencies of the U.S. Federal Government to perform specific actions. What it doesn’t do is appropriate funding or create industry mandates. That’ll come later, once some of the plenary stages of the EO are complete.

    Despite this, I’m confident that EO 14028 could be as impactful to cybersecurity as GDPR was to data privacy. I’m also confident that the EO has the attention of business leaders who are trying to figure out what it means to them and their teams—DevOps professionals. While the EO has no underlying mandate to private businesses or those located outside the U.S., it does outline a reasonable set of cybersecurity best practices that can be reasonably interpreted as a call to action for greater transparency.

    In this article I’m going to use the terms supplier and buyer, but I don’t mean to imply that money needs to change hands; only that there are producers of software (suppliers) and consumers of software (buyers). If there is one supplier and one buyer, the software supply chain has one link. If that supplier is also a buyer, the chain has two links. For most software, there are many suppliers; in these cases, the supply chain isn’t so much a length of links but more of a mesh of interconnected links.

    The 2021 Synopsys OSSRA report showed that the average audited application had over 500 dependencies, so that mesh is quite complex—to the point where the security practices used anywhere in the mesh are often obscure, at best. It’s this obscurity that attackers can exploit, which is why one of the key tenants of the EO is transparency.

    As anyone charged with operating a piece of software knows, the security testing performed by a supplier isn’t really obvious, but, as a buyer, you assume the supplier has done the right things when it comes to security. But how do you know? Do you know where the code originated from? Do you know what security targets were used by the supplier? If an attacker is actively compromising the application, how would you know?

    These are all very good questions that are reflected in the EO, to varying degrees. Those questions also belie the reality that suppliers test software. Suppliers do, of course, test their software, but what testing techniques did they use and how effective are/were their tools? And, more importantly, how can you confirm that the mitigations and fixes applied to address identified defects were effective for your deployment scenario? After all, it’s not like every supplier is going to provide you with full access to their source code.

    This is where things become quite actionable for DevOps teams that have embraced the principles of operational feedback mechanisms. For those needing a bit of a refresher, that’s the part of the DevOps mobius where lessons learned operating software are fed back into the next iteration of the development flow. Let’s look at two pieces of operational feedback that are mentioned in the EO: least privilege and log management.

    Log management features prominently in the EO in part because logs enable an understanding of how an application is operating. If a supplier provides detailed information about the log structure and flows, it then becomes possible to build alerts in log aggregation services and SIEMs as indications of unexpected operation. That’s the proactive model the EO embraces—as opposed to forensic postmortem log analysis following a breach—but this requires the supplier to provide insights into the log data indicating that the system became compromised. Of course, to provide that type of data, the supplier must have tested their system software in a manner that allows such a log template to be created.

    We’ve heard that software should be developed using principles of “least privilege” for years, but if you’ve ever been asked to run an application as root or had a supplier not detail the precise network ports required by the application, you know there is still work to be done there. The EO specifically calls out cybersecurity techniques like multifactor authentication and zero-trust network access as ways to achieve granular control over how applications operate.

    It is, however, the coverage of Software Bill of Materials (SBOM) that could have the greatest impact for DevOps teams. In effect, the EO stated that suppliers need to tell buyers the origin of all code within an application. While the EO doesn’t specify the elements of an appropriate SBOM, it does instruct NIST to publish the minimum elements of an acceptable SBOM within 45 days of the EO. When combined with the sections on how build environments are created and managed and the security transparency elements elsewhere in the EO, it’s clear that the EO intends to raise greater awareness of how software is created, patched and maintained.

    In the end, Executive Order 14028 sets a high bar for cybersecurity in general—one where everyone involved in the creation and operation of software will need to up their game. I’ve said for years that it’s impossible to patch something you don’t know you’re running, and that remains true. What must be added is that you also can’t reliably secure something when you don’t know how well each component was tested. The EO is prompting us all to take a step toward solving that problem.

  • Digital Customer Experiences: The Future is Modular

    Digital Customer Experiences: The Future is Modular

    With the proliferation of microservices and APIs, will UIs go modular too? Some technologists note a rising trend around smaller, intent-based customer experiences that more directly mirror API endpoints.

    I recently met with Adam Evans, co-founder and CTO of Airkit, to better understand what’s broken with today’s digital customer journeys and how they need to evolve. He predicted that single-purpose experiences will become more pervasive in the future. In the process, we’ll likely encounter fewer native apps and fewer downloads. To enable all this, he’s putting faith in low-code to bring easier integration and automation patterns to more developers.

    The State of Digital Experiences

    Digital customer experiences are becoming increasingly connected and web-based, and at times, disconnected from the core service. In headless environments, end users are engaging with companies through more and more abstraction layers, such as chat, SMS, voice or email notifications. These interactions are increasingly modular and event-driven, noted Evans.

    Increasingly, user encounters are the result of trigger-based patterns activated when user action is required. Not only is the communication style changing, but new devices and platforms have emerged, further making a case for a decoupled development approach. B2C apps become more modular in this transition, presenting experiences built around specific tasks and closely reflecting the specialized microservices or APIs that drive them. Consider the rise of the single page application (SPA) style or AWS Lambda as evidence.

    As more automation and subscription models enable a “set and forget” attitude to commercial software, Evans predicted we’ll likely see more intent- and event-driven workflows emerge. He said these reimagined UIs would shroud platform complexity and, instead, focus on single, specialized actions, like submitting an insurance claim, checking the status of a package or updating your coffee subscription.

    A Broken Customer Journey

    So why would end user digital experiences evolve into more intent-driven applications? Well, complex digital platforms can get feature-bloated very quickly. Bulky applications with many menus are difficult to navigate, thus impacting user experience.

    As Evans describes, generic interfaces often display tons of information irrelevant to the task at hand. “Don’t make me go through generic interfaces to help me do something specific,” he said.

    Clunky interfaces are at odds with small digital tasks that involve an attention span of 20 seconds or less. Evans describes these as “micro touchpoints in our daily lives where you don’t need traditional, large applications.” These actions could be, for instance, looking up COVID-19 infection rates, checking your credit card balance or updating a streaming subscription, he said.

    Organizations have other imperatives to improve user experience, too. For example, if a platform isn’t self-service, it can increase support calls, which can cost a company significant resources. Plus, if the service isn’t event-driven, users must routinely check in of their own accord, which could waste time and encourage tech anxiety.

    Single Page Applications

    In the age of modular microservices, the days of bulky apps and “manual polling” may be limited. To Evans, the solution lies in expressing the “minimum way to represent the transaction of that interface.”

    “How do we keep moving smaller divisions from the back end to the way interfaces are built?” Evans asked. Similar to the way microservices architecture separates domains, Evans noticed UIs segmenting attention along API endpoints. He envisioned more single-purpose experiences being constructed that extend APIs and microservices with a user interface.

    Technically, this may result in more single page applications being developed. Niche UI layers that map APIs would likely carry a data model, Evans described, so that micro apps are delivered with data for entering fields into API calls. As they are web-based, asynchronous single-purpose experiences could also transcend the barriers of app stores and third-party marketplaces.

    Potential Benefits of Modularity

    More intent-based workflows mean less overhead for the user, bringing quicker, more convenient access to the problems they want solved. Sure, users still register with a core service, such as their bank, coffee subscription service or insurance agency for centralized account management. But, users frequent account centers less often, as the periphery of interactions around them continues to grow.

    “The future of apps will look more like individual, intent-based micro apps,” Evans reiterated. These would reflect a metronome of touchpoints Evans called “little moments of delight.”

    Pinging users only when action is required could reduce check-ins, thus reducing digital anxiety. Aside from the user benefits, deployment and maintenance for small applications may be easier to support, said Evans. Lastly, more isolated intentional customer experiences increase engagement, response rates and sales, he added.

    Using Low-Code For Customer Experiences

    Connected digital experiences are relying more and more on APIs. Yet, API integration can be difficult, even for experienced programmers. So, how do we make it easier for people to build interfaces to hit these APIs? Building user-facing layers on top of APIs will require great developer experience, says Evans.

    Lately, low-code has been dominating these discussions. With greater emphasis on visual-driven development, low-code is empowering non-technical employees. To Evans, low-code capabilities will be essential to influence how future customer journeys are constructed.

    Evans noted how low-code “changes the whole game around how apps are built.” For example, branded experiences often require reusable code and common libraries, all of which low-code platforms excel at. In addition, when working with APIs, a “layer over REST design is essential to maintain state and enable long-term processing,” he said.

    Will The New Digital Journey Go Micro?

    Complex interfaces seem to work for conglomerate giants like Amazon. But other scenarios may benefit from more single-purpose workflows. As platforms become more extensive, the user interactions need to become leaner to avoid added stress. As a result, Evans predicts that micro, trigger-based B2C touchpoints will become more common in the coming years. In this paradigm, better UI extensions of common APIs could help bring people into the equation.

    “We’ll see a lot of cool stuff in the next decade,” he said. “Future apps won’t look like what past ones looked like.” As IT moves to support new, multiple channels, such as chat, voice, web and VR/AR, our perception of what an application is also will inevitably alter.

    In tomorrow’s “great unbundling of apps,” as Evans called it, “if you don’t use it every day, there’s a pretty good chance it doesn’t need to be there.”

    There are many schools of thought on the best methods to retain quality user experiences. Do you think modularity is the answer? What do you think tomorrow’s digital experiences will look like? Feel free to let us know in the comments below.

  • Fixing Risk Sharing With Observability

    Fixing Risk Sharing With Observability

    Incentives are mismatched among SREs, SecOps, and application developers. These mismatches create challenges around how and what information is shared across siloed teams. This asymmetrical information creates a moral hazard where one team can shift deployment risk to another team, with no accountability back to the originating team. Risk shifting results in unstable applications, inefficient infrastructure, security issues and poor customer experience. All of that impacts your company’s bottom line.

    Closing the Information Gap

    Observability is positioned as a way to fix the information gap between these disparate groups. Observable systems allow users to ask questions about their behavior in an open-ended way, unlike more rigid monitoring systems. SREs and SecOps teams are already reaping benefits from observability, but mismatched incentives limit its effectiveness. Meeting the observability expectations of IT leaders requires pervasive instrumentation across applications, infrastructure and third-party software. Delivering that level of instrumentation has remained out of reach due to incentive mismatches, as well as human and infrastructure costs.

    The main incentive for developers is shipping code quickly at a reasonable level of quality, meaning a low bug count. This contrasts with SREs, who are incentivized around uptime, performance and efficiency, while the incentives for SecOps teams are around risk reduction and breach mitigation.

    risk sharing observability

    Since SREs and SecOps teams don’t have insight into what developers have changed, it’s easy for performance or security problems to get thrown over the fence to operations. A fresh code push might only include minor changes and be harmless to existing operations. Or, it could replace large chunks of logic across the entire codebase, including adding calls to external and third-party applications. To the intrepid SRE and SecOps teams, one change looks like any other. They don’t get a peek behind the curtain because of the mismatched incentives. DevOps wants to deploy quickly. Waiting on approval from other teams slows down deployments, so comprehensive reviews don’t happen. This doesn’t mean DevOps teams are intentionally trying to sabotage partner teams. They’re simply acting in their own interests based on their incentives.

    The challenge is that one party, the developers, has more information than other parties. That information asymmetry is what creates unbalanced risk sharing. Coping with information asymmetry has led to all kinds of new collaborative models, starting with DevOps and evolving into DevSecOps and other permutations like BizDevSecOps.

    True collaboration has been hard to come by. Early DevOps efforts are often successful, but scaling beyond five to seven teams is difficult because teams lack the breadth of experience in IT operations or the SRE capacity to staff multiple product teams. The change velocity DevOps teams can achieve is often far greater than SREs and SecOps can absorb, making information asymmetry worse.

    If teams can’t maintain high levels of collaboration and communication, another option must be developed. Observability practices, like collecting all events, metrics, traces and logs, allow SREs and SecOps teams to interrogate applications about their behavior without knowing which questions they want to ask ahead of time. However, observability only works if applications, and the infrastructure they rely on, are instrumented. This creates another problem: who does the instrumentation?

    The expectation is DevOps teams embed instrumentation into their code as part of the development process. While that’s a nice idea, there are four reasons this falls short. First, the quality of instrumentation varies. Many log statements are terse and only understandable by the developer that wrote them. The message “In function xyx123!” isn’t helpful to an SRE digging into a performance problem that cropped up in the latest release.

    Second, instrumentation libraries vary by implementation, giving inconsistent results across language bindings. OpenTelemetry is trying to improve this, but its progress is slow and still requires developers to do more work that, if we’re honest, doesn’t benefit them; it benefits SREs and SecOps. Now we’re back to those pesky mismatched incentives and information asymmetry problems again.

    The third problem with instrumentation is the volume of data. Each instrumented application can produce terabytes of data each day. When you have robust instrumentation, the amount of data can be overwhelming, and extremely costly to analyze and store.

    Lastly, instrumentation is isolated to the code your team wrote. That represents a fraction of the code you rely on. Vendor-provided services and APIs remain a black box, limiting your observability into those components.

    Resolving information asymmetry across teams requires two things:

    1. Pervasive, pluggable instrumentation capabilities for all code that doesn’t require developer involvement, and
    2. An observability pipeline to filter, redact and enrich data, then route it to your analytics platform of choice.

    Pervasive Instrumentation

    Operations teams need instrumentation without having to go back to developers and beg them to add it to existing code. They need to turn it on and off as needed, and they need readily consumable data. They also need every piece of data they can get, including packet payloads, insight into encrypted data and so on. This goes well beyond what’s possible with today’s instrumentation options.

    AppScope, a newly released open source project, is a new take on instrumentation. AppScope interposes itself between application threads and system libraries, tracking things like file system access, network and HTTP activity, as well as CPU and process activity. It also provides payload data, and because it sits between the application and encryption libraries, it also gives access to users’ cleartext data. Because it works with any Linux binary, SREs and operations teams can instrument anything, even code they didn’t write.

    Observability Pipeline

    The challenge with pervasive instrumentation is dealing with all the data generated by applications. Network, file system, and other system data can easily swamp destination APM and log analytics platforms, driving up licensing and infrastructure costs. While instrumentation data is vital to rebalancing risk sharing in organizations, you need a way to manage that data intelligently to get value out of it. This is where the observability pipeline comes in.

    An observability pipeline sits between the sources of observability data and its target destinations. By acting as a strategic control point, the pipeline gives users control over how data is formatted, filtered, enriched, and redacted before it is routed to one or more destinations.

    Observability pipelines help SREs and operations teams deal with the flood of instrumentation data by routing low value data to low-cost storage, like S3, while higher value information lands in APM and log analytics tools. Later, if you decide you need the data stored in S3 to add more context to your analysis, you can replay it back through the pipeline and enrich your data set.

    Shifting business priorities are accelerating the pace of technology deployment across organizations, and teams are pressured to deliver faster. This faster pace of delivery pushes deployment risk to operations and security teams that lack visibility into changes developers have made across complex distributed systems. This information asymmetry also increases risk to the business as applications become less predictable and reliable over time.

    Traditional methods of resolving the information mismatch haven’t worked because incentives across teams aren’t aligned. Adopting pervasive instrumentation and observability practices will give SREs and operations teams critical visibility into rapidly changing application and infrastructure environments, without disrupting the developer experience and process.

  • Chicken Soup for the SLO

    Chicken Soup for the SLO

    Since time immemorial, humans have struggled to communicate. From myth to the modern era, our most memorable stories often involve individuals or groups seeking to be understood in order to avoid conflict. Be it the biblical allegory of Babel to the more recent Star Trek: The Next Generation episode of “Darmok,” a deep fascination with how people communicate seems to have collectively gripped our imaginations.

    It should come as no surprise, then, that communication between disparate teams and roles in the development of distributed software systems is a fascinating topic. There’s an almost primal struggle in the workplace—a dichotomy between “features” and “stability”—that teams have sought to overcome for decades. Indeed, much of the discipline of software engineering has implicitly evolved as a response to the needs of engineers to communicate with other parts of the business.

    How, then, do we improve this communication and build empathy toward our fellow developers, our coworkers, our PMs, our managers? We need a way to communicate with them, to express “how things are going,” how reliable our service or system is. Let’s step back, though, because this is only a small window we’re looking through—we need to communicate these desires and goals to a greater audience; Our bosses, their bosses, our customers, the entire world. Organizations rise and fall on their ability to communicate effectively.

    In the natural sciences, we observe that the tendency of a system is towards entropy; Energy tends to dissipate in the absence of a constraint. So, too, do human systems lose productivity as their scale and complexity increases. The rise in popularity of Agile methodologies and DevOps thinking tracks with this. They are, ultimately, designed to help us communicate better about needs and priorities. Site reliability engineering (SRE) is the latest in this line of disciplinary developments, providing rigor to the question of, “How do I operate very large scale systems in dynamic environments?”

    One of the more popularized elements of the SRE playbook is the concept of the service level objective, or SLO. To excerpt the excellent Implementing Service Level Objectives by Alex Hidalgo, a SLO is “a proper level of reliability targeted by a service,” a calculation of the amount of ‘bad’ events that can occur as part of the normal operation of a service. As Alex notes, the idea of SLOs and SRE have become almost inseparable in our collective consciousness—organizationally, it’s seen as strange to have one without the other.

    Let’s dive a bit deeper into what an SLO actually is. Again, I will excerpt and paraphrase from Alex’s book (it’s very good; you should read it if you’re interested in this topic). A SLO is simply a target, a set of defined criteria that represent some objective that you’re trying to reach. In a very general sense, the SLO expresses the threshold of ‘good’ to ‘bad’ events that you’re willing to tolerate over a time period. This simple ratio, however, unlocks a great deal of interesting and important ways of thinking about performance and reliability. It gives you, and your team, the ability to reason and communicate about reliability in a very quantitative and qualitative way.

    Now, you may be asking yourself what the qualitative component of a SLO is—after all, aren’t these measurements quantitative by definition? It’s in this dichotomy that I believe the true power and utility of SLOs lie; they’re not just a measurement of what you’re doing, they’re a communication vehicle for how you’re doing. Error budgets come out of this line of thinking—they represent the space between the current state of your SLO and its boundary.

    In plainer terms, it’s a measurement of how much you can miss your target before it becomes a problem. If my SLO targets 99% reliability, I have about three and a half days of unreliability a year to play with—or, about 14 and a half minutes a day. This way of measurement is certainly helpful in driving and determining engineering decisions, as it allows us to make snap judgements about how to prioritize the seemingly opposing buckets of “feature work” and “reliability work.” If we’re getting close to burning up our error budget for the month, do more reliability work. If we’ve got slack, do more feature work. Easy, right?

    How to Make Friends and Influence Budgets

    Reliability, SLOs, error budgets—these are all helpful ways to quantify performance and availability in software. There’s another way to consider them, though, and it’s through the lens of risk. If you’ve earned an MBA, you’re probably familiar with a ‘risk heat map.’

    SLO heatmap

    The x-axis on this quadrant represents the likelihood of a problem occurring; the y-axis represents the importance of that element. This is generally extensible to any element of a business—everything from your sales force to your customer success team to the availability of your data center or cloud resources.

    In many ways, this simple quadrant is responsible for many of the decisions that influence your work. While a business does many things, the business of operating a business can be thought of as an ongoing and unceasing process of risk management and abatement.

    The stuffy, MBA-fueled world of Six Sigma and process management doesn’t play terribly well in the more creative arenas of software development and maintenance, I’ve found. Much of this has to do with—you guessed it—risk. In manufacturing, the costs of failure or defects can be extremely high. Component defects can sideline million or billion dollar supply chains; projection and planning failures can disrupt just-in-time inventory and a single stuck ship or sudden winter storm can cause months or years of disruption to national or global economies. We should count ourselves fortunate that the actual costs of failure in a software system are so light; while us-east-1 going down for an hour would be bad, it probably wouldn’t wreck the global GDP for six months.

    The translation of ‘lower-level’ concerns, such as software system reliability or employee turnover, into ‘higher-level’ risk concerns acts as a curtain between the operational and the managerial aspects of a company. It is this curtain that we must consider when thinking about the true advantages, and the revolutionary potential, of SLOs. Remember, a SLO represents a ratio between ‘good’ and ‘bad’ and gives us a threshold value. These SLOs can be overlaid onto our risk maps extremely easily; SLOs for more critical services and processes rise to the top, newer services move to the right.

    In essence, we can give our SLOs a qualitative score with regard to overall business risk, and use this to shape the overall business direction. This is crucial, as in the absence of better qualitative measurements, businesses will often grasp at quantitative reliability measurements—“pages fired or tickets opened,” to quote Hidalgo. He continued, “[T]hese are prone to be inaccurate due to false positives or the whims of the people opening the tickets.” The types of measurements that we often rely on, such as categorization by severity or ‘mean time to x’ fail to accurately classify reliability or how it impacts the user experience.

    Let’s illustrate by example—a huge part of conversations about SLOs is talking about how they should be framed in terms of users; happier end users, happier engineers, happier managers and so forth. SLOs that correspond to user journeys—for instance, “Adding an item to the cart succeeds 99% of the time.”—are straightforward to understand from the perspective of an end user. We can discuss this in terms of risk by applying an importance and likelihood score to the SLO itself. If our site is an e-commerce platform, then the importance of the cart is very high. Since our threshold is very small (1%), then the likelihood of this risk is also very high—we don’t have a lot of wiggle room!

    A SLO for a targeted ad service might read, “A contextually appropriate display ad is served within 30ms 90% of the time.” In this case, our ad business might not be of high importance in terms of our business risk, so we should reduce the importance of the SLO. In addition, our threshold is very large, so we should reduce the likelihood of violation (since we have a lot more wiggle room). Over time, these positions and scores can (and should) change—perhaps the advertising segment of our business becomes more valuable, so we re-prioritize it on our risk maps.

    By speaking this language and quantifying our data in different ways, we can pull back the curtain between operational and managerial sectors and use it to influence things outside our immediate sphere.

    “Mommy, why is there a SLO in the house?”

    There’s an aphorism about war and fighting that goes, “Generals are always prepared to fight the last war.” I’ve seen this myself at every company I’ve worked for over the years—we tend to be reactive, rather than proactive, in planning and preparing for strategic business challenges. Some of this is due to the fact that none of us are oracles capable of divining the future, but much of it simply has to do with the aforementioned cycle of risk management that drives business planning and decision making. When introducing SLOs to a wider audience, you need to be able to plan for the pushback that executives and managers will almost certainly have to this new way of thinking.

    When you think about it, though, there’s not a lot of difference between what an SLO is trying to represent, and what an OKR or KPI or any other goal-oriented system is trying to represent. In each case, we’re creating some heuristic to sort events into ‘good’ and ‘bad’ cases, then creating a threshold of ‘Now there is a problem’ based on the ratio between them. In essence, this is, really, how you measure anything as a percentage.

    You could translate goals for your sales, marketing, customer success or people ops teams into SLOs. For example, “30% of POCs should convert into closed-won opportunities” is, basically, an SLO already, and is perhaps an existing goal for your salesforce. There are two big advantages to thinking about these as SLOs: consistent reporting and error budgets.

    Consistently reporting on SLOs means that you can express team and company goals in the same format and language across the entire organization. This brings teams together in a shared purpose, and allows for a shared language about how reliability benefits everyone. Being able to roll up reporting about how things are going not only encourages more shared ownership of goals, it helps you build connections and linkage between how different types of work align with each other towards a shared prosperity. More importantly, SLO reporting gives extremely clear signals about how teams—regardless of their function—should be addressing failure.

    If a consistent language around reliability is what builds empathy, error budgets are what unlocks creativity and problem solving for addressing issues in the business. In too many cases, organizations are loathe to give individual contributors, or even teams, the flexibility to experiment and measure the results of those experiments due to inertia, top-down command-and-control style processes or just the fear of screwing up.

    Let me give you an example—suppose your marketing team has a demo that generates a certain percentage of leads every month. Without a defined SLO for this demo’s performance, it becomes extremely difficult to change anything about how this demo works. Why? Because there’s a tendency for things to settle at their current state—we’re all so consumed with moment-to-moment crises or new work that evaluating the performance of existing things can be challenging.

    The work required to justify a change eventually outweighs the actual work being done to make the change, and so change withers on the vine and processes stagnate. Now, imagine that this demo flow had an SLO associated with it, something like “10% of clicks to our demo should result in a valid email capture.” Suddenly, we can report on this in a consistent fashion and, more importantly, we have a massive amount of headroom for experimentation. We can justify work being done to improve this flow in the context of not only its current status (are we running better or worse than our target?) but also in the context of our other goals (are we producing enough MQLs, in general, to support the sales funnel?) and prioritize appropriately.

    Ultimately, we can’t change the fact that there’s a bias towards dealing with the last thing that happened, but that’s not really the point. What we can change is how we think about expressing what’s happening now, and building a consistent language and verbiage around addressing these problems. SLOs are designed, broadly, as a way to communicate the reliability goals of complex distributed software systems. What is a business of people other than a complex distributed human system?

    As thinking, tooling, and processes around SLOs continue to mature (such as the recently announced OpenSLO specification), I’m excited to see what the future has in store for us. At the end of the day, we should be striving to reduce hierarchy, increase autonimity, and build collective ownership in the socio-technical systems that we rely on as human beings; SLOs are just another piece of this ever-evolving puzzle.