
Category: Blogs

  • Splunk Expands Scope of Observability While Lowering Costs

    Splunk Expands Scope of Observability While Lowering Costs

    During its online .conf21 conference Splunk Inc. today revealed a bevy of updates that advance observability while at the same time reducing the total cost of deploying its platforms.

    As part of that effort, Splunk also announced it will now make workload-based pricing available to all customers.
    Previously, a select number of small customers had access to workload-based pricing while other customers licensed Splunk platforms based on how much data was loaded into the platform. That approach, however, tends to discourage IT teams from loading as much of their data as possible.

    CEO Doug Merritt said workload pricing was created to enable a value-oriented pricing model that customers could employ instead of a data-centric model that can discourage IT teams from analyzing as much data as possible to improve IT operations.

    To further lower total costs, the company is also previewing a Flex Index option for customers that choose workload-based pricing to enable longer retention for lower-value data at a lower cost. Splunk is also expanding its cloud storage to include a preview of SmartStore, which allows larger volumes of data to be stored more cost-effectively on Microsoft Azure Cloud initially with support for Amazon Web Services (AWS) and Google Cloud Platform (GCP) forthcoming.

    Other enhancements to the portfolio include a preview of a data manager, a revamped onboarding tool for data stored in Amazon Web Services (AWS) and Microsoft Office 365, and Ingest Actions, which enables IT teams to act on data in motion in addition to data at rest stored in Splunk or the S3 cloud service from AWS.
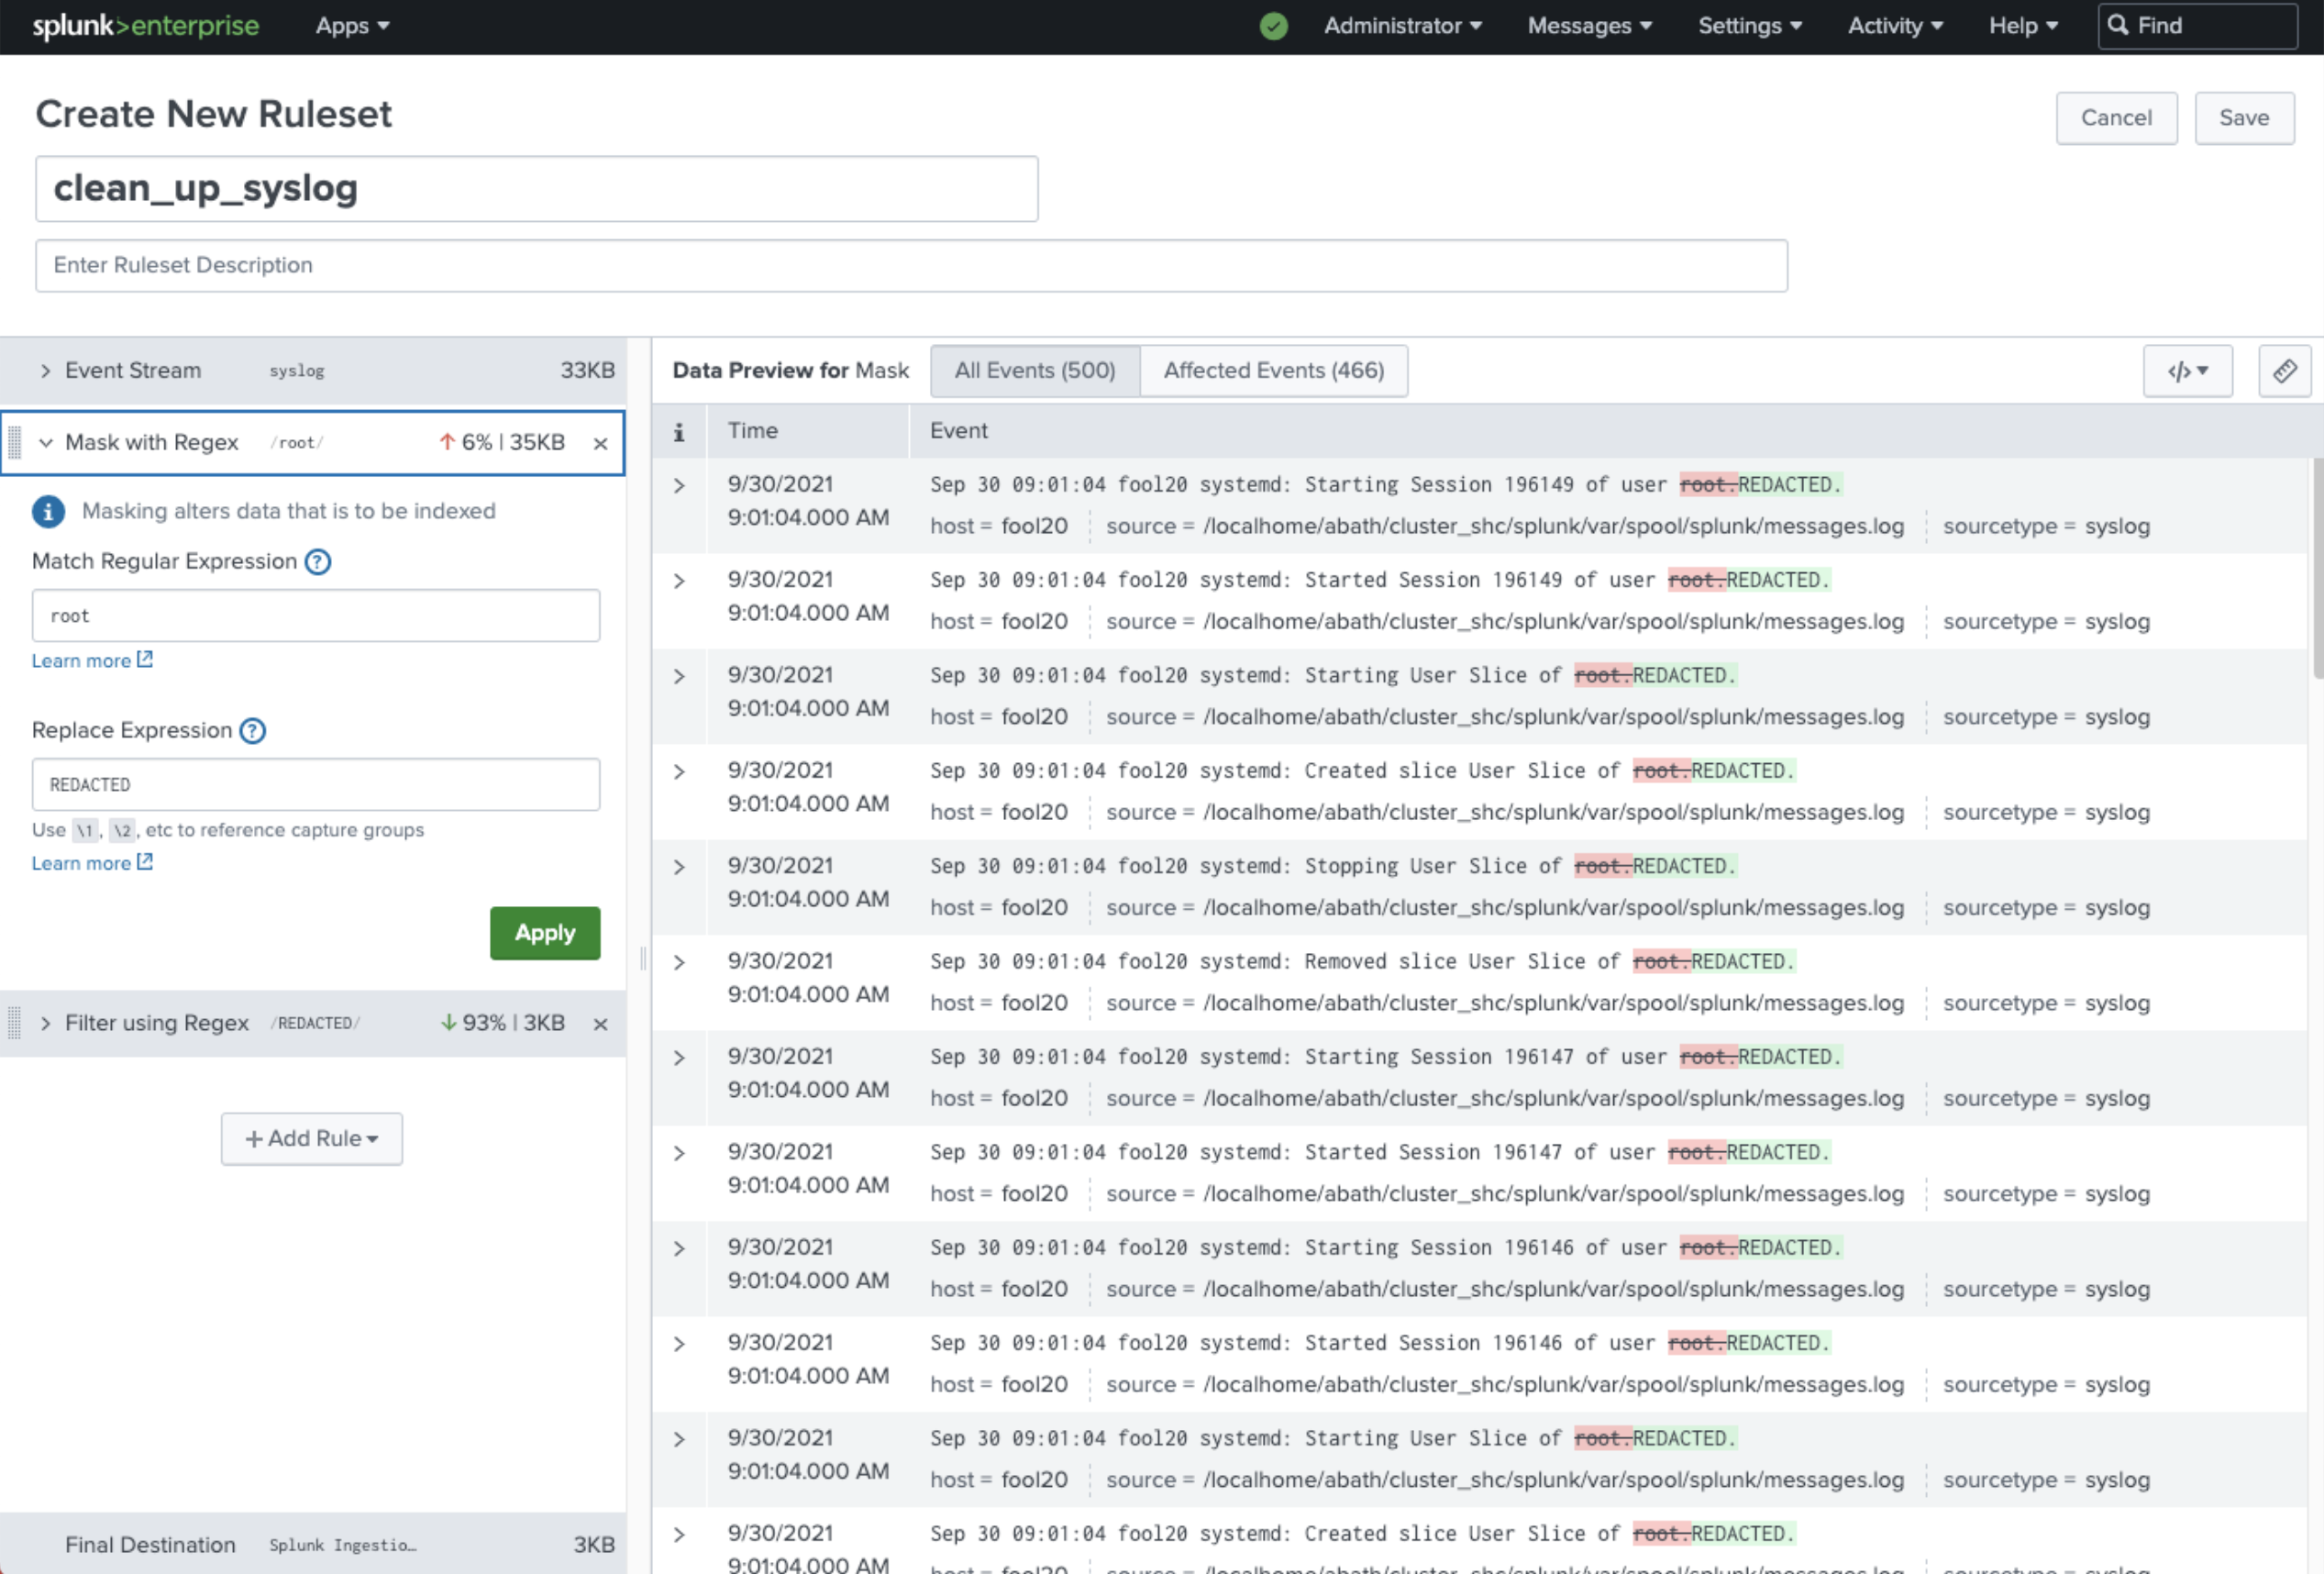
    The company is also now making it easier to find and explore data via a federated search tool and a Splunk Dashboard Studio offering, available via Splunk Mobile, that makes it easier to create dashboards.

    At the same time, the company is also making available Splunk Operator for Kubernetes to make it easier to install its platforms in cloud-native environments. There is also now Splunkbase, a curated catalog that makes it simpler to find or develop a Splunk application.

    In terms of observability, the company is providing a preview of AlwaysOn Profiling for its application performance management (APM) platform, dubbed Splunk APM. AlwaysOn Profiling extends existing tracing capabilities to provide continuous code-level visibility and analysis.

    In addition, there is now a preview of an enhanced version of Database Visibility for Splunk APM, which automatically uncovers slow queries that are causing transaction latency without having to instrument a database.

    The company also announced that its real user monitoring (RUM) for mobile applications, which makes use of open source, now is generally available alongside the Splunk Observability Cloud for Mobile platform. The company also revealed there are previews of integration between Splunk Log Observer and Splunk Enterprise and Splunk Infrastructure Monitoring AutoDetect, a tool that automatically discovers infrastructure anomalies. There are also now additional Content Packs for managing Microsoft365, third-party APM tools and synthetic monitoring.

    Finally, Splunk has expanded its security portfolio to include Splunk SOAR App Editor, which provides a way to edit, test and create security orchestration, automation and remediation (SOAR) applications. There are now more than 350 SOAR apps now available on Splunkbase. The company also launched Splunk Intelligence Management based on a platform it gained with the acquisition of TruSTAR earlier this year and that it is making available security services via a team of experts dubbed SURGe.

    It’s not clear to what degree these additions will enable Splunk to fend off what has become a larger number of rival providers of observability platforms. However, as one of the most widely used IT operations management platforms in the enterprise, it’s clear Splunk enjoys an incumbent leader status it is determined to maintain.

  • A Blueprint for Securing Software Development

    A Blueprint for Securing Software Development

    Software development has changed dramatically in recent years, as technologies like DevOps, application containers, and cloud-native transform how software is built and distributed. Unfortunately, attackers have been paying close attention to these changes, and have retooled their attack strategies to take advantage of relatively weak security controls in software development and build environments. Attackers recognize that security teams are more focused on protecting infrastructure and less focused on software development and supply chains. This is how damaging attacks like SolarWinds happen – and it’s likely that attackers will strike again to yield even more successful outcomes.

    A new approach is needed to secure the software development pipeline. What’s more, this approach needs to be put in place by the engineers developing the software—and not by information security teams. Engineering teams need to be responsible for design and implementation while giving security teams visibility and assurance that controls are operational and that policies are being enforced.

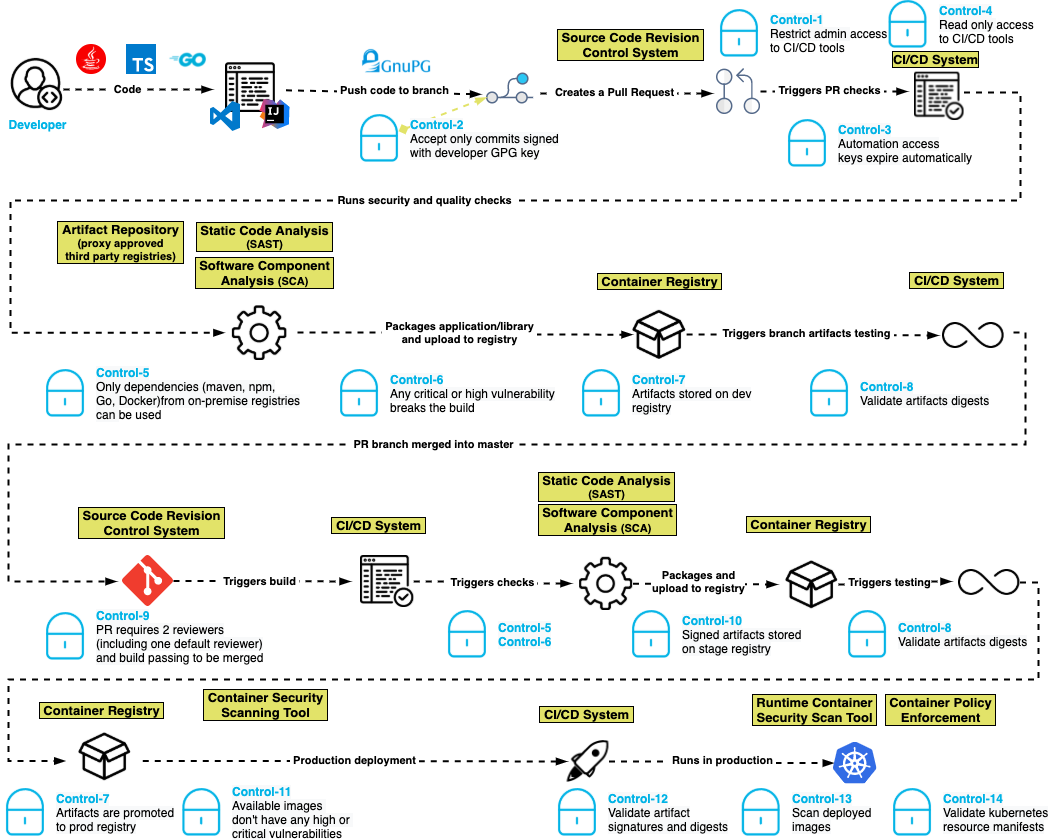
    A new blueprint for securing the pipeline centers on a flexible set of controls that secure the software build pipeline by ensuring that authentication and authorization are properly managed, that the integrity of software artifacts are tested at appropriate stages and that controls are placed on third-party and open source solutions incorporated into the software. The result: Software innovation and delivery at lower risk of supply chain tampering, and reduction of attacks during development.

    A Pragmatic Design Philosophy

    This modern software security blueprint is based on the following design philosophy:

    • Least-privilege: Only grant the access and permissions required to accomplish a job, and no more.
    • Immutability: Artifacts and infrastructure are not modified after deployment to an environment. If a change is required, it’s done in the image or script in the development environment and then promoted through the higher environments.
    • Everything-as-code: Infrastructure, security policies and other parts of the pipeline are also implemented as code and subject to the same controls as the software artifacts.
    • Traceability: All changes, whether to infrastructure or business code, are version-controlled. 

    Controls Blueprint for Software Development Pipelines

    The basis for this software security blueprint centers around a set of 15 controls that are built for modern development pipelines where developers, pipelines and execution can happen anywhere in the world.

    Control one: Restrict administrative access to CI/CD tools. Ensure that only authorized people can make administrative changes to the CI/CD system, which prevents unauthorized changes to pipeline definitions.

    Control two: Only accept commits signed with a developer GPG key. Unsigned code commits are challenging, if not impossible, to trace and pose a risk to the integrity of the codebase. 

    Control three: Automation access keys expire automatically. By ensuring that access keys used by automation expire periodically, developers create a shorter window of attack when keys are compromised.

    Control four: Reduce automation access to read-only. CI systems should have read-only access to source code repositories following the principle of least-privilege access.

    Control five: Only dependencies from trusted registries can be used. By configuring the dependency manager to only allow connections to an authorized list of registries, attacks can be blunted by keeping malicious packages in public registries from entering the pipeline.

    Control six: Any critical or high-severity vulnerability breaks the build. Supply chain attacks may introduce code with vulnerabilities into the software pipeline. Static application security testing (SAST) helps to identify serious security issues, including poor cryptographic practices, hard-coded credentials and injection vulnerabilities. 

    Control seven: Artifacts are stored in a repository in development, staging and production. This control helps to enforce the immutability of the artifacts so they can be compared in the development, staging and production repositories.

    Control eight: Validate artifact digest. Before an artifact is deployed in any environment, its digest should be validated against the artifact in the repository to ensure that it has not been compromised.

    Control nine: Pull requests require two reviewers (including one default reviewer) and a passing build to be merged. In addition to supporting good coding practices, this control also helps ensure that no commits are made without competent human oversight. 

    Control 10: Artifacts in higher repositories are signed. Requiring artifacts to be signed in a repository throughout the process ensures visibility and traceability for whatever is deployed to production. 

    Control 11: Available container images don’t have any high or critical vulnerabilities. Just as applications need to be tested for vulnerabilities before being placed in production, so do the container images into which they are packaged for deployment. Container images could have open source vulnerabilities if they contain open source software. 

    Control 12: Validate artifact signatures and digests. Validating the signature of the artifact against the digest ensures that the artifact was not tampered with in the repository and that the artifact being deployed is the same one that was tested.

    Control 13: Scan deployed images in production. This helps to ensure that the prior controls were followed for all software in production.

    Control 14: Validate Kubernetes resource manifests. If the resource manifests are tampered with, they could be tricked into deploying a container of the attacker’s choice. 

    Control 15: Ensure build environments are ephemeral and immutable. Build environments should be defined in code with automated creation and teardown and a fresh environment created for every build. Build hosts should not be accessible using interactive logins.

    We believe this blueprint provides engineering teams with an actionable architecture that security teams can rally behind and support. By adopting these standards, engineering teams are promised the delivery of assured software at lower risk of supply chain tampering, reduction of attacks during development and manipulation in staging and production.

    Here’s what it looks like:

    blueprint

    To learn more about the suggested blueprint, read our GitHub post about the project. Our goal is to prioritize speed and agility for software development while incorporating a security-always mindset.

  • Splunk Donates eBPF Telemetry Data Collector to CNCF

    Splunk Donates eBPF Telemetry Data Collector to CNCF

    Splunk Inc. announced during the KubeCon + CloudNativeCon North America conference that it donated a data collector to the OpenTelemetry project run by the Cloud Native Computing Foundation (CNCF).

    Splunk’s data collector runs as a sandbox-level program at the kernel of a Linux operating system and takes advantage of extended Berkeley Packet Filter (eBPF) technology to make it simpler to collect networking telemetry.

    The OpenTelemetry initiative itself spans a range of open source tools, application programming interfaces (APIs) and software development kits (SDKs) that are used to instrument applications. Previously, Splunk contributed the SignalFx Smart Agent and Smart Gateway to the OpenTelemetry project along with more than 64,000 code contributions.

    Morgan McLean, a director of product management for Splunk, said that while OpenTelemetry is officially in beta, some elements of the project are more mature than others. For example, tools for capturing metrics and traces are already being employed, while another set of tools for capturing log data will be ready sometime next year, he said.

    The data collector contributed by Splunk is among the first that operate at the kernel level to collect data, added McLean. That approach makes it possible for some types of data to be captured by default rather than requiring developers to always instrument their applications using agents to enable an observability platform. It will also contribute toward the eventual convergence of network operations and DevOps processes.

    Going forward, DevOps teams should expect to employ a mix of open source data collectors that operate at both the eBPF and application level, said McLean. The eventual goal is to instrument every application by default by making it much simpler to collect data. Today, most DevOps teams are employing a mix of proprietary and open source agent software to collect data that then must be deployed and then integrated with all the applications they build. Given the cost and level of effort required, the percentage of applications that are actually instrumented is, not surprisingly, fairly low.

    However, as agent software becomes more readily accessible, the percentage of applications that are instrumented should increase considerably in the years ahead. For DevOps teams that depend on that data to optimize application performance, that capability should prove to be a boon for improving overall observability in IT environments.

    Observability, in one form or another, has always been a core tenet of any DevOps best practice. Initially, DevOps teams focused on continuous monitoring as the most effective way to proactively manage application environments. However, it can still take days, sometimes weeks, to discover the root cause of an issue.

    Monitoring focuses on predefined metrics to identify when a specific platform or application is performing within expectations. The metrics tracked generally focus on, for example, resource utilization. Observability platforms combine metrics, logs and traces—a specialized form of logging—to instrument applications in a way that makes it simpler to troubleshoot issues without relying on a limited set of predefined metrics focused on a specific process or function.

    Those observability platforms then make it possible to correlate events so that it is easier to identify anomalous behavior indicative of an issue’s root cause. Armed with these insights, it becomes a lot simpler for IT teams to resolve issues faster.

    It’s unclear when OpenTelemetry tools will become more widely employed, but as more tools for collecting data become available, the impact on DevOps will be nothing short of profound.

  • Why Observability and Monitoring Matter to SREs

    Why Observability and Monitoring Matter to SREs

    Site reliability engineers, or SREs, do many things. They help developers build reliability into applications. They manage SLAs and SLOs. They play a leading role in incident management and incident response.

    For all of these tasks, SREs draw heavily on observability and monitoring. Although other parts of the IT organization also typically help to manage observability and monitoring, it’s virtually impossible for SREs to do their jobs effectively in today’s cloud-native world without observability and monitoring tools and data.

    Here’s what observability and monitoring mean, why they’re so important for SREs in particular and how SREs can systematically measure the success of their monitoring and observability practices.

    Defining Observability vs. Monitoring

    Monitoring is the collection of data from applications, infrastructure or other IT resources to track the status and performance of those resources. Monitoring has been a core IT practice since the late 1990s when the first modern monitoring tools, such as Nagios, appeared.

    When compared to monitoring, observability is more intensive. Observability is the collection of discrete types of data from multiple systems and the correlation of those data sets to achieve actionable visibility into IT resources. One thing to note: Observability has a more technical definition in the field of control theory that has to do with using external outputs to make inferences about the internal state of a system; however, when people talk about observability in the context of IT and SRE, they usually mean the collection and correlation of broad sets of data in order to understand complex systems.

    The debate about the differences between observability and monitoring is ongoing, but the consensus is that they boil down to:

    • What versus why: Monitoring helps SREs determine that a problem exists. Observability goes further by allowing them to understand why it exists.
    • Context: Observability provides context around what is wrong with a system. Monitoring, for the most part, offers surface-level information about the existence of a problem.
    • Actionability: Observability empowers SREs to respond effectively to outages, performance degradations or other problems. Monitoring merely lets them know that something is wrong and that it may require intervention.

    In most respects, monitoring is one step in the greater observability process. But observability involves additional practices, such as the correlation of various types of data, to achieve a level of context and actionability that monitoring alone can’t deliver.

    Why SREs Should Understand Observability

    Again, observability has become a core practice for engineers in a variety of roles. Developers can use observability tools to help measure and optimize application performance before deployment. IT engineers can leverage observability to gain visibility into issues that exist in a production environment. Observability tools can help QA engineers determine why an application failed a test.

    But no group has more to gain from observability than SREs. Given that maximizing the reliability and performance of systems is the core mission of SREs, the ability to not just detect problems via monitoring but also to understand them through observability is critical for modern SRE teams.

    That’s all the more true for SREs tasked with managing reliability for complex systems, like those based on microservices. In complex applications, identifying the root cause of a reliability issue—such as which specific microservice contains buggy code or which type of request triggers a performance bug—can be very difficult. By maximizing context into reliability problems, as well as allowing teams to trace requests across complex, distributed systems, observability places SREs in the strongest position to find and fix reliability problems quickly.

    What’s more, beyond detecting issues in systems that have already been deployed, SREs can also leverage observability tools to help build reliability into applications before they are put into production. By observing applications in dev/test environments, SREs may be able to identify reliability risks and then use that insight to find ways to make the application inherently more reliable. Observability might reveal reliability weaknesses that stem from an application’s architectural design, for instance, or from the orchestration tool that manages the application.

    How to Measure Observability and Monitoring

    Getting the most from observability and monitoring requires systematic measurement of observability and monitoring initiatives. It’s only by collecting metrics about observability and monitoring outcomes that SREs can ensure they are improving reliability rather than merely collecting and analyzing data to no particular end.

    While a full discussion of observability and monitoring measurement is beyond the scope of this article, consider the following types of metrics for assessing these practices:

    • Incident frequency: How often do incidents (especially severe incidents) occur that impact production systems? Ideally, SREs will see a decrease in incident frequency that correlates with increased use of observability and monitoring tools.
    • Rollback frequency: The less often an application release is rolled back to a previous version, the more effective the SRE team’s observability and monitoring practices likely are.
    • Mean-time-to-remediate (MTTR): MTTR is a measure of the overall time it takes to resolve a reliability problem. It reflects how well you monitor (which determines how quickly you detect problems) and how well you observe (which is the key to resolving problems).
    • Total data analyzed: Tracking the total volume of data that you collect and analyze through observability and monitoring tools helps you assess the overall scope and scalability of your practices.
    • Total systems analyzed: In addition to tracking total data volume, consider measuring how many discrete applications, hosting environments, CI/CD tools and other systems you are managing as part of observability and monitoring workflows.

    The ultimate goals of SREs extend beyond observability and monitoring. However, observability and monitoring serve as essential means to the broader ends that SREs are tasked with achieving: Maximizing uptime and performance. And while monitoring alone was once sufficient for supporting the goals of SREs, it’s very difficult to imagine an SRE team today that doesn’t also make extensive use of observability, which takes monitoring to the next level.

  • Welcome to the New Field of Software Supply Chain Management

    Welcome to the New Field of Software Supply Chain Management

    Supply chain management is the newest ‘shiny object’ in both the DevOps and DevSecOps communities. But what does it mean in relation to software development?

    Historically, supply chain management is a commerce term that refers to tracking the logistics of goods and services moving between producer and consumer. This would include the storage and flow of raw materials with a focus on the channels that support the process.

    When we look at this concept from the perspective of software development, we will soon see that it is a new form of software configuration management. Yes, the new SCM is … SCM. The core of supply chain management is the process of controlling changes in software. The new SCM expands those old practices to include all ‘raw materials’ which we manage as part of our software build and package steps. For instance, when companies purchase and download open source libraries used in their in-house software. Supply chain management includes the interrogation of these ‘raw materials’ as well as all of the internal code and libraries. We will soon be hearing more about software bill of materials (SBOM) reports and difference reports, as they are critical for understanding the objects that flow through the software we create.

    The software supply chain or software configuration management practice hasn’t been talked about much until recently. This area of expertise has never been ‘sexy.’ That is, until the SolarWinds supply chain hack. The SolarWinds hack was a hard lesson to learn, but it taught us to take a closer look at how we consume our raw materials and to be more serious about how we build and package our software.

    According to FireEye, the firm that discovered the backdoor supply chain hack:

    “SolarWinds.Orion.Core.BusinessLayer.dll is a SolarWinds digitally-signed component of the Orion software framework that contains a backdoor that communicates via HTTP to third-party servers. We are tracking the Trojanized version of this SolarWinds Orion plug-in as SUNBURST.”

    It was obvious, something went very wrong with the creation of that .dll. I don’t pretend to fully understand how this breach occurred. But I do understand the build process and have been talking about the potential for these types of breaches for over 25 years.

    There have always been big security gaps and vulnerabilities in our most basic software development practice—the compile/link process. Most build processes are imperatively defined using an Ant, Make or Maven script. Each time the build runs, it rebuilds all the binaries, even if the corresponding source code has not changed.

    This is a problem. Instead, we need a build that is incremental. Incremental builds are difficult to script because they need more advanced logic. Most developers are not given adequate time to create a better build process, one that only rebuilds the changes. This means it is next to impossible to audit why a binary was recompiled because they are always recompiled. If we only recompiled the binaries that had corresponding code updates, we could more carefully audit the code and make sure that only approved coding updates were included.

    This may not have caused the SolarWinds attack, but it could have. Once hackers have gotten past the firewall they can find the build directory, read through the build scripts and identify the perfect piece of code to update with their bad function. The next time the build runs, a ‘clean all’ recompiles everything and, like dark magic, a SUNBURST is created.

    In our not-too-distant past, the developer community had tools that controlled software builds beyond what an imperative script could do. OpenMake Software, for example, provided a build automation solution called Meister that ensured that incremental builds were easy. As part of the build, it generated SBOM reports and differences reports allowing teams to easily audit and compare the actual source changes to confirm that only approved code updates were included. Another example was Rational Software’s ClearCase which used a program called ClearMake. ClearMake used a process called ‘winkin’ to reuse ‘derived’ objects that had not changed. This process created an incremental build that could be easily audited.

    I realize that I am simplifying the overall problem, but it is a good example of the basic supply chain best practices and how potentially vulnerable our processes are.

    The time to carefully think about how we manage our raw materials and overall supply chain is now. I’m guessing that most monolithic practices will not change much; it is too costly and impactful to rewrite hundreds of CI pipelines. But that does not mean we can’t solve the supply chain puzzle as we shift into cloud-native development in a microservice architecture.

    In a microservices architecture, we need to begin thinking about what the supply chain looks like. How do we track raw materials that are in the form of hundreds of small ‘bounded context’ functions? The good news is there is an emerging microservice catalog market that can become part of the supply chain solution. A microservices catalog can track versions of services to versions of their consuming applications. Your new SBOM report will have two levels: First, an SBOM for the microservice. Second, aggregated data at an application level. Remember, in this new architecture a full build is not done.

    It’s important to understand that microservices are naturally incremental and are independently built, packaged and deployed. Managing these small services opens the door to more closely auditing their source code before they are released.

    As we shift from monolithic development to microservices, we have an opportunity to incorporate supply chain and configuration management best practices. This includes being able to carefully audit the code before a release is done. And remember, we must do this as fast as possible. It sounds like a big task, but it’s well worth the effort. Collectively, we will find the answers as we explore new ways to manage our DevOps pipeline and incorporate configuration management and DevSecOps principles.

  • Why Distributed Cloud Is the Future of Cloud Computing

    Why Distributed Cloud Is the Future of Cloud Computing

    A distributed cloud is a public cloud service that allows you to run public cloud infrastructure in multiple physical locations while being centrally managed for performance and compliance. The most innovative companies are moving all their assets to a distributed cloud structure. It is safe to say that distributed cloud is the future of cloud computing.

    Lou Senko, senior vice president of IT and chief availability officer at Q2, will be speaking about distributed cloud, how it can benefit your business and why it is the next generation of cloud computing at DevOps Experience: The Roaring 2020s Virtual Summit, on Oct. 28 at 9:45 a.m. ET. Lou will explain how distributed cloud makes the most of multiple channels and how this emerging strategy can enhance your digital posture.

    During a quick interview with Lou, he explained some of the main benefits and advantages of distributed cloud and shared a sneak peek of his upcoming session. Check out the interview below to find out what to expect at DevOps Experience 2021.

    This year’s DevOps Experience will focus on DevOps and the use of the cloud to enable digital transformation. The two-day event, starting on Oct. 27, will bring together DevOps and cybersecurity luminaries from around the globe for a free, interactive learning experience.

    The agenda for the two-day virtual event features a mix of topics, including technical sessions, deep-dives and case studies covering digital transformation, DevSecOps, cloud-native, Kubernetes, AppSec, CI/CD, open source, value stream management and more. The virtual environment features more than 50 sessions by industry leaders and an expo hall lined with booths full of downloadable resources.

    To check out the full agenda and to register, please visit the DevOps Experience website.

  • Trust in Cloud Providers is a Developer Issue

    Trust in Cloud Providers is a Developer Issue

    Earlier this summer, we worked with ClearPath Strategies to ask developers about the level of trust they have in their various cloud service providers. What we learned spoke volumes: While developers’ familiarity and comfort with Amazon, Microsoft and Google position these well-known cloud providers as market frontrunners, developers often do not agree with the companies’ values.

    The research project gathered insights from more than 800 developers at small and mid-sized businesses, those with less than 500 full-time employees, across a wide variety of industries and geographies worldwide. You can download the summary report here (no signup required).

    In ClearPath Strategies’ report, senior analyst Stephanie Fairchild said that “approximately 20% of developers believe that the big three hyperscalers will engage in behaviors that include leveraging their brands to stifle competition, focusing on shareholders more than customer needs, hosting or working with customers that developers find morally objectionable, monetizing user data for their own use and locking them in with proprietary tools. Criteria such as security and performance clearly take priority over these trust issues for developers, but it’s interesting to note that a sizable portion of developers are thinking about how their values align with those of their service providers.”

    • Trust plays an important role in developers’ choice of a cloud hosting provider, but needs take precedence; when prioritizing needs or values, developers report they prioritize needs over their values 73% of the time.
    • The top three reasons cited for developers’ preference of their chosen third-party cloud provider: Security, trust and quality of service.
    • Survey respondents indicated that both hyperscale and alternative cloud providers deliver equally effective performance and security.

    The report cited three top criteria for choosing a third-party cloud provider: Security, trust and quality of service. Survey respondents felt that hyperscale and alternative cloud providers deliver equally effective performance and security. Interestingly, although 73% of respondents said they prioritize needs over values when making a purchasing decision, approximately 20% said they don’t trust the big three providers (AWS, GCP and Azure) in what could be considered key moral areas.

    It’s no secret that the extensive functionality and brand awareness of hyperscalers make them popular choices for developers, but an alternative cloud provider like Linode, DigitalOcean, OVHcloud or Hetzner can be a more trustworthy partner for innovative upstarts—one that likely offers better pricing and doesn’t threaten or compete with their business. And when an alternative cloud provider meets a developer’s functional needs—which is nearly always the case—developers can have the best of both worlds: A provider they can trust to meet their needs and one that shares their values. 


    To hear more about cloud-native topics, join the Cloud Native Computing Foundation and the cloud-native community at KubeCon+CloudNativeCon North America 2021 – October 11-15, 2021

  • Energy Efficiency and the Data Center

    Energy Efficiency and the Data Center

    The IT industry has historically been a leader in the ongoing race to reduce CO2 emissions. Reducing emissions is good for the environment and for the corporate bottom line. The data center is well-known as a voracious data consumer. But the data center consumption findings keep pace with the trend. Even in the face of remarkable growth in data center capacity and performance, their energy consumption has increased only a few percentage points since the 2010s. This almost-flat rate of energy consumption is primarily the result of the shift to cloud computing as well as the shift to solar and wind energy, where it makes sense.

    Investments in renewable energy sources have helped tamp down criticism over the overall IT carbon footprint. Knowing that it takes a tremendous amount of energy to power a data center, owners and operators are always looking for ways to improve efficiency and reduce carbon expenditure. Today, there are newer and better ways for organizations to deliver the performance to properly power modern applications while keeping in mind the energy efficiency and carbon reduction the world requires.

    Minimizing Energy Use and CO2 Production

    How did we get here? Decades of semiconductor process miniaturization in concurrence with living out Moore’s Law has culminated in ongoing improvements in performance, storage capacity and device density. Today’s mobile phones are a great example of that ongoing progress. A secondary factor in the mobile phone revolution is a processor architecture optimized for efficiency and flexibility. This ARM architecture has been used to power almost all devices since the first iPhone. Over the years, ARM has also become a realistic platform for servers; often a better choice than an x86 system.

    Energy efficiency is one area where ARM systems win out over conventional server architecture. But it was not until recently that ARM processors could deliver the required performance for the data center. Today’s systems, based on Armv8 designs, have brought into play x86-class capabilities in a more energy-efficient way. The advent of the ARM-based AWS Graviton processors, which by some estimates have already captured 20% of the instance share on AWS, demonstrates that ARM can run production workloads while delivering what AWS calls “up to 40% better price performance over comparable current-generation x86-based instances for a wide variety of workloads.”

    To illustrate the impact on carbon production when a data center shifts from x86-based architecture to ARM servers, an analysis of the top elements contributing to data center energy use was undertaken. The energy savings was calculated and translated to reduced CO2 emissions based on the fuel mix used to power the electric grid in various locations. The results prove that an ARM-powered data center reduces CO2 production by 74%, equivalent to almost half a million barrels of oil.

    Power Consumption Reduced by Efficient Servers

    The premise is simple—innovative server design significantly reduces data center energy use. In this model, a server’s power draw and physical size are key factors. The energy needed for other data center subsystems was extrapolated by using ratios derived from experience and validated by estimates from other data center operators.

    Data center energy use can be divided into five categories of equipment and infrastructure: Servers, network communications, power supplies, conversion and UPS, cooling systems and storage. Servers and cooling comprise about 75% of the total.
    The calculations were based on the energy used by a medium-sized data center with 750 racks of conventional 1U servers (42 servers/rack; around 31,500 in total). Assumptions used included servers comprising two-thirds of the floor space and that the equipment space accounts for 65% of the total, translating to a 62,000 square-foot data center. For comparison, facilities operated by the major cloud vendors can be a million square feet or more. Knowing server power consumption and the ratios for the equipment categories, algebra can be used to calculate the energy consumption for each.

    The data center in this hypothetical example has, as we said, 31,500 servers. Using the 912.5W power draw of a Dell R640 as typical of 1U x86 servers, the total server usage in the ARM data center would be 251,795 MWh/year. Using this formula, the amount of energy saved by using ARM servers can be calculated. Each server requires about one-quarter the electricity of a standard server. In the formula, the assumption is that the ARM server installation would require half the equipment racks (375 instead of 750) and 52% of the power-per-system, comprising a data center using only 26% as much electricity (152,409 MWh/year) as one based on x86 systems.

    The math shows that switching one medium-sized data center to ARM servers can produce annual savings equivalent to 45,459 fewer cars on the road or 486,749 fewer barrels of oil used.

    The value in CO2 reduction is widely understood for preserving the environment. It is also advantageous from an economic standpoint. In fact, there are many technical and economic reasons to adopt energy-efficient ARM-powered servers in the next-generation cloud data center.


    To hear more about cloud-native topics, join the Cloud Native Computing Foundation and the cloud-native community at KubeCon+CloudNativeCon North America 2021 – October 11-15, 2021

  • CNCF Adopts Meshery to Advance Service Mesh Management

    CNCF Adopts Meshery to Advance Service Mesh Management

    The Cloud Native Computing Foundation (CNCF) announced this week during the ServiceMeshCon/KubeCon + CloudNativeCon conference that Meshery, a service mesh management plane created by Layer5, has become a sandbox-level project.

    In addition, Layer5 has also donated Service Mesh Performance (SMP), a set of tools for measuring the efficiency of a service mesh, to the CNCF. SMP provides an open source framework to define standardized benchmarking practices, performance test configurations and measurements as part of an effort to create a MeshMark index for rating a service mesh. A set of service mesh performance methodologies will also be published by the IEEE later this month, developed in collaboration with engineers from Layer5, Intel, Red Hat and HashiCorp.

    Layer5 CEO Lee Calcote said the goal is to make it simpler for IT teams to determine which service mesh to employ based on their specific use case requirements.

    Several service mesh platforms are starting to gain traction as a means to both manage application programming interfaces (APIs) and provide a layer of abstraction between lower-level networking and security APIs that makes those services more programmatically accessible to developers.

    Meshery itself is an implementation of SMP and the conformance tool created for the Service Mesh Interface (SMI), a separate CNCF project to promote interoperability between service meshes. Meshery is based on a set of microservices that are designed to make the platform easily extensible.

    That approach makes it possible to manage multiple instances of service meshes that might be deployed on virtual machines as well as Kubernetes clusters using a range of management tools that are part of the Meshery project.

    Meshery supports AWS App Mesh, Citrix Service Mesh, HashiCorp Consul, Istio, Kuma, Linkerd, Network Service Mesh, NGINX Service Mesh, Open Service Mesh and Traefik Mesh. Meshery also provides IT teams with more than 60+ best practices in the form of templates that can be used to deploy a service mesh.

    It’s still early days as far as adoption of service mesh in the enterprise is concerned. Most IT teams still rely on either proxy software or a gateway to manage APIs. However, as the number of APIs that need to be managed steadily increases, it won’t be long before many IT teams start to at least evaluate a service mesh.

    In the longer term, the impact those service meshes are likely to have on the management of IT could be profound. It is becoming apparent that a service mesh also provides a higher level of abstraction for invoking networking and security services. In fact, the service mesh may wind up playing a key role in driving the convergence of network and security operations with DevOps best practices.

    In the meantime, IT teams will need to decide to what degree they may want to standardize on a single service mesh versus letting individual teams implement their own preferred platform that could one day be centrally managed via Mashery. One way or another, the way APIs are managed and invoked will soon fundamentally change forever.