Category: Infrastructure/Networking

  • Visualize Logs to Get More Value from Data

    Visualize Logs to Get More Value from Data

    Why do you keep logs? Regardless of the type of logs we’re talking about, you keep them because you expect them to provide some value for the organization. Maybe the logs will help you improve profitability; perhaps they will help you recover from downtime or perhaps they are expected to alert you to a security incident in progress. If you’re a system administrator or someone tasked with infrastructure reliability and maintenance, you’d agree that logs are critical. They represent the source of truth you go to for information about your server status and activity, website traffic, application performance and much more.

    No matter the intended purpose of logs or how you use them, the information in these logs should be easy to access and interpret. Today’s complex systems generate enormous amounts of log data, making it almost impossible to dig through tons of data in raw text files to find important information. Finding valuable information is immensely difficult in text logs but not in the visual world. This is precisely where log visualization comes into play. What if the data in your logs could transform into graphic shapes and patterns? Wouldn’t it be much easier and faster to decipher information from log data and understand it better?

    What are Logs, and What are They Used For?

    Before going any further, let’s make sure everyone is on the same page about the meaning of logs. A log is a textual, timestamped record that tells us what happened and when. DevOps engineers have to rely on a combination of logs from various system components and data sources to understand why an event occurred, and perhaps even predict future events.
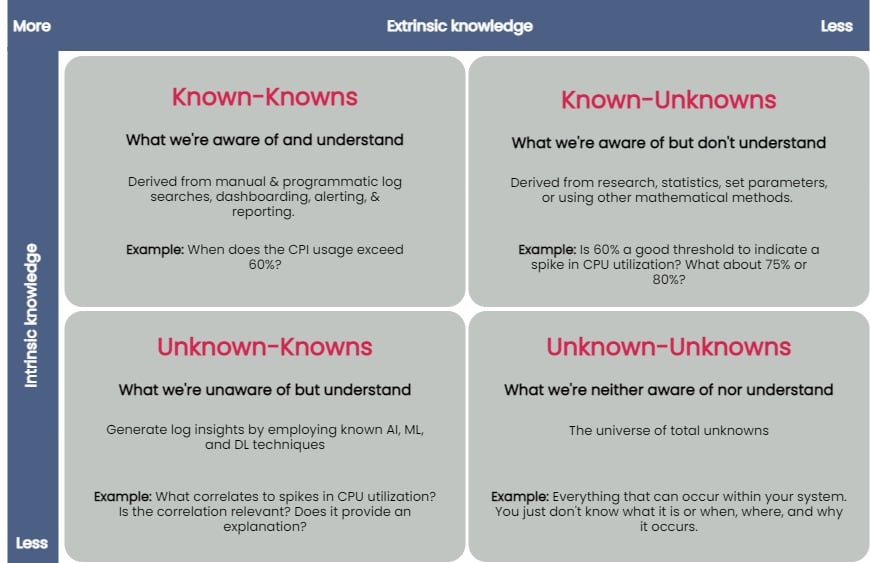
    logs value unknown


    You can taxonomize knowledge extracted from log data into four key groups: known-knowns, known-unknowns, unknown-knowns and unknown-unknowns. Manual and programmatic log searches, dashboarding, alerting and reporting manually extracted log fields are common ways to extract and analyze known-knowns. These methods assume that the engineer is already familiar with the data and knows where to look for answers. You can use statistics or other mathematical means to algorithmically resolve the known-unknowns, such as search terms and thresholds. The unknown-knowns are taken care of using AI/ML/DL techniques that generate log insights such as event correlations, log pattern clustering and known anomaly detection. But what about the unknown-unknowns?

    Uncovering Unknown-Unknowns

    With raw text logs, it’s relatively simple for engineers to conduct machine searches or set alerts upon encountering certain specific errors or specific types of behavior. However, to search through logs or even set up alerting parameters requires you to know what you’re looking for. If you have no idea what kind of errors or threshold limits for which you need to be alerted, it’s impossible to set these up.

    Modern applications are incredibly complicated, and one can not honestly understand everything about how they work or even always ask the right questions when things go wrong. But if an engineer reviewing logs doesn’t even know what to search for, it becomes impossible to figure out without an assistance tool like a purpose-built log visualization solution.

    For the most part, none of the techniques used to uncover the known-knowns, known-unknowns, and unknown-knowns of log data can help reveal the unknown-unknowns. An effective way of unraveling them is to rely on human intelligence to explore the unknown-unknowns space. Supplementing human intellect with a purpose-built log visualization tool can significantly help analyze the unknown-unknowns. Once you’ve recognized the unknown-unknowns, you can quickly feed this knowledge back into the appropriate, less esoteric groups (known-knowns, known-unknowns and unknown-knowns) and get more value from your log data.

    A good log visualization tool can aid in gathering knowledge from unknown-unknowns and can inform proactive log analysis or fast reactive log analysis use cases. Current log analysis practices center around reactiveness; the focus is to minimize and resolve issues after a problem has occurred. Using a log visualization tool, you can quickly isolate subtle and anomalous changes within a system by visualizing patterns generated from log data and exploring unknown-unknowns before an incident occurs.

    Current log visualizations are limited in display log count distribution and its variations. They do not visualize other log attributes or log combination attributes.

    All the UIs shown have similar function usage and displays. Drilling into an example of UI windows gives one the feeling of a typical log analytics practice. The figure below annotates different log analysis functions in the labeled, boxed area. None-visual log analytics functions such as search, tag, and log display are all required time-range input.

    log metrics annotate UI

    An ideal log visualization tool should not rely on just one information type. Log data is multifaceted. A log visualization tool can only begin to be valuable when it lets you focus on as many facets of log data as you can derive.

    Log Visual Pattern Discrimination

    The power of log visualizations comes from humans’ ability to recognize visual patterns. It’s hard to spot a pattern among raw log data, but it becomes easier once you can visualize that data.

    When an experienced DevOps operator looks at a log visualization, they can easily see where the anomaly is, even with no previous understanding of how the system works or where the anomaly might be coming from.

    Visualizations allow engineers to identify visual patterns and quickly understand what is going on in the system—whether it’s a hack in progress or an error causing a poor user experience. Visualizations are compelling, as they help shed light on important events, even if the engineer has no idea where to look or had no idea there was a hack going on in the first place.

    For instance, consider a scenario where a complex system generates millions of logs daily. Suppose we were to establish a baseline of the number of logs the system would generate when functioning normally. In that case, we’d have to take a daily count over a couple of weeks, or at least a month, to deduce a good-enough baseline.

    Even if we derive an acceptable baseline, we’d have to keep recording daily counts and compare it with this baseline to detect an anomaly. Doing this can be time-consuming and counterproductive as you might end up discovering an anomaly when it’s already too late to take any action.

    Once we plot logs daily on a graph, we can immediately figure out the baseline by observing it visually. Once we’ve visually established a baseline, we can instantly identify anomalies when we see values plotted above or below that established baseline. The following image visualizes logs ingested over ten days, illustrating how simple it is to establish baselines and identify when a system is doing something outside its usual behavior. This graph can deduce the baseline to be around 38,000 log records, with anything above denoting abnormal behavior within the system.

    log visualization

    Better Log Visualizations

    There are a few essential criteria for creating good log visualization analytics. They are:

    Use original log data. Data strategy is important. Most log data is unstructured by default, and many organizations tend to convert it to structured data before doing anything else with it. Doing so is a mistake, as you can lose vital pieces of information in the process. Good visualizations should be based directly on the logs exactly as the system produces them.

    Log data consistency. The format for the visualization should be consistent because if there are constantly changing variables, it becomes harder for humans involved to spot patterns.

    Choose robust log attributes and use them wisely. Instead of using just one log attribute for visualization (such as time distributed log density), you should look at visualizing more facets. Doing so gives analysts a better grasp of—and an intuitive understanding of—the log data set. For example, multiple pictures of an elephant taken from different angles help people understand elephants better than showing them only a single photo of an elephant taken from one angle. Similarly, if we break down logs by each of their attributes and then plot their frequency, we can better visualize how a system is performing. However, the attributes you pick are critical to providing valuable visualizations.

    With modern systems becoming even more complex, deciphering logs and uncovering unknown-unknowns will never be easy. The time is right to introduce new log visualization techniques to handle these unknown-unknowns. With log visualization becoming more user-friendly, you no longer need to count on people to be familiar with log interpretation or be aware of statistical, mathematical or AI techniques to analyze log data. Visualizing log data is not just a decision-making aid to human intelligence, discriminating between what is and isn’t acceptable and quickly identifying and remediating issues—the knowledge gained from unraveling the unknown-unknowns also helps advance AI/ML and automation techniques used to ascertain the knowns of your log data.

  • Using ML/AI to Support Infrastructure Monitoring

    Using ML/AI to Support Infrastructure Monitoring

    Successful infrastructure monitoring enables IT teams to ensure constant uptime and performance of their company’s systems. Technologies like machine learning (ML) and artificial intelligence (AI) benefit infrastructure monitoring by more quickly collecting and analyzing data from all of the hardware and software components that comprise the IT stack. Infrastructure changes are occurring faster than ever before, but complex systems, the unique nature of applications and lack of IT skillsets can cause challenges when integrating with these newer technologies. However, it’s more important than ever that sysadmins and DevOps teams understand how ML and AI can mitigate these roadblocks, support them in staying on top of infrastructure performance and rapidly address issues that arise.

    Intelligent Monitoring Support for Complex Systems

    The most tangible result of intelligent infrastructure monitoring tools and processes is near-immediate alerting of performance and uptime issues, which can then be addressed in an efficient and effective manner so no business interruptions occur. However, complex systems can stunt these benefits if ML and AI are not being used and manual monitoring protocols are still in place.

    Tools that use ML or AI lessen the work of IT staff immensely, freeing up critical business resources and aiding in overall productivity. Both technologies can automatically identify and update all IT stacks that comprise an enterprise’s infrastructure to keep systems up-to-date and aligned with established key performance indicators (KPIs). In addition, intelligent offerings can detect and factor those metrics against set standards so that early alerts to an “unhealthy” section of infrastructure can be identified, even as the IT stack is constantly changing. This drastically speeds up troubleshooting efforts.

    Differentiation in Applications

    The different applications supported by the various IT stacks will most often have unique service-level agreements (SLAs) for their performance and uptime, as well as remedies or penalties should those service levels not be achieved. Plus, system loads that stress the underlying infrastructure are frequently changed. For these reasons, it is important to identify what constitutes a “healthy” IT stack so that these minute parts of the infrastructure are not overlooked due to the variation involved.

    ML and AI can be programmed to track system baselines that support a “healthy” IT stack. These technologies are particularly great at finding novel and unusual patterns in data. As the monitoring and observability landscape becomes more complex over time, driven by real changes in how developers build applications and systems, the ability to spot and detect such patterns in data can be crucial in helping make sense of it, further cutting down efforts on manual searching, detective work and “death by dashboards,” which we’ve all experienced at one time or another.

    Supporting IT Team Skills with Intelligence Technology

    The role of sysadmins—and to a greater extent, developers—has shifted over the past few years to become nearly as complex as the infrastructure they oversee. Nowadays, it seems as though developers are required to have expertise in all aspects of infrastructure, from monitoring to Kubernetes to machine learning. This can take quite the toll on developers who possess such skills, but in a more realistic sense, developers that can do all these things are very hard to come by. The lack of these skillsets is pervasive in the industry, which is why ML and AI can be seen as supporting technologies—they can fill in these gaps, to an extent.

    With built-in intelligence and automation, ML/AI can enable even the most inexperienced sysadmin or DevOps professional to monitor complicated infrastructure like a pro, taking on most of the time-intensive work around collecting and analyzing the data and identifying where to troubleshoot. The main goal is to put humans in the driver’s seat, utilizing ML and AI for granular discovery of system issues, providing the metrics or charts that might be most relevant to IT staff as they troubleshoot their system and reducing the cognitive load of developers.

    With the vast benefits that intelligent technologies possess, integrating them into your IT stack can help mitigate challenges experienced with complex systems, application differentiation and the skills deficit experienced in the IT team. The important ingredient in making ML and AI effective in infrastructure monitoring is using tools that incorporate the right formulas, algorithms and automation that can best help determine success when it comes to your desired outcome.

  • Leveraging the Cloud for Mainframe Access

    Leveraging the Cloud for Mainframe Access

    Now more than ever, organizations around the world are looking to extend their existing mainframe investments as part of larger digital transformation initiatives. As core systems of record and reliability, mainframes continue to run many organizations’ most important applications and the idea of replacing these systems comes with greater risk than reward. While organizations are considering modernization of their mainframe investments, it’s important to remember that maintaining mainframe access and offering new ways for their users to work with the data and systems is a vital part of the larger project.

    Leveraging the Cloud for Mainframe Access

    With the recent increase in remote work, it’s no surprise that more companies are looking to leverage the cloud for mainframe access. This has many benefits from increasing scalability, availability and performance, to reducing application costs and improving security. Implementing modern mainframe access as part of a larger cloud project ensures that an organization’s modernization journey is not only transformational but also secure.

    If making the decision to leverage the private or public cloud for mainframe access, the integration of a secure host access solution ensures teams have access to the systems and applications needed to do their jobs, wherever they may be located. Deploying this secure access in a cloud environment is made easier by host access administration being integrated and centralized with the corporate user directory. Along with simplifying provisioning and management, centrally managed host access is, most importantly, more secure than other forms of access.

    The extension of enterprise security to the mainframe is sometimes overlooked in a transformation, but it is an integral part of the larger process of strengthening data and system security. In a perfect world, this can best be done through the integration of a host access solution with the existing identity and access management (IAM) system. If this is possible, the authentication credentials that are already in use for authorizing or denying access to the mainframe can be leveraged successfully.

    There are numerous benefits to an IAM integration with regard to access, data, stronger passwords, application security settings and system configurations. With IAM, the benefit of least privilege access means that users can access only the mainframe systems and data that are needed to do their jobs. Additionally, application security settings and session configurations can be changed from a central point by using the user directory. Finally, the stronger credential requirements of the IAM integration get rid of weaker eight-character passwords, strengthening security as a whole.

    Host Access Improves User Experience

    When it comes to host access, having a secure and centralized solution not only improves the mainframe access experience for the user, but also for the administrator. With zero-footprint secure access, users can be moved to a more secure web with higher security standards if needed. Security is also stronger with enterprise credentials that leverage mainframe session authorization to automatically sign them in. The integration of a host access solution gives administrators the ability to quickly deploy secure browser-based sessions, as well as providing web interfaces with no Java required, eliminating workstation dependencies as a result. This is also paired with the use of containers to enable deployment to countless users and support for mobile devices. For these reasons, a host access solution should be a common component in any cloud journey.

    The mainframe and its data, applications and user access remain vital for organizations and it is important that they remain protected and connected. With security being an ever-evolving issue, keeping these core systems secure while ensuring employees are able to access the systems and data they need should always be a priority. In conclusion, organizations looking to leverage the public or private cloud for their mainframe will have more success if they also strengthen their data and system security as part of the process.

  • The Importance of NetSecOps in Network Management

    The Importance of NetSecOps in Network Management

    The IT landscape has changed beyond recognition in the past decade or so. The vast majority of businesses now operate largely in the cloud, which has had a notable impact on their agility and productivity. A recent survey of 1,900 IT and security professionals found that 41% of organizations are running more of their workloads in public clouds when compared to just one quarter of respondents in 2019. Even businesses that were not digitally mature enough to take full advantage of the cloud will have dramatically altered their strategies in order to support remote working at scale during the COVID-19 pandemic.

    However, with cloud innovation so high on the boardroom agenda, security is often left lagging behind, creating a vulnerability gap that businesses can little afford in the current heightened risk landscape. The same survey found the leading concern about cloud adoption was network security (58%).

    Managing organizations’ networks and their security should go hand-in-hand, but, as reflected in the survey, there’s no clear ownership of public cloud security. Responsibility is scattered across SecOps, NOCs and DevOps, and these teams don’t consistently collaborate in a way that aligns with business interests. We know from experience that this siloed approach hurts security, so what should businesses do about it? How can they bridge the gap between NetOps and SecOps to keep their network assets secure and prevent missteps?

    Building a Case for NetSecOps

    Today’s digital infrastructure demands the collaboration – perhaps even the convergence – of NetOps and SecOps to achieve maximum security and productivity. While the majority of businesses do have open communication channels between the two departments, there is still a large proportion of network and security teams working in isolation. This creates unnecessary friction, which can be problematic for services-based businesses that are trying to deliver the best possible end user experience.

    The reality is that NetOps and SecOps share several commonalities. They are both responsible for critical aspects of a business and have to navigate constantly evolving environments, often under extremely restrictive conditions. Agility is particularly important for security teams to keep pace with emerging technologies, yet deployments are often stalled or abandoned at the implementation phase due to misconfigurations or poor execution. As enterprises continue to deploy software-defined networks and public cloud architecture, security has become even more important to the network team, which is why this convergence needs to happen sooner rather than later.

    We somehow need to insert the network security element into the NetOps pipeline and seamlessly make it just another step in the process. If we could automatically check whether network connectivity is already enabled as part of the pre-delivery testing phase, that could, at least, save us the heartache of deploying something that won’t work. And then, if we do need to open new ports, an automated process that could also raise a change request would save even more time. Better yet, if it’s one of those “make this like that” changes, the change could be automatically implemented on the firewalls – in minutes, not weeks.

    With NetSecOps, application developers can get creative without worrying about security slowing them down, and network security teams can sleep soundly, knowing that risk and compliance checks are built in to the continuous delivery process with a full audit trail, so they can even get time back to do some fun stuff.

    If we could do all this with only the rare cases of new connectivity requiring approval by security, the NetSecOps dream could become a reality, allowing fast, high-quality delivery. With NetOps and SecOps working together, organizations can establish a collective approach to network management and security, offering equal opportunity for both teams to present and prioritize issues and agree on the fundamental rules from the start; a match made in heaven.

  • Private and Virtual Private LTE/5G Challenges Network Visibility

    Private and Virtual Private LTE/5G Challenges Network Visibility

    Digital transformation continues to disrupt the entire IT stack by shifting nearly every paradigm, including the new blurring lines between network infrastructure. New mobile network technologies are at the cusp of adaption in the enterprise networks with a growing number of innovations poised to enable expanded and more flexible connectivity with a gradual displacement of traditional Wi-Fi networks.

    The evolution began as new unlicensed radio frequencies become a part of the 3GPP 5G Release 16 mode of operation. This new mobile mode of operation has the ability to offer the necessary technology for mobile network operators (MNOs) to operate the unlicensed spectrum into 5G networks and make some of it available for corporate networking. New standardization will enable the enterprise networks to gradually adopt these new mobile networks to their connectivity framework, in order to leverage the benefits of new modern applications and alignment to their connectivity, scale and quality of service requirements.

    With the benefits of a new mode of connectivity – in a converged fixed or pure mobile infrastructure – there are always measurable risks that require attention. Specifically, the new mode of connectivity brings potentially new security threats and operational challenges that need to be addressed.

    New Operating Modes

    It is likely that incorporating this mobile technology will require starting from new operational modes; these will be imperative to grasp the direction and the adaption of private mobile networks in reality. Industry hype is certainly driving the trend towards the mode in which the corporate IT teams will be capable to deploy and operate the new private mobile network. However, at this point in time, the more realistic option will be that full control of design, deployment and operation will be from the MNOs, as they have strong experience, knowledge and risk mitigation capabilities. This mode of operation is also incentivized through the business aspects of creating a new revenue stream for the MNOs. This higher-margin business can provide more stringent security operations, particularly in light of better understanding the vector of attacks. Such an approach provides carrier-grade operations with the commitment of a service level agreement and correlation to the required corporate business agility and continuity needed by the enterprise.

    Questions like the who, what and where of network traffic need to be answered to prevent security threats and maintain network performance and reliability—in essence, identifying and maintaining the identity of the mobile subscriber in a complex hybrid model of mobile connectivity. A corporate mobile network can be completely private, well isolated from other networks with no roaming into the public network. It can also feature a less stringent traffic policy using a virtual slice of the private network with a segmented perimeter in which certain traffic will roam into a public network and will be tracked with respect to subscriber-aware policy. This latter option is a greater challenge because of the inherent separation of data or user and control planes in mobile network architecture is virtual rather than physical. Additionally, new mobile 5G architecture includes virtualization and network slicing to offer valuable versatility and scale, but it also makes NetOps and SecOps monitoring and control even more challenging. In light of the complexities, we can assume that the favorable and practical mode of new corporate mobile networks will be outsourced to an MNO that will operate in tight synergies with corporate IT teams. Their work will be based on a defined playbook to drive a gradual evolution of architectural reference models and pragmatic learning curve for corporate “do it yourself” operations mode. Complexities multiply in cases related to IoT and manufacturing applications in which the mobile core is required to be closer or co-located with the edge to support low latency and high throughput requirements.

    5G features a separation of data/user and control planes that is an architectural advantage, particularly helpful for large IoT deployments, dynamic scalability and services and higher data rates with greater bandwidth efficiencies. It offers more distributed processing for greater scale and less susceptibility to a single point of failure. It also represents a shift from best-effort networks to ones that can provide better, more differentiated levels of services and prioritization. This separation requires a new approach for network visibility to understand who is doing what. This is an issue for security as well as networking performance.

    The Challenge of Virtualized Network Functions

    Another challenge is that 5G virtualizes in software the higher-level network functions that traditionally have been performed by physical hardware. This virtualized network slicing means a sharing of physical resources that expand the attack surface by offering the potential for a sophisticated attacker to traverse from one virtual instance to another knowing that it will be difficult for security teams to detect this lateral movement. In addition, 5G radio network deployments may include significant expansions of small cells connecting in a campus geographically distributed environment, machine-to-machine communications and dynamic connections to multiple cells. All of these present a new frontier for attackers and new challenges for IT operation teams. Organizations need visibility and understanding of these new infrastructure resources to ensure a clear design and implementation to prevent security breaches and disruption of business continuity.

    The potential for significant expansion of IoT devices on corporate networks using 5G offers important advances for measuring and monitoring devices or making everything connected. At the same time, these lean devices generally have far less endpoint controls—particularly robust access control—than traditional computing devices, and it is difficult to add such controls directly to each unit. The rise of more IoT machine-to-machine communication and away from a hub-and-spoke model adds additional complexity. A proliferation of such devices also intensifies the need for deeper visibility and more automated security to scale with these deployments without the bottleneck of human intervention for each. This adds risks to the internal IT learning curve, making it an unlikely option and again, favors outsourcing to MNO experienced teams to design, deploy and maintain the corporate private mobile networks.

  • 4 Ways SASE Fuels DevOps Productivity

    4 Ways SASE Fuels DevOps Productivity

    Many enterprises are adopting secure access service edge (SASE) solutions as part of their digital transformation efforts. SASE, in a nutshell, merges together SD-WAN and security stacks to deliver secure networking and improved WAN performance, making it a logical choice for cloud-enabled businesses going through the throes of digital transformation. However, SASE offers other benefits, which may be of particular interest to DevOps teams.

    Let’s take a look at four ways SASE can enhance the productivity of DevOps teams.

    Reducing Collaboration Challenges

    SASE reduces the challenges associated with team collaboration. SASE, by design, integrates WAN optimization with cybersecurity. Today’s DevOps teams need to work together, despite being physically separated, and must have reliable, secure connectivity amongst the team. “DevOps are all about time-to-market, and DevOps teams are looking for ways to shorten their  CI/CD cycles. A critical part of that process is reducing their dependency on the networking and the security teams,” said Boaz Avigad, director of product marketing, CATO Networks. “Since SASE solutions already provide optimized performance and robust security, DevOps [teams] are free from waiting for infrastructure teams to provision the necessary resources. SASE provides DevOps the control and operational cadence they need without compromising performance or security.”

    SASE Improves Networking

    SASE improves overall network performance with integrated load balancing and failover capabilities. DevOps teams cannot afford to lose connectivity, especially when rolling out new iterations of software or resolving bugs. “For DevOps teams, fast and reliable application performance is critical,” said Avigad. “SASE architectures free DevOps [teams] from worrying about the infrastructure by connecting all the company’s edges, data centers, mobile users and cloud resources, with the same self-healing, secure and fully optimized global network. Should a line fail or a route become congested, SASE automatically switches to an alternate path.”

    Better Security Built In

    SASE helps to secure DevOps projects with native cybersecurity capabilities. When properly implemented, SASE integrates numerous security technologies directly into the network stack. “DevOps teams worry about information interception and protecting their applications from threats. All security services share a single, unified context, improving insight and closing the gaps in legacy security architectures; gaps attackers often exploit,” said Avigad. “SASE not only includes NGFW, IPS, SWG, AV and MDR services, it also converges them together into a single-pass architecture.”

    SASE Removes DevSecOps Burdens

    SASE secures internal applications, along with the interactions with those applications, which in turn helps to reduce the burdens on DevSecOps team members. Applications that run over SASE/SD-WANs are further secured by zero-trust network access (ZTNA) and software-defined perimeter (SDP), technologies that help to keep all interactions between an endpoint and an application secure. “Many proprietary applications are too sensitive to run over the public internet. SASE protects those applications by obfuscating traffic, protecting all entry points with a NGFW and restricting access with its zero-trust architecture,” said Avigad. “All internal application traffic is also continuously inspected for threats.”

    Adopting SASE for DevOps teams is beginning to make a lot of sense. The technology addresses many of the pain points that DevOps teams experience as businesses drive toward digital transformation. What’s more, the security benefits offered bring forth additional productivity, while also unifying the security stack. 

  • Cisco Leans on HashiCorp to Manage Infrastructure as Code

    Cisco Leans on HashiCorp to Manage Infrastructure as Code

    HashiCorp and Cisco today announced a Cisco Intersight Service for Terraform offering based on HashiCorp Terraform Cloud Business software.

    Cisco Intersight is an IT operations management platform that enables IT teams to manage IT infrastructure across a hybrid cloud computing environment. Open source Terraform tools have emerged as the dominant tool for provisioning infrastructure as code in the cloud and, increasingly, in on-premises IT environments.

    HashiCorp Terraform Cloud Business is an instance of Terraform that has been extended to include some additional security and governance capabilities enterprise IT organizations typically require.

    In recent years, Cisco has significantly expanded its presence in on-premises IT environments as many IT teams opted to deploy its servers alongside its networking equipment. Like every other provider of on-premises IT environment, Cisco has been moving to extend the reach of its management frameworks to public clouds to help foster the rise of hybrid cloud computing.

    Prior to the pandemic, most public clouds and on-premises IT environments were managed in isolation from one another. However, in the wake of the economic downturn brought on by the pandemic, more IT teams are trying to centralize the management of IT platforms as part of an ongoing effort to reduce the total cost of IT. The multiyear alliance with HashiCorp fills a major hole in the Cisco management portfolio, as Terraform increasingly becomes a de facto standard for provisioning IT infrastructure-as-code.

    Vijay Venugopal, head of product management for Cisco Cloud and Compute Software, said the alliance with HashiCorp will make it possible to provide Terraform support across a management portfolio that, over time, continues to be enhanced with machine learning algorithms that add artificial intelligence (AI) capabilities, also known as AIOps. That platform is already being employed by 6,000 customers to manage more than 600,000 servers, running primarily in on-premises IT environments, added Venugopal.

    HashiCorp Terraform Cisco

    It’s unclear how the battle for control over hybrid cloud computing will ultimately play out. While providers of on-premises platforms such as Cisco are making a case for using existing management frameworks to also manage workloads deployed on public clouds, the providers of those platforms are now extending their reach into on-premises IT environments. Cisco is, of course, betting that most organizations would prefer to extend an existing framework to achieve that goal, versus having to rip and replace existing IT infrastructure to employ an alternative framework from a cloud service provider.

    Regardless of how organizations ultimately decide to manage IT in the age of the hybrid cloud, it’s clear developers, thanks to tools such as Terraform, are exercising more direct control over IT infrastructure. Incorporating Terraform within a larger IT management framework presents an opportunity to bridge the divide between developers and IT operations teams that have historically relied on visual tools to provision infrastructure. The challenge now is finding a way for developers and IT administrators – with varying levels of programming expertise – to work more closely as management of IT environments become increasingly more complex.

  • Progress Unveils First Update to Chef Automation Portfolio

    Progress Unveils First Update to Chef Automation Portfolio

    Progress today announced it has enhanced its Chef Enterprise Automation Stack (EAS) and released a new version of Chef Infra Client that promises to make the programming language on which EAS relies more accessible.

    Sudhir Reddy, vice president of engineering for Progress, said the latest versions of both offerings are the first updates to the Chef portfolio since Progress acquired the company last fall.

    Chef EAS combines elements of the Chef portfolio in a way that makes it easier to develop and integrate DevOps workflows that span everything from provisioning infrastructure to deploying applications. The latest update to EAS adds the ability to automatically execute compliance audits as part of any Chef Infra Client run using Chef InSpec tools. At the same time, the latest update also simplifies the implementation of the patch management processes.

    DevOps teams can also view and manage Chef Infra Server details via the Chef Automate framework. Those views, when combined with Chef Infra Client Run Reports, provide insights into the various policies and Chef objects in use on a system.


    Finally, the Chef Workstation module includes the Chef Habitat command line interface (CLI) to further simplify workflows.

    Ultimately, Progress is moving toward creating a common user experience across all elements of the Chef EAS suite of tools, Reddy said. In effect, EAS is emerging as the control plane through which the entire Chef portfolio will be managed, Reddy added.

    Meanwhile, Infra Client 17 promises to make the Chef Language underpinning that suite more accessible. It provides a streamlined developer experience as well as pre-built integrations with various cloud services. In addition, Progress is adding support for various ARM processors used in cloud services, macOS Big Sur, the Apple M1 architecture, Windows 8 and PowerShell Core.

    Progress also enhanced its ability to securely capture metadata from the Amazon Web Services (AWS) public cloud as well as capturing data from Microsoft Azure clouds.

    An early pioneer of a framework for automating IT infrastructure-as-code management, Chef is still widely employed. However, rival open source frameworks have since emerged, which Chef eventually responded to by making its core platform also available as open source software as it changed its business model. Progress today also announced it will recognize external contributors to the platform with recognition awards. Progress reports that, in 2020, there were more than 6,000 contributions from over 350 contributors in the Chef community in support of Chef Infra, Chef InSpec and Chef Habitat.

    It’s still unclear how the battle for infrastructure-as-code framework management supremacy will ultimately play out. While many developers have clearly shown a preference for rival open source tools, Progress is positioning the Chef portfolio as a framework for IT organizations that need to automate processes at scale, including how application are deployed on infrastructure that is provisioned as code.

    Of course, many rival framework providers have similar ambitions. The challenge, of course, will eventually be convincing organizations that tend to employ a wide range of tools across different departments to finally standardize on one framework versus another.

  • IBM Deepens DevOps Insights on Mainframes

    IBM Deepens DevOps Insights on Mainframes

    IBM today extended its effort to enable IT organizations that have mainframes to embrace DevOps best practices by updating the analytics tools it provides.

    Tom McPherson, vice president for IBM Z Software, said a version 6.0 update to the suite of IBM application discovery and delivery intelligence (ADDI) for IBM Z tools surfaces more granular insights by leveraging a new version of Wazi Analyze that now analyzes code immediately after a change is made. That capability is critical, because most of the workloads running on a mainframe are highly tuned. Any issue that is likely to occur can usually be traced directly back to the latest software update made to the environment, McPherson said.


    Wazi Analyze also can now be deployed as a set of containers, which McPherson said means IT teams can opt to run the analytics application on a platform other than the mainframe.

    ADDI also has been updated to improve Assembler support by making it easier to analyze multi-level dynamic assembler macro calls. A set of application programming interfaces (APIs) for feeding that data back to a continuous integration/continuous delivery (CI/CD) pipeline has also been added.

    Finally, IBM revealed it signed a licensing agreement with ITP Software Systeme GmbH, Munich (ITP) to enhance application analytics capabilities. That capability will be added to a future release of DevOps for IBM Z Hybrid Cloud, which includes ADDI and IBM Wazi Developer, to enable organizations to determine how best to modernize legacy monolithic applications as they transition to a microservices-based, cloud-native computing environment.

    Naturally, not every monolithic application is going to be converted into a series of microservices. However, McPherson said, it’s clear there is a need for analytics tools that will enable IT teams to more easily determine which elements of an application are better suited to being reconfigured as microservices that could be deployed on, for example, a Red Hat OpenShift cluster.

    For the last several years, IBM has been encouraging IT organizations that have mainframes to embrace DevOps best practices as part of a larger effort to position mainframes as another type of distributed computing platform. The overall goal is to lower the total cost of mainframe ownership by reducing the need to rely on specialists to manage mainframe application environments. Each year, more of those specialists retire. IBM wants to make it more feasible for organizations to replace those specialists with IT generalists, like those that typically manage distributed computing environments. At the same time, management of distributed computing environments is becoming more automated, thanks to the rise of DevOps.

    Of course, mainframe processes have been highly automated for decades. IT teams managing mainframes may still rely primarily on waterfall-based processes to deploy applications, but the underling infrastructure is designed to scale up and down on demand as application workloads require. Convincing IT teams that, for decades, have employed the same processes to manage mainframes often requires a significant amount of cultural change.

    Regardless of motivation, however, the winds of DevOps change are now blowing through mainframe environments just as fiercely as they have through the rest of IT.

  • SolarWinds Unveils Revamped APM Platform

    SolarWinds Unveils Revamped APM Platform

    SolarWinds is unifying its various application performance management (APM) tools within a single suite accessed via a software-as-a-service (SaaS) platform.

    Denny LeCompte, senior vice president for products at SolarWinds, said the APM Integrated Experience offering combines the company’s AppOptics, Loggly and Pingdom tools to collect metrics, traces and logs along with real user monitoring capabilities and tools to simulate application traffic.

    APM Integrated Experience also provides access to a landing page that identifies what has changed in an IT environment over the previous week and highlights which of those changes might become an issue. As most IT professionals well understand, most IT issues can be traced directly back to a recent change made to an IT environment that was previously running as intended.

    Other capabilities include advanced search tools and the ability to inspect lists and maps for hosts, containers and plugins for web servers and databases. In addition, APM Integrated Experience is integrated with both Amazon Web Services (AWS) and the Microsoft Azure cloud.

    LeCompte said the goal is to make it less expensive for the average IT organization to broadly instrument applications using an agent developed by SolarWinds that can automatically be installed.

    Ultimately, the goal is to enable organizations to better manage their software supply chains, LeCompte added. Of course, SolarWinds is at the heart of the software supply chain breach that involved its Orion network management software. That software runs on-premises. In comparison, APM Integrated Experience is a SaaS platform that is more secure. In fact, LeCompte said, IT professionals that manage software supply chains are generally sympathetic to the challenge the company currently faces. Most of those organizations have dealt with similar software supply chain issues, albeit on a smaller scale, LeCompte added.

    In general, LeCompte said it’s apparent most organizations need access to an APM platform that costs substantially less than rival platforms and still delivers 90% of the capabilities they require. In many cases, IT organizations are paying for extra capabilities that only very high-end enterprises require, LeCompte noted. In fact, one of the primary reasons APM platforms are not as widely employed is most organizations have found rival APM platforms simply too expensive to deploy, said LeCompte.

    LeCompte declined to speculate whether there is a meaningful difference between what has been historically known as monitoring and so-called observability platforms that have emerged in recent months. Regardless of approach, however, it’s clear as distributed IT environments become more diverse and complex, the number of organizations that need more visibility into their application environment is steadily increasing, said LeCompte.

    Of course, with the rise of microservices-based applications, that level of IT complexity is only going to increase. As applications grow and expand, the number of dependencies between microservices starts to increase. Understanding how an issue with one microservice is impacting a distributed computing environment will undoubtedly require more instrumentation. The challenge, going forward, will be determining how best to achieve that goal at a reasonable cost.