Category: DevOps Toolbox

  • Mabl Adds Beta of Desktop Continuous Testing Tool

    Mabl Adds Beta of Desktop Continuous Testing Tool

    Mabl today announced availability of a beta version of a desktop tool for creating tests that can be applied to browsers and application programming interfaces (APIs) using a low-code tool.

    Dan Belcher, co-founder of Mabl, said the goal is to make it simpler to streamline testing processes as responsibility for application quality assurance (QA) continues to shift left within the context of a DevOps workflow.

    Mabl provides a low-code tool for testing desktop and mobile browser applications, alongside the APIs they invoke, using an Electron tool that generates tests in a way that eliminates the need to write scripts. Previously available only via a software-as-a-service (SaaS) platform, Belcher said the desktop platform will make it simpler for developers to test code as they develop it on a local machine.

    Developers using the desktop tool can now also manage and run tests instantly via command line interface, versus having to completely exit from a project to invoke a separate testing tool, Belcher said.
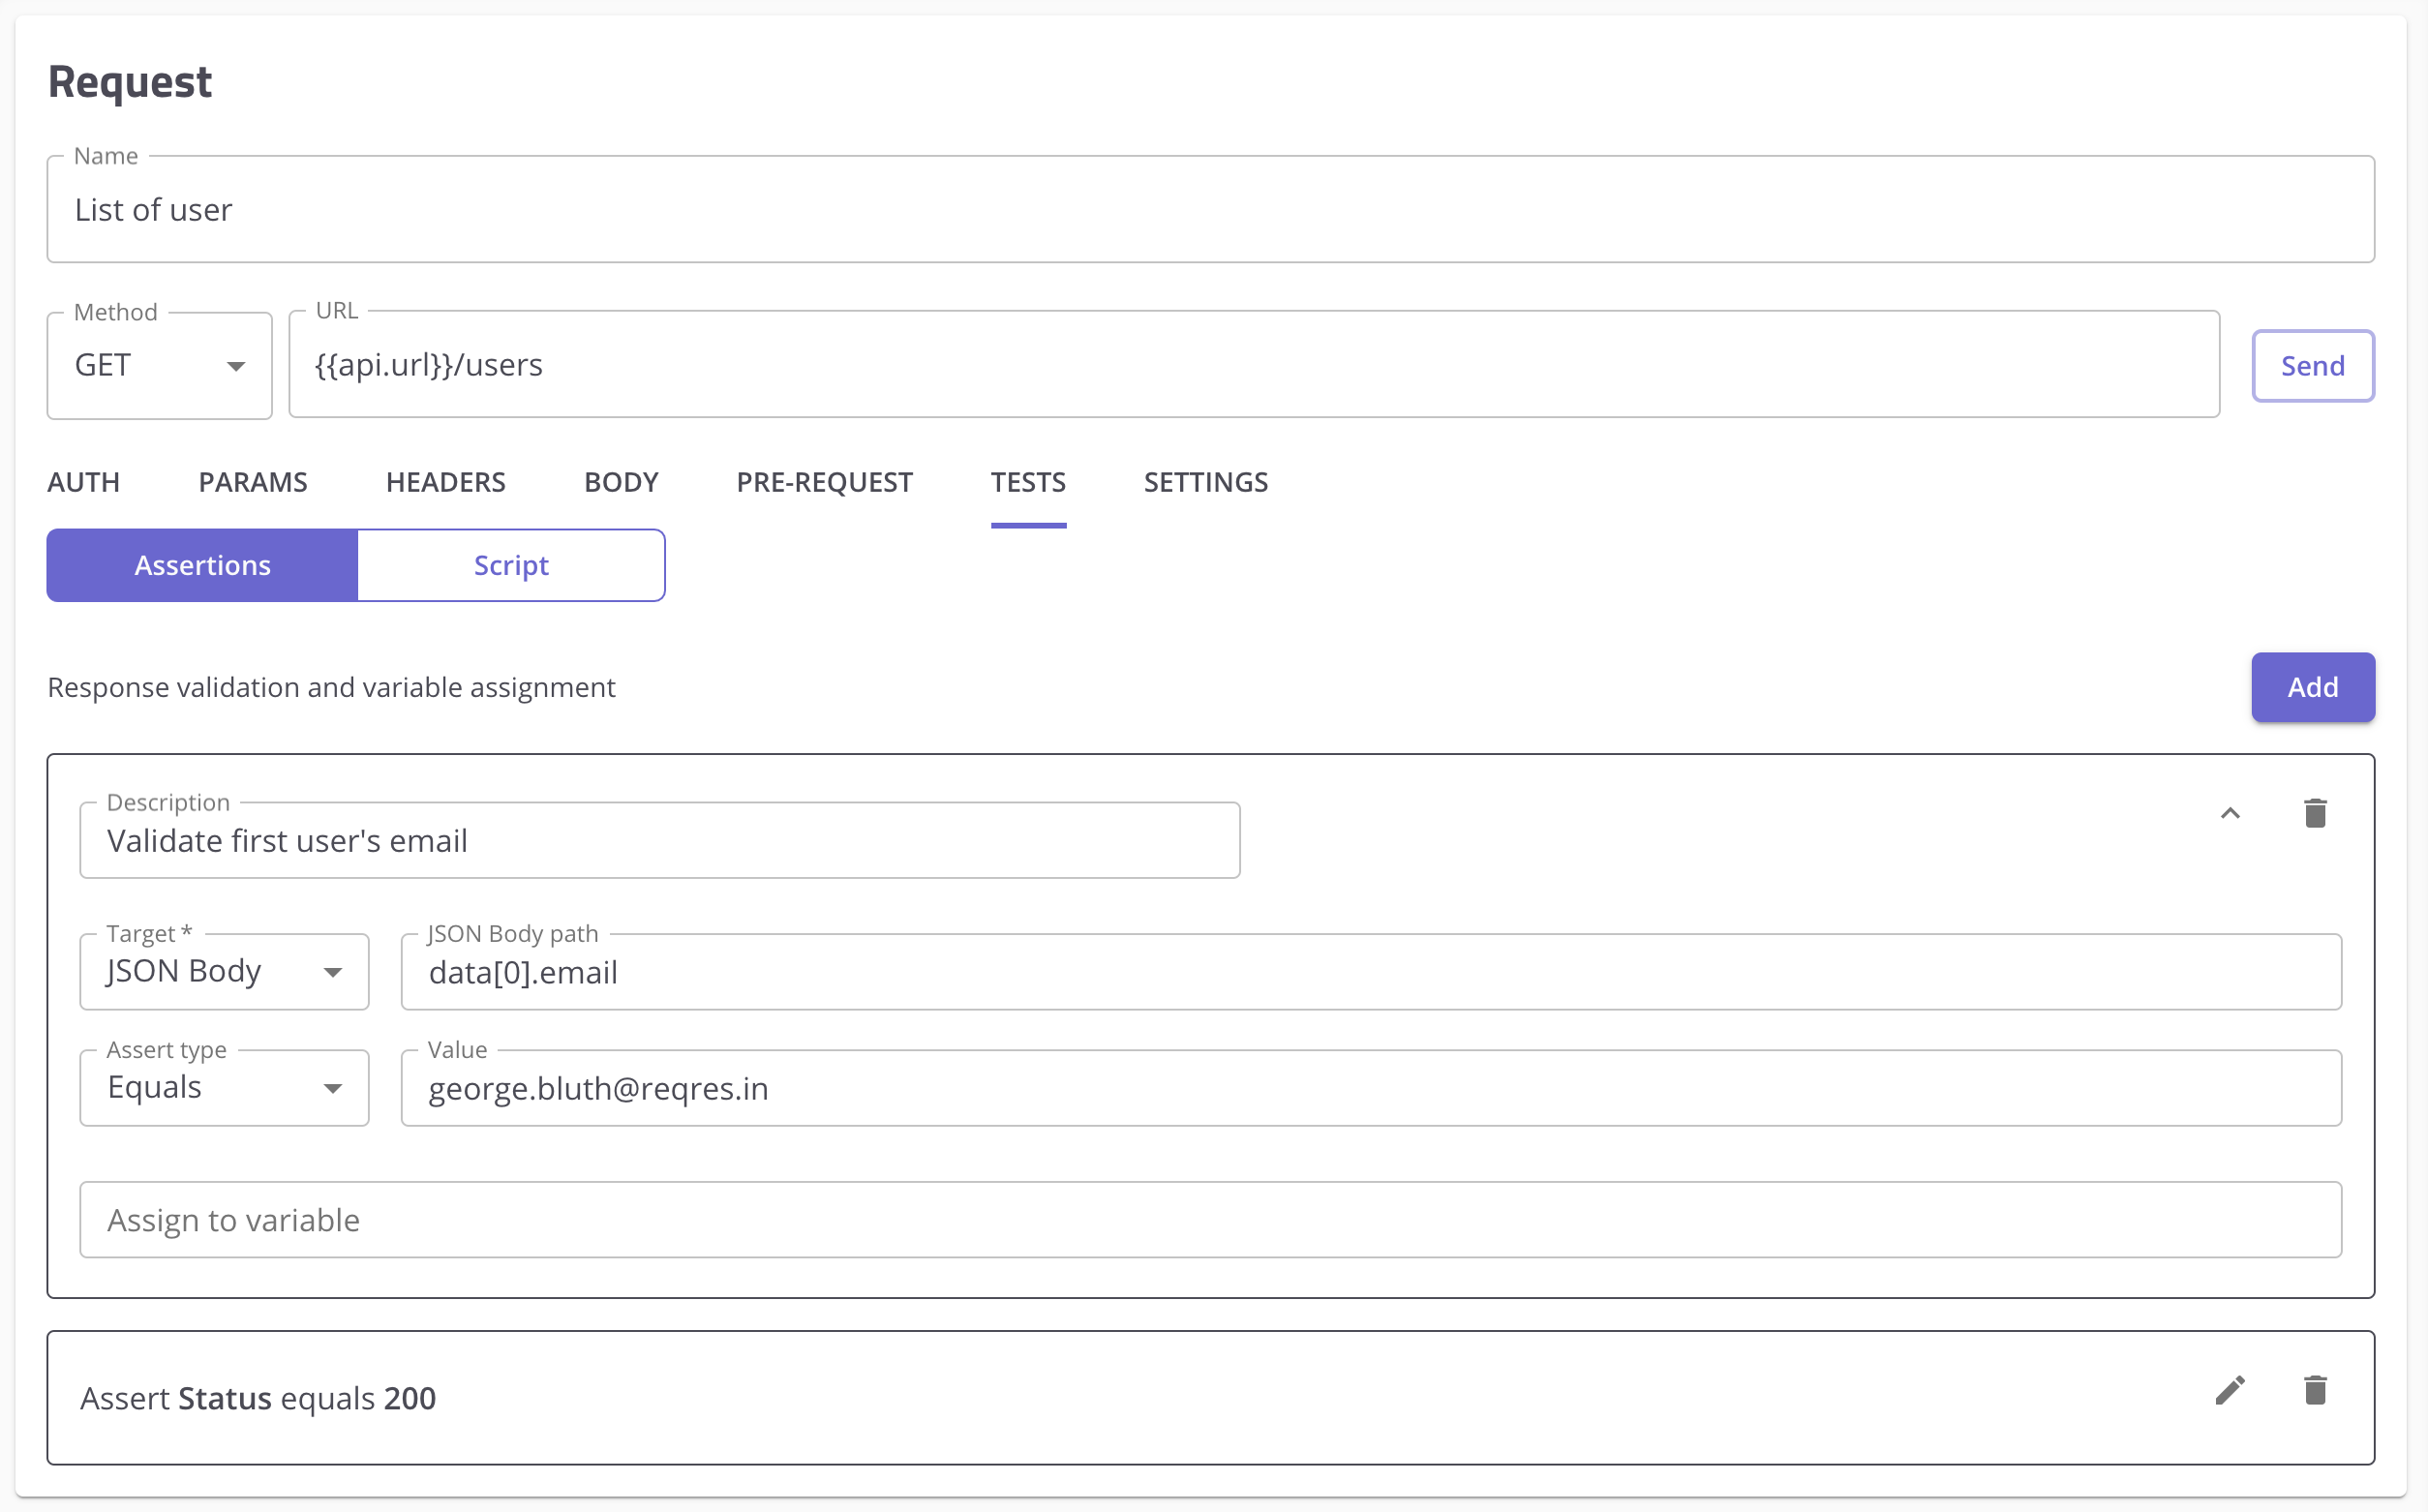
    The Mabl testing tools are already integrated with multiple continuous integration/continuous delivery (CI/CD) platforms, such as Bitbucket and Bamboo, as well as the GitHub repository.

    In the longer term, Belcher said it is clear organizations will need to involve more developers in QA testing, as the rate at which applications are being built and deployed continues to increase. Testing teams, on their own, can no longer keep pace with the rate of change, Belcher noted.

    The challenge is achieving that goal in a way that creates the least amount of friction possible, Belcher added. The Mabl platform and desktop application make it feasible for developers to test both web and mobile applications without taking too much time away from developing application code, said Belcher.

    Testing has become a major DevOps issue because, as developers assume more responsibility for applications after they have been deployed in a production environment, they naturally want to vet applications more thoroughly. Issues that arise after an application is deployed simply result in less time available to write new code. There will always be issues that need to be addressed, but the more of them that are resolved as part of a QA process integrated within a DevOps workflow, the more productive an application development team will be.

    Unfortunately, testing is often given short shrift; it primarily occurs at the back end of the application development life cycle. Developers are typically behind schedule, so there is a natural tendency to reduce the amount of time allocated to testing in the hope of making an application delivery deadline. The vicious cycle that ensues is that, inevitably, there are more bugs to fix after an application has been deployed, simply because not enough testing was done during the original development cycle.

    Of course, some development teams have become conditioned to fixing bugs as part of an agile development process that, too often, encourages them to push known issues off to the next sprint. The trouble is, in the absence of continuous testing, it’s not long before all those known bugs start to pile up. It’s not uncommon for applications to be riddled with bugs that development teams – with mixed success – attempt to address all at once. The earlier those issues are addressed, the less stress there will be later for all concerned.

  • AppDynamics Survey Reveals High IT Stress

    AppDynamics Survey Reveals High IT Stress

    A global survey published today by AppDynamics, a unit of Cisco, suggests the last year took a substantial toll on IT teams at a time when many organizations either launched or accelerated digital business transformation initiatives.

    The survey, of 1,050 IT professionals in organizations with revenue of more than $500 million, finds organizations, on average, implemented digital business transformation initiatives three times faster in 2020 than they did in 2019 in response to the economic downturn brought on by the COVID-19 pandemic. That increased level of activity, however, appears to have come at a significant cost. The survey found 89% of respondents felt they are under immense pressure at work, with 84% admitting to having difficulty switching off after work.

    The survey also found stress levels are, not surprisingly, rising as well, with 81% of respondents experiencing increased frustration and 63% conflicting more with colleagues.

    The root cause of these issues cited most often include new sets of priorities and challenges (80%), technology sprawl and a patchwork of legacy and cloud technologies (78%), acceleration to cloud computing (77%) and multiple, disconnected monitoring solutions (74%).

    A full 85% also identified cutting through noise generated by increasing volumes of data to identify root causes of performance issues will represent a significant challenge in the year ahead. A total of 92% also noted the ability to link technology performance to business outcomes will be what’s really important to delivering on innovation goals over the next year.

    Three-quarters (75%) of respondents said they are already struggling to manage overwhelming “data noise.” Nearly three-quarters (73%) also noted they fear the inability to link IT performance with business performance will be detrimental to their business in 2021. Three-quarters (75%) of respondents also noted their organization needs to connect full-stack observability to business outcomes within 12 months in order to remain competitive. Two-thirds of respondents (66%), however, said right now they do not have the resources and support they need.

    AppDynamics regional CTO Gregg Ostrowski said the survey makes it clear that existing approaches to merely monitoring IT platforms are not going to be sufficient, at a time when observability across the full stack of IT platforms being employed is now absolutely essential. Rather than convening war rooms where IT teams responsible for different platforms compare reports in the hopes of identifying the root cause of an issue, Ostrowski said modern observability platforms provide a holistic view of IT environments that IT teams need to proactively resolve issues before they impact the business.

    That level of visibility will also play a crucial role in reducing the stress levels of IT teams that, in many cases, are now in danger of suffering from burnout, Ostrowski added. Of course, the more fatigued an IT team is, the more likely it is mistakes will be made.

    It’s not clear to what degree IT teams are embracing observability as a core IT management concept. The AppDynamics survey noted that 71% of respondents are wary of misleading claims from vendors who are re-labelling monitoring tools as observability platforms. Regardless of how observability is achieved, the general consensus remains: whatever observability means within the context of IT, most organizations lack it.

  • CircleCI Adds Private Orbs to DevOps Toolchain

    CircleCI Adds Private Orbs to DevOps Toolchain

    CircleCI announced today it is enabling IT reams to configure their own private integrations around its namesake continuous integration/continuous delivery (CI/CD) platform.

    The company enables integrations with third-party services via reusable config packages, based on YAML files, known as orbs. Now, internal IT teams can create private orbs that they can securely reuse to invoke, for example, a frequently accessed microservice via the command line interface (CLI) and invoked via the CircleCI platform.

    CircleCI CEO Jim Rose said the goal is to make DevOps teams more efficient at a time when the number of microservices organizations are reusing is increasing steadily. Rather than having to manually integrate each of those services every time they are needed, a private orb will consistently automate the process using the same template, said Rose. That approach, over time, will enable DevOps teams to more easily build and maintain an ecosystem of microservices, Rose added.

    In general, Rose said, with more DevOps teams now working from home to help limit the spread of the COVID-19 pandemic, there is a greater need to automate as many tasks as possible to enhance overall DevOps productivity. Constructing an orb gives DevOps teams a relatively simple way of achieving that goal, Rose said. Today, there is often a small, elite group within DevOps teams that builds tools to automate processes in a way that the rest of the DevOps team can more easily consume. Private orbs make it easier for anyone on the DevOps team to create a reusable process, said Rose.

    Many of those DevOps teams are, of course, attempting to accelerate digital business transformation initiatives launched in response to the pandemic. Those initiatives are generally based on applications being constructed using microservices that, ideally, developers will reuse across multiple projects. The CircleCI private orbs can be remotely invoked from anywhere via the CI/CD platform the company manages on behalf of DevOps teams that employ it.

    It’s not clear to what degree IT organizations are shifting CI/CD platforms to the cloud in the wake of the pandemic. In theory, a cloud-based platform is more accessible to DevOps teams that, like most employees, are working from home. Even after the pandemic eventually subsides, many members of DevOps teams will undoubtedly be working from home more regularly.

    In the meantime, a recent analysis of data from 11 million workflows on the CircleCI platform suggests that, after an initial spike of activity in the early days of the pandemic, DevOps teams settled into a more deliberate pace of application development after quickly adjusting to what has become the new DevOps normal. That new normal is likely to change again once COVID-19 vaccines become more widely distributed, but there will certainly be no returning to the way applications were built and deployed prior to the pandemic.

  • LinearB Aligns with Clubhouse to Advance Project Management

    LinearB Aligns with Clubhouse to Advance Project Management

    LinearB, a provider of an analytics application for software delivery projects, announced today it has allied with Clubhouse, a provider of a project management application that includes built in collaboration tools.

    LinearB’s analytics application uses code, Git logs and releases to automatically construct and visualize detailed timelines without requiring any manual input. That data can now also be automatically fed into the Clubhouse project management application.

    Dan Lines, COO, LinearB, said the goal is to make it possible for any project participant to keep track of updates without spending hours manually compiling and entering data into a project management application.

    In addition, DevOps teams can use both applications to gain visibility into every feature, bug and chore via a live feed of activity generated by branches, pull requests and releases for Clubhouse stories. Along with tools for tracking individual activity and collecting metrics, blockers, delays, high-risk code and branches merged without review for Clubhouse stories are also highlighted. There is also a shadow work detector that detects activity in a Git repository that is not attached to a Clubhouse story.

    Lines said one of the project management challenges organizations face today is the tools they employ only allow them to see segments of a DevOps pipeline. The LinearB analytics application unifies the data and metrics required to make an informed decision, without having to first collect and then normalize data residing in different tools. Instead, all the metrics required to make an informed decision about how best to allocate limited software development resources is automatically collected from the tools the DevOps team employs, Lines said.

    There is no need, then, for project managers to pester members of a DevOps team to enter data in a separate analytics or project management application, Lines added. Given the rate at which application development projects are now updated, much of the data manually entered into a project management application is usually outdated, anyway.

    LinearB employs the application programming interfaces (APIs) exposed by DevOps tools to gather the existing metadata about the status of any given project. LinearB then employs machine learning algorithms to construct and correlate that data to give DevOps leaders more accurate insights into the status of a project, instead of requiring that data to be entered manually.

    In fact, Lines said meetings should be shorter, too, because rather than the need to provide a status update, it will become apparent to everyone what the real status of a project is before a meeting even starts. That means more time can be allocated to determining how best to optimize limited application development resources, Lines said.

    In the wake of the COVID-19 pandemic, organizations have more application development initiatives underway than ever. Many of these projects are core to digital business transformation initiatives which a core group of developers are working on simultaneously. Being able to dynamically reallocate resources to a faster-moving project from one that is stalled is increasingly critical. The challenge has been that the more projects there are, the harder it becomes to collect data that accurately reflects their true status at any given time. The goal should be to eliminate the need to reenter data that, in one form or another, already exists in another tool.

  • Survey: DevOps Growing Pains in Salesforce Environments

    Survey: DevOps Growing Pains in Salesforce Environments

    IT organizations that have adopted software-as-a-service (SaaS) application platforms from Salesforce in part to jumpstart their digital business transformation initiatives are experiencing some DevOps growing pains.

    A survey published this week of 230 executives, managers, and members of Salesforce delivery teams conducted by Beagle Research on behalf of Copado, a DevOps platform for IT teams building custom applications, shows that while 82% have increased or maintained the size of their Salesforce development teams, the change fail rate jumped from 23% last year to 33% in 2020 when compared to a similar survey conducted a year ago. The survey also notes time to recover increased from 110 hours in 2019 to nearly 196 hours in 2020.

    Andrew Leigh, chief marketing officer for Copado, said those results generally reflect the nature of the more complex application initiatives being launched on top of Salesforce applications. The survey also noted 55% of respondents don’t consistently automate their Salesforce deployments, with less than a quarter of respondents (23%) having a way of automatically deploy a configuration from development through testing to production.

    In fact, in teams with fewer than 10 members, only 28% of survey respondents automated Salesforce deployments compared to 56% of teams with more than 100 developers that have automated their deployments, the survey found.

    The survey also noted that more than a third (34%) of respondents said features that development teams create may not be adopted. That issue suggests there is more work to done in terms of better aligning development teams with the goals of the business, Leigh said.

    Organizations building applications on top of Salesforce don’t typically embrace DevOps best practices until development teams have 25 or more members, Leigh noted. Salesforce environments generally require their own DevOps platform, because applications are constructed using a set of objects and tables unique to the platform. Those objects and tables are most often invoked using a set of low-code application development tools. Nearly three-quarters of respondents (73%) employed at least one commercial Salesforce development tool.

    Overall, the survey finds 82% of organizations have increased their budgets for or effort toward digital transformation, with 53% reporting they have exceeded their performance goals for the year. The survey also identifies a set of elite DevOps performers that are reporting 30x shorter lead times; 46x more frequent deployments; 5x lower change fail rate; and 37x shorter time to restore. Elite performing teams are 65% more likely to have adopted continuous integration than low performing teams, the survey notes.

    More than half of respondents (53%) said that they found it easy to find people who have DevOps experience in a Salesforce environment, with salaries typically in the $90,000-$140,000 range.

    The survey also finds the majority of organizations (82%) expect the systems integrators they contract to build applications to help define their DevOps processes.

    As organizations continue to adjust to new business realities in the age of COVID-19, there’s no doubt more custom applications will be built and deployed on top of SaaS application platforms such as Salesforce. The challenge is finding the best way to accelerate the development of those applications in a way that consistently produces the desired result.

  • EraDB Launches Log Management Alternative

    EraDB Launches Log Management Alternative

    EraDB today launched EraSearch to provide IT teams with an alternative to open source ElasticSearch software for managing logs at scale.

    Todd Persen, EraDB’s CEO, said EraSearch is based on a modern database that decouples storage and compute. In this way, EraSearch can scale more efficiently than ElasticSearch, while providing IT teams with the same familiar construct for managing logs.

    Persen said EraDB also uses true zero-schema data representation, and an indexing engine based on machine learning algorithms, to enable EraSearch to scale better. This approach also cuts cloud and operational costs by as much as 30% and 70%, respectively, by relying, in part, on object-based storage systems to store log data.

    As IT environments become more complex and continue to scale, organizations that standardized on ElasticSearch are discovering that a platform based on decades-old search engine technology is not keeping pace with their needs.

    EraSearch provides an alternative, based on a commercial time-series database platform that EraDB created, to address such use cases as an alternative to database platforms such as InfluxDB.

    The question is whether IT organizations, that have relied on ElasticSearch for years, are ready to abandon an open source platform in favor of a proprietary platform, even if it provides a similar user experience. EraDB, however, is betting there are enough IT organizations willing to make that shift to justify its investment in EraSearch.

    Persen said one issue with ElasticSearch is that, as log volumes increase beyond a few terabytes, the platform becomes inefficient and difficult to efficiently scale. That leads to higher costs in terms of both raw storage, as well as all the manual effort on the part of software engineers, required to maintain the platform.

    EraDB, of course, is making a classic case for a proprietary platform over an open source platform: that open source, while free, often proves more expensive to support. Persen said EraDB decided to eschew the open source model altogether, because it is too difficult to prevent nullification of the benefits open source could bring to a small company by open source project forks.

    The ElasticSearch community, meanwhile, is roiled by Elastic’s decision to change the licensing terms under which it makes ElasticSearch available. Elastic is shifting away from an Apache license to a dual-license strategy that includes a Server-Side Public License, or SSPL, along with an Elastic License. That shift was made to help ensure more of the revenue generated by Elastic search winds up in the hands of Elastic, rather than cloud service providers, such as Amazon Web Services (AWS), that routinely launch paid services based on open source code. AWS responded to the Elastic move by announcing plans to fork ElasticSearch code that it will now curate.

    Regardless of how that battle ends, however, EraDB is making it clear it views its platforms as too critical to its customers’ IT operations to get caught up in a similar maelstrom over business models and associated licensing terms.

  • Dynatrace Extends Reach of Observability Platform

    Dynatrace Extends Reach of Observability Platform

    Dynatrace this week updated its observability and software intelligence platform as part of an effort to expand its reach across modern enterprise IT environments.

    Announced at the online Dynatrace Perform 2021 conference, the company’s namesake platform can now capture logs from Kubernetes and Red Hat OpenShift as well as Amazon Web Services, Google Cloud Platform and Microsoft Azure cloud platforms.

    In addition, Dynatrace is adding support for open source log data frameworks such as Fluentd and Logstash. Those logs can now be centrally viewed via a Dynatrace Log Viewer that enables IT teams to search, analyze and segment both real-time and historical log data.

    Dynatrace also added a Cloud Automation Module based on Keptn, an open source tool for automating configuration of observability tools, orchestrating code tests and quality checks. Keptn was created by Dynatrace and is being advanced under the auspices of the Cloud Native Computing Foundation (CNCF).

    The company also launched a Software Intelligence Hub to make it easier to access more than 500 pre-configured integrations, as well as access tools for creating integrations without having to write code.

    Dynatrace also announced it has extended a previously launched Application Security Module to now include support for Node.js applications. In addition, the module includes the ability to enforce security policies against applications instrumented with its agent software, and offers extended capabilities to enable the detection of Kubernetes cluster vulnerabilities, as well.

    Finally, Dynatrace has added a Session Replay capability to its Digital Experience Module to enable IT teams to capture a mobile application experience.

    Steve Tack, senior vice president of product management at Dynatrace, said the company is moving quickly to add support for platforms and technologies widely employed within cloud-native applications to provide IT teams with a single platform through which they can manage monolithic and microservices-based applications.

    With the rise of microservices, IT environments are becoming too complex to manage without some type of observability platform. Historically, cost concerns limited IT teams to employing application performance management (APM) platforms, such as Dynatrace, only for their most mission-critical, monolithic applications. It’s now become apparent that observability platforms capable of correlating log and telemetry data captured from applications and infrastructure are required to effectively manage a modern IT environment.

    As part of that effort, Dynatrace is now collecting data from additional sources alongside the agent software it provides. That data is then fed into an observability platform, that Dynatrace has augmented with a Davis AI engine, to identify anomalies and other potential issues by employing machine learning algorithms.

    It’s not clear to what degree IT teams completely trust the recommendations surfaced by any AI engine. However, as platforms such as Dynatrace collect more data from an IT environment, the more accurate AI models tend to become. In fact,  IT teams that don’t have access to AI capabilities might soon be at a distinct disadvantage, compared to other IT teams that do.

    In the meantime, the battle for observability supremacy continues to intensify, as incumbent providers of APM platforms such as Dynatrace look to forestall a host of startup rivals, all promising greater visibility into IT environments at a lower cost. The challenge now is determining what level of visibility is achieved, and at what total cost.

  • New Relic Adds Visualization Tool to Observability Platform

    New Relic Adds Visualization Tool to Observability Platform

    New Relic announced today it has added a visualization tool, dubbed New Relic Explorer, to make it simpler for IT professionals to discover the root cause of issues that adversely affect application performance.

    Buddy Brewer, global vice president and field CTO for the Americas, New Relic, said the goal is to make it simpler for IT professionals to navigate and, ultimately, act on, all the metrics collected by the New Relic One observability platform.

    New Relic Explorer includes a New Relic Lookout capability that enables IT teams to drill down into telemetry data gathered from New Relic One, as well as other third-party sources, and a New Relic Navigator capability for determining the health of relationships between services, said Brewer. These capabilities make it possible to more easily identify correlations, abnormal history and traces that would be, for example, indicative of blind spots or unknown relationships between IT services, Brewer said.

    Just as importantly, IT professionals can more easily discover recent changes to an IT environment, which are most likely the cause of any new issue that is adversely affecting the IT environment, Brewer added.

    New Relic Explorer requires no configuration, and will be included as part of the existing New Relic Full-Stack Observability offering to give IT teams a single unified view of their IT environments, said Brewer.

    As IT environments become more complex, the amount of time spent looking for the root cause of an issue that might only take a few minutes to fix has substantially increased. As a result, organizations are allocating a significant amount of time to convene “war rooms” to identify the source of problems; those problems can now be more readily identified using New Relic Explorer.

    In general, Brewer said, New Relic remains committed to opening up the platform to external telemetry sources, including data collected using open source tools, such as Prometheus and OpenTelemetry agent software, both advanced under the auspices of the Cloud Native Computing Foundation (CNCF).

    New Relic, like providers of similar tools, has recently begun repositioning itself as a provider of an observability platform, rather than of application performance management (APM) tools, that provides insights into both applications and the infrastructure on which they depend. That approach promises to provide IT teams with more context any time an issue arises. As part of that shift, New Relic is making it clear that while it views its agent source as a richer source of telemetry data, its platform can consume relevant data wherever it can be found. New Relic will also remind customers that its agent software, and the other data collection tools it provides, are simpler to install and update.

    The tradeoff, of course, is cost. While open source software itself is free, the total cost of implementing and managing that open source software can be substantial. Regardless of approach, however, the days when IT teams only applied application monitoring tools to their most mission-critical applications because of cost concerns are coming to an end. It has become impossible to manage a modern IT environment made up of both monolithic and microservices-based applications without such capabilities.

  • Sauce Labs Acquires AutonomIQ to Advance App Testing

    Sauce Labs Acquires AutonomIQ to Advance App Testing

    Sauce Labs is acquiring AutonomIQ, a provider of a scriptless test automation platform based on machine learning (ML) algorithms.

    Matt Wyman, chief product officer for Sauce Labs, said the acquisition of AutonomIQ will play a critical role in enabling Sauce Labs to push testing further left toward developers and, ultimately, “citizen testers” that are becoming part of the DevOps testing tool chain.

    The acquisition of AutonomIQ comes on the heels of the company announcing its intent to acquire API Fortress, an application programming interface (API) testing platform provider. Terms of neither acquisition were disclosed.

    Wyman said the rise of DevOps coupled with an increase in the volume of applications being developed using low-code tools are the primary drivers of a need to shift testing further left. As more citizen developers are building applications, they require access to a testing platform that doesn’t require them to know how to write scripts to test applications, said Wyman.

    The AutonomIQ platform employs machine learning to understand, for example, natural language descriptions of test cases or captured mouse clicks. It then generates synthetic data and test cases that can self-heal when an application changes, said Wyman.

    That approach to testing is more feasible in software-as-a-service (SaaS) environments, where a custom application based on a platform such as Salesforce, ServiceNow, Workday, Oracle or SAP doesn’t tend to change as radically as an application being built from the ground up, Wyman said. Those classes of applications will still require either developers or a dedicated team of testers to build tests using scripts, said Wyman.

    In fact, Wyman said testing those applications is becoming more challenging in the age of microservices. The API Fortress acquisition addresses that issue, because microservices are dependent on APIs to communicate with other microservices, said Wyman. In general, Wyman said Sauce Labs is now moving beyond being focusing only on functional testing of user interfaces.

    It remains to be seen how quickly testing will move to the left. Developers are being held more accountable for the quality of their applications, so testing integration within the application development process has increased. This has led to application testing becoming more tightly integrated with continuous integration/continuous delivery (CI/CD) platforms. Less clear is to what degree those efforts might have reduced the burdens of a dedicated application testing team that typically evaluates applications after they have been constructed.

    Exactly where and how citizen testers are being incorporated into those processes is also unclear. In theory, citizen testers can bring more business process expertise to the testing process. Getting individuals with that level of expertise to make time to participate in application testing while an application is being built can be a challenge.

    Regardless of approach, however, it is already apparent that machine learning algorithms, along with other forms of artificial intelligence (AI), will play a much larger role in application testing in the coming months and years.

  • Lightstep Delivers Next Generation Observability Platform

    Lightstep Delivers Next Generation Observability Platform

    Lightstep this week announced general availability of a Change Intelligence observability platform based on a time-series database that is capable of processing a trillion events each day.

    Ben Sigelman, Lightstep’s CEO, said as IT environments become more complex, thanks to the rise of microservices and cloud-native computing platforms, existing monitoring and observability tools will not be able to keep pace with the rate of change in what have become highly dynamic IT environments.

    While AIOps promises to address that complexity by employing machine learning algorithms to analyze IT environments and surface recommendations, Sigelman said there will always be the need for observability platforms that enable IT teams to discover the root cause of an issue in a way that surfaces the insights needed to fix the problem in real-time.

    The Lightstep database was built by the same team that created Monarch, the globally-distributed in-memory time series database system that Google employs to monitor its applications and systems. Lightstep’s database makes it possible to collect metrics, in the form of distributed traces, at a level of scale that allows IT teams to analyze events across a distributed IT environment made up of both monolithic and microservices-based applications, said Sigelman.

    Lightstep is the latest entrant in an already crowded field of observability platforms, all seeking to consolidate the wide range of monitoring tools IT teams have used for decades.

    The challenge IT teams face is that each of those monitoring tools is focused on a narrow range of platforms. IT teams often lack context when an issue arises, and wind up trying to correlate reports from multiple monitoring tools in the hopes of discovering the root cause of an issue. Observability platform providers are making the case for a single platform that correlates application and infrastructure events in a way that makes it easier for IT to fix issues faster.

    Observability, of course, has been a core tenet of DevOps for years. The tools for achieving that goal, however, have been cumbersome to implement and maintain using legacy application performance management (APM) platforms. Most of those platform providers, have rolled out what are positioned as next-generation observability platforms. Now, IT organizations will need to decide if they want to maintain investments in existing platforms versus moving to one of the raft of upstarts looking to dethrone APM incumbents.

    The startups are counting on a massive expansion in demand for observability platforms. IT organizations have tended to limit their usage of APM platforms to mission-critical applications due to cost and the challenges associated with maintaining the agent software needed to collect metrics from each application. Modern observability platforms have automated much of the metrics collection process, while open source software promises to make metrics collection more affordable..

    The challenge, of course, is that many organizations are already struggling to manage complex IT environments, and can’t necessarily wait for that open source software to mature.