Category: DevOps Toolbox

  • Codenotary Uses Immutable Database to Verify Software Artifacts

    Codenotary Uses Immutable Database to Verify Software Artifacts

    Codenotary today unfurled a free notarization and verification service for open source artifacts and containers to enable IT organizations to track the provenance of the components that make up their applications.

    Dennis Zimmer, Codenotary CTO, said the Community Attestation Service is based on an immutable open source immudb database that cryptographically attaches an identity to each software artifact. Additionally, the Community Attestation Service can be integrated with the continuous integration/continuous delivery (CI/CD) platform that DevOps teams employ to build and deploy applications using those artifacts, added Zimmer.

    The identities created by the Community Attestation Service can then be used to verify a software bill of materials (SBOM) that will soon be required by not only every U.S. federal agency but also organizations that are trying to better secure their software supply chains in the wake of a series of high-profile breaches, said Zimmer. The Community Attestation Service will also encourage developers to reuse source code, builds, repositories and Docker container images that they know they can reliably employ within a zero-trust IT environment, noted Zimmer.

    Some developers have, of course, been signing their code for years, while others simply didn’t see the need. With its free service, Codenotary is trying to expand the pool of developers that will not only sign their code but do so in a way that can’t be tampered with later, noted Zimmer.

    Unlike blockchain databases that are employed to provide immutable records of transactions, Zimmer said the immudb platform was created to provide an immutable database capable of processing millions of transactions per second. That database is also being used to build a wide range of applications that go beyond the scope of the Community Attestation Service so DevOps teams can have confidence in the viability of the underlying platform, noted Zimmer.

    In the wake of some troubling security breaches, it’s now only a matter of time before security teams start to ask more difficult questions about how applications are built. Developers could wait for those cybersecurity teams to eventually create policies that DevOps teams would be required to enforce, or they can more proactively embrace a service that tracks the provenance of code that hopefully, has been scanned for all known vulnerabilities. In fact, it may not be too long before organizations decide not to employ code that has not been verified. There may even be a backlash against using code that is unsigned that could result in many existing applications either being updated or outright replaced.

    On the plus side, Zimmer noted there’s a lot more awareness of the need to sign code. The challenge is most organizations don’t have the processes in place. Fortunately, there’s a lot more interest in DevSecOps best practices to ensure the integrity of code. However, awareness of the need for something doesn’t always result in concrete actions being taken unless DevOps teams can simply make it easy for developers to do the right thing. After all, it’s not as though developers want to employ insecure code, it’s just that they are often simply too busy to make sure every last artifact employed is verified as secure.

  • FinOps Cloud Cost Optimization via Governance-as-Code 

    FinOps Cloud Cost Optimization via Governance-as-Code 

    Cloud implementations continue to grow in scope and complexity. Too often, this expansion also means costs keep spiraling out of control. In this article, we’ll examine why the emerging practice of cloud financial management (FinOps) is so essential to containing costs in the cloud. We’ll then discuss the challenges teams encounter as they start to apply FinOps approaches. Finally, we’ll reveal the opportunity presented by employing governance-as-code to establish continuous cloud cost optimization—and how this approach makes it practical for teams to put the theory of FinOps into practice so they can keep cloud costs in check.

    The Emergence of FinOps

    For many organizations, there’s been a race to leverage cloud services, with teams seeking to realize advantages in flexibility, agility and efficiency. Within an organization, it’s not only a matter of more workloads running in the cloud, it’s a matter of more distinct deployment models being used, more teams using cloud services and leveraging multiple service providers.

    In the process, teams have had to contend with rapid growth in the size and diversity of the implementations that have to be managed—and paid for. It is this latter aspect that has been a rude awakening to those responsible for managing budgets. Left unchecked, this growth in cloud use has led to spiraling costs and predicting, managing and controlling these costs only grows more difficult as deployments get more complex and more frequent.

    This need for improved cost management has given rise to a new discipline: Cloud financial management; or FinOps. In short, FinOps is a way of bringing financial discipline and accountability to the variable-cost paradigm found in the cloud. FinOps brings together a combination of technologies, processes and teams, including professionals from technology, finance and business. By gaining an improved ability to understand, track and manage cloud costs, teams can begin to maximize the value realized through their cloud expenditures. Given the strategic and urgent nature of cloud cost management, it’s not surprising that FinOps teams are growing. According to research conducted by the FinOps Foundation, FinOps teams expanded 47% over last year, and these professionals are expecting their teams to grow 75% in the next year.

    Challenges in Establishing FinOps

    While there’s a lot of promise behind the establishment of FinOps practices, there are also many obstacles standing in the way for teams. When the FinOps Foundation queried respondents about top challenges, these were the top five responses:

    • Getting engineers to take action (39%)
    • Dealing with shared costs (33%)
    • Accurate forecasting (26%)
    • Reducing waste or unused resources (25%)
    • Full allocation of costs (23%)

    Lacking comprehensive control and visibility over multi-cloud environments means these teams can’t proactively manage costs—and too often find out about wasted expenditures and high costs of underutilized resources after the fact. Because stretched teams are reliant upon manual follow-ups and tactics, it is difficult to get engineers to respond as quickly and effectively as needed.

    Compounding these challenges is the fact that across teams, different tools and processes are used. For example, different development teams might be using different provider services along with varying deployment tools, such as AWS Cloud Formation, HashiCorp Terraform, Kubernetes and so on. This inconsistency introduces inefficiencies and miscommunication and stifles team productivity.

    While the cloud offers a range of benefits compared to legacy, on-premises infrastructure, without proper governance, cloud costs can quickly spiral out of control. In fact, Gartner analysts report that in the next few years, 60% of organizations will encounter cost overruns in public clouds.

    Rethinking Cost Management

    For all the reasons articulated above, teams are being asked to take a new approach to cloud cost management, one that aligns with the principles of FinOps. For many, this means embracing the concept of governance-as-code to optimize cloud costs. Cloud governance-as-code represents a way to automatically and dynamically apply policies, including for cost optimization, in fast-changing cloud environments.

    With governance-as-code approaches, policies are defined using a standard language. Code associated with cost policies is created, deployed and maintained in much the same way developers manage application or infrastructure code. Developers don’t have to worry about tracking or managing costs. Cost policies are continuously evaluated against current state, utilization and configuration of cloud infrastructure. If any violations occur, automated notifications and workflows can be triggered. Here are the key requirements for using governance-as-code to establish continuous cloud cost optimization:

    Cost Policies are Defined via an Intuitive Language

    Traditionally, development, operations and financial groups worked in silos. Each team had its own tools, workflows and policies, and even fundamental terminology could vary substantially.

    To maximize the potential of continuous cloud cost optimization via governance-as-code, solutions need to enable teams to define, manage and revise policies using an easy-to-understand, consistent language. This makes it much easier for different teams to collaborate and gain alignment on key cost management policies and best practices.

    Finally, to be effective in establishing continuous cloud cost optimization, governance-as-code offerings need to employ a language that is independent of any specific programming languages that application developers may use. Further, these languages should be applicable to the broadest set of applications, cloud services, development tools and so on. This is vital to ensure that development teams retain maximum flexibility in the tools and services they can use.

    Cost Policies are Managed and Deployed via Git Within CI/CD Workflows

    Once policies are reviewed and finalized, teams must be able to apply these policies within the development organization’s existing continuous integration/continuous delivery (CI/CD) workflows.

    Through robust governance-as-code approaches, teams can create cost policies as code artifacts and deploy them via open source version control systems like Git. Through this approach, teams can apply policies in a manner consistent with their software development and delivery life cycles.

    By codifying cost governance in this way, cost controls can be deployed via Git within a CI/CD pipeline. This approach enables teams to avoid complex manual processes associated with tasks like managing tickets, requesting changes and so on. This also helps teams keep up with the accelerating pace of today’s dynamic cloud and development environments. Further, this approach means governance code can be traced through various state changes, rolled back if needed and so on, just like application code.

    Cost Policy Violations are Detected and Addressed in Real-Time

    Through continuous cloud cost optimization via governance-as-code, teams are  empowered to institute not only continuous detection but also immediate action. Policies can be employed at regularly scheduled intervals or they can be triggered based on certain events.  This approach enables enforcement of workflows and actions that may be required. If policy violations occur, notifications to relevant teams or team members can happen automatically and advanced workflows can be triggered. For example, a policy could identify RDS instances greater than 30 days old that have had no connections in the last 14 days. It would then notify the owners of these instances. If they don’t take action in seven days, the instances could automatically be stopped.

    Cost Policy is Continuously Enforced and Refined

    Continuous cloud cost governance-as-code has a never-ending life cycle, just like the team’s software development life cycle. Cost governance code is built, deployed, tested and released, and the process continues as new policies are developed and refined over time. As requirements change, teams need to be able to periodically analyze cost data and update policies as needed.

    As organizations continue to invest larger sums in their cloud implementations, the need to establish strong FinOps capabilities will only grow more critical. However, as these cloud deployments continue to grow more complex, it can get increasingly difficult to realize the promise of FinOps. For these reasons, employing governance-as-code to establish continuous cost management is emerging as a key approach. With this approach, teams can achieve sustained compliance and minimize waste.

  • New Relic Acquires CodeStream to Close Observability Gap

    New Relic Acquires CodeStream to Close Observability Gap

    New Relic today revealed it has acquired CodeStream as part of an effort to make observability data more accessible to developers.

    Buddy Brewer, group vice president (GVP) and GM at New Relic said New Relic CodeStream makes application telemetry data collected via the New Relic One platform directly available within an integrated development environment (IDE), now including Microsoft VS Code. In addition, there are also integrations with Microsoft Teams and the GitHub repository.

    The goal is to close an observability gap that exists today between developers and IT operations teams that stems from a lack of developer visibility into production environments, he noted.

    Finally, New Relic is also announcing a core user pricing option for New Relic One that is aimed at developers. Starting at $49 per month, developers gain access to a core set of capabilities such as CodeStream integrations, errors inbox, logs, GraphQL application programming interfaces (APIs) and the ability to build and run custom applications on New Relic One.

    Peter Pezaris, CodeStream co-founder and CEO, now GVP and GM, strategy and developer tools at New Relic, said becoming part of New Relic will make it easier to bridge the divide that exists between most developers and IT operations teams by making it much easier for developers to see how their code is actually executing in a production environment. That capability will eliminate scenarios where code that runs just fine on a laptop executes poorly in a production environment, he added.

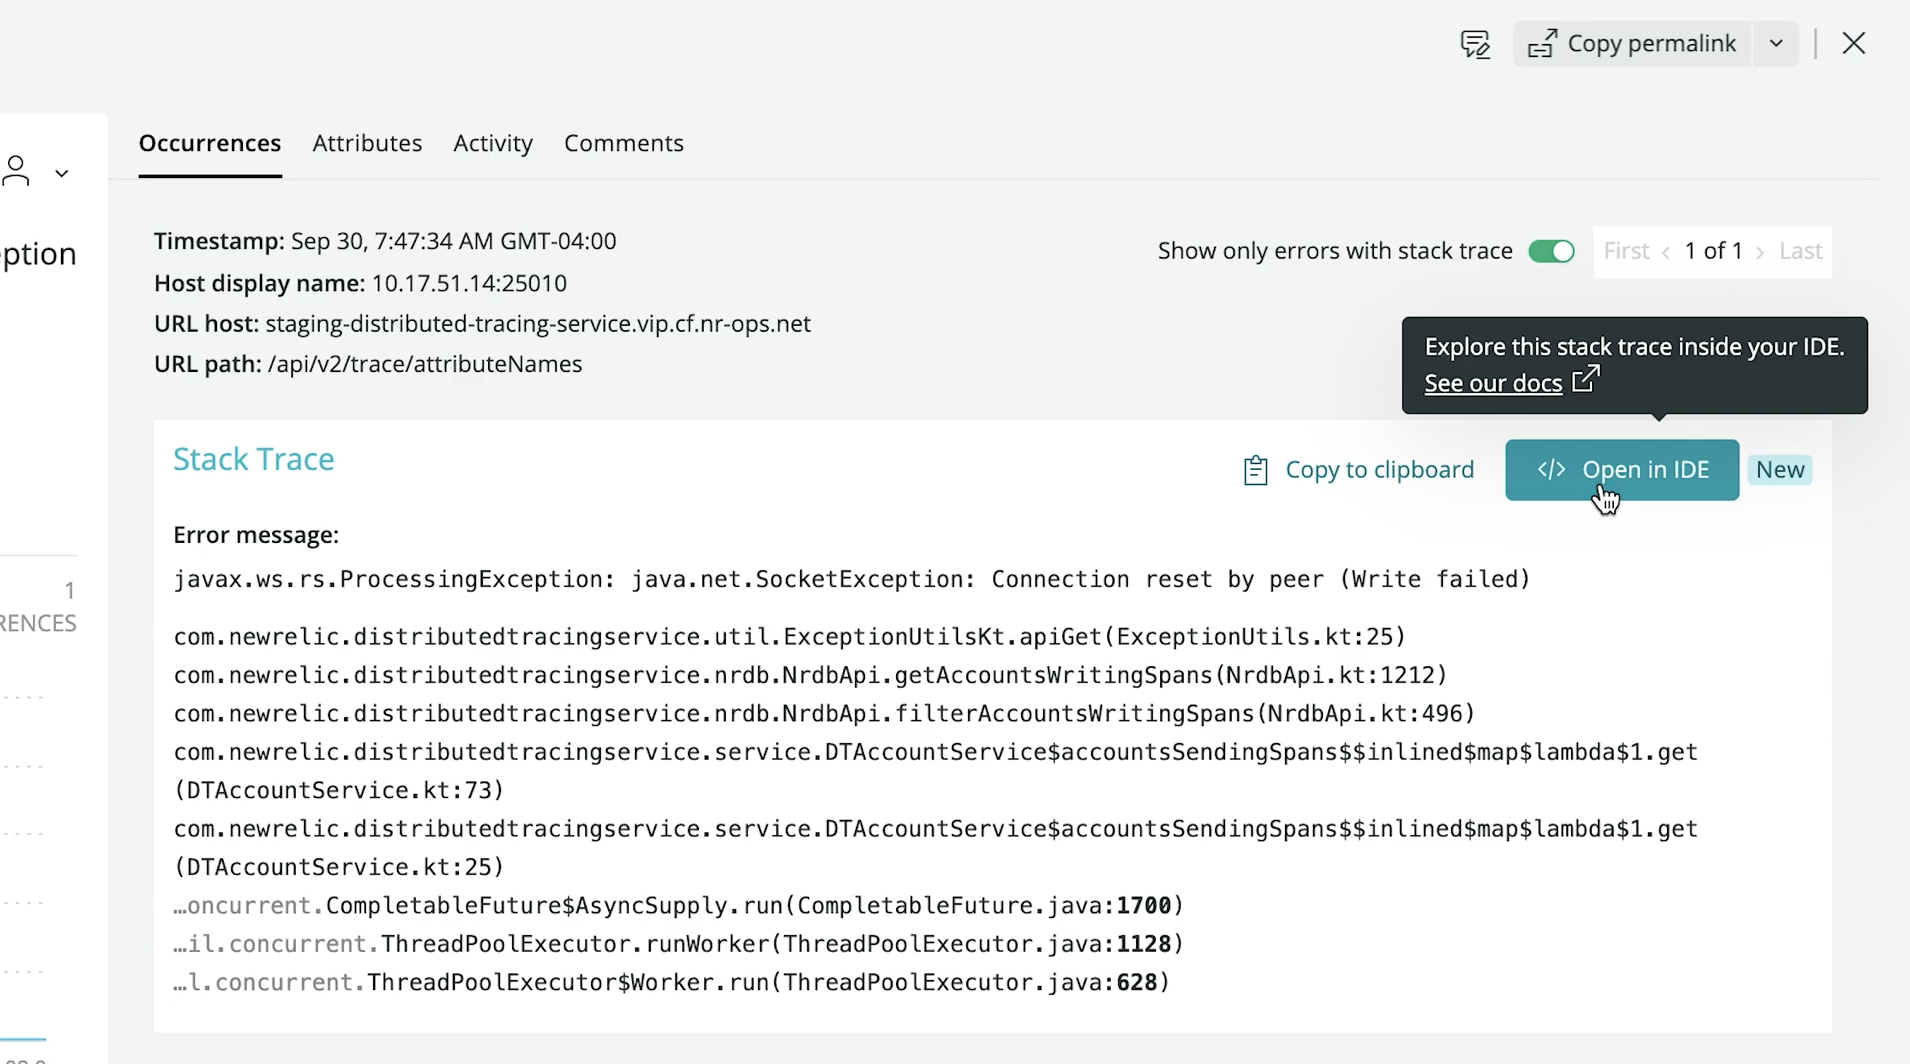
    Developers can also add inline code comments, trigger pull requests, request feedback and track issues directly from their IDE via integrations with a wide range of developer and communication tools. Developers also can switch from New Relic One into an IDE in a single click to navigate, triage and remediate production errors in the context of the code they wrote.

    New Relic is initially making New Relic CodeStream available for free—no credit card required—during a preview period that extends to January 12, 2022. Afterward, some of the more advanced features will require a paid user license once free tier limits are reached. Similarly, IT teams can also sign up for a free New Relic One account without entering a credit card to instrument their applications.

    As the responsibility for managing applications in production environments continues to shift left, Pezaris said it’s critical to give developers the tools they need to optimize code in a production environment.

    It’s not quite clear exactly how much responsibility for applications is shifting left toward developers; it differs from one organization to the next. Many are simply trying to reduce as much friction as possible between developers and their IT operations teams by providing more ‘connective tissue’ from New Relic that IT teams would have to otherwise write themselves, noted Pezaris.

    It may take some time to bridge the observability gap between developers and IT operations teams. Most IT operations teams are still coming to terms with what observability provides that existing IT monitoring tools don’t. Monitoring, at its core, focuses on predefined metrics to identify when a specific platform or application is performing within expectations. The metrics tracked generally focus on, for example, resource utilization. In contrast, observability combines metrics, logs and traces—a specialized form of logging—to instrument applications in a way that makes it simpler to troubleshot issues without having to rely solely on a limited set of metrics that have been pre-defined.

    In theory, at least, that level of observability should ultimately reduce the total number of incidents an IT operations team needs to fix by identifying issues long before they become an actual disruption.

  • HashiCorp Previews Updates to Consul Service Mesh

    HashiCorp Previews Updates to Consul Service Mesh

    During an online HashiConf Global conference, HashiCorp today made available a beta of an update to its open source Consul service mesh for virtual machines and Kubernetes clusters that makes it possible for multiple administrators to share the same instance of a multitenant service mesh.

    Version 1.11 of Consul will also add support for a command line interface (CLI) for Kubernetes that will provide an alternative to Helm charts for installing Consul on those clusters.

    Raymond Austin, director of product marketing for HashiCorp, said it’s become apparent that there is a need for a higher level of abstraction for managing application programming interfaces (APIs) that is easy to deploy across both legacy IT environments based on virtual machines and cloud-native environments based on Kubernetes clusters.

    Of course, in many cases, those Kubernetes clusters are deployed on top of virtual machines. However, there are also now more instances of Kubernetes being deployed on bare metal platforms at, for example, the network edge.

    As IT environments become more complex, a service mesh makes it simpler to discover, access and secure APIs that are now rapidly proliferating across the enterprise. That transition requires a more dynamic approach to not only managing APIs but also the network services those APIs depend on, added Austin.

    HashiCorp is betting that many IT organizations will prefer to rely on a lightweight open source platform supported by a single vendor rather than relying on more complex open source service mesh offerings being developed under the auspices of a consortium.

    It’s still not quite clear who within an IT organization is assuming responsibility for deploying a service mesh. Most often, it’s a development team that makes the initial decision. However, as IT operations teams become more aware that service meshes represent a capability that needs to be horizontally made available across multiple applications, it may be only a matter of time before some organizations decide to standardize on a single service mesh to reduce operational overhead, noted Austin.

    Service meshes will also play a critical role in simplifying management of networking and security services at a higher level of abstraction within a larger DevOps workflow.

    It’s still early days as far as service mesh adoption in the enterprise is concerned, but there are already a large number of service mesh options. In fact, there may never be a single dominant service mesh platform. Interoperability standards still need to be ratified that enable organizations that have standardized on different service meshes to apply policies to microservices spanning hybrid cloud computing environments.

    Of course, not every IT organization requires a service mesh yet, either. Many IT teams can still get by using a traditional proxy server or an API gateway until the number of microservices-based applications deployed starts to achieve critical mass. One way or another, however, the more APIs there are to manage, the more inevitable it becomes that an IT team will deploy a service mesh.

  • Say Goodbye to Late-Night SRE Wake-Up Calls

    Say Goodbye to Late-Night SRE Wake-Up Calls

    Thousands of SREs, on-call engineers and DevOps pros all over the world dread nothing more than the late-night incident alert. The pager buzzing at 2:00 a.m. can cause panic for SREs and leave IT and DevOps teams with quite a mess to contain. But incident response doesn’t have to cause panic if you have the right automation tools in place. If you have ever wondered why companies like Amazon, Google and Zoom rarely suffer service outages and downtime while other companies struggle to achieve similar efficiencies, you’re not alone. In fact, you’re halfway to understanding what makes incident response automation such a vital component of your workflow. 

    Without a doubt, the best way to take back control over manual incident response and—once again—sleep through the night is to implement a powerful automation solution for incident response. We’ve listened to stories from SREs around the globe about the benefits of automated incident response. Plus, we’ve experienced them ourselves (from companies like Cisco, for example).  In the end, we’ve learned a thing or two about creating efficiency by leveraging automation and integration. Below, we’ll briefly cover how leveraging automation to remediate issues with or without a human in the loop is the best way to say goodbye to 2:00 a.m. wake-up calls.

    An Overview of Incident Response

    First, a staggering fact: In 2019, 17% of global enterprises lost more than $5 million every hour their servers were down, according to Statista. Even for smaller companies, the cost of servers going down is enormous. Following the news of Facebook’s recent outage (losing $13.3 million an hour; not counting the loss from the stock price drop), the need for minimizing downtime and reducing these costs is clear. 

    In order to fix issues faster, organizations need an easy-to-use tool that SREs and DevOps teams can implement to troubleshoot and automate incident response. For one, users should opt for a drag-and-drop system. This method is preferred over headless automation tools that too often result in data loss and extended downtimes.

    Next, IT organizations need to take the next step with automation and implement best practices. We can go from asking “How do we bring in automation?” and start to think in terms of “What are the use cases when I do?” A winning incident response toolset will help customers navigate this challenge. An automation platform should also allow users to fine-tune workflows with a library of connectors and actions that are comprehensive enough to get the job done. Ideally, your cloud stack should include several functions such as alerting (such as PagerDuty), monitoring (like Datadog) and analytics (Splunk, for example), while integrating with collaboration tools like Slack and Jira.

    What Are Some Typical Use Cases?

    Let’s dive deeper into three use cases that incident responders and engineers commonly encounter. These examples demonstrate why a powerful automated platform lets small businesses automate effectively and ensure long-term uptime just like larger enterprises.

    Incident Response Automation

    It’s all hands on deck when that 2:00 a.m. incident response alert goes off. Why rely on manual responses which can often lead to broken uptime SLAs and even drag down a company’s reputation? Automation is the key to operating any large-scale service in the cloud.

    Cost Management

    The costs of extended periods of downtime don’t stop at the checkbook. When incidents occur without drag-and-drop automation, long-term side effects can dramatically up the company’s losses.

    Orchestration

    Orchestrated automation tools provide credential management, templates, playbooks and data processing for any company size. They empower users to curate services to their liking as well.

    Want to Learn More about Automated Incident Response? 

    Sign up for this upcoming devopsy.kinsta.cloud webinar on Monday, October 25th at 3:oo p.m. Eastern. We hope you’ll join us to learn more about how to integrate automation into your workflow and stop those pesky 2:00 a.m. wake-up calls.

  • Splunk Expands Scope of Observability While Lowering Costs

    Splunk Expands Scope of Observability While Lowering Costs

    During its online .conf21 conference Splunk Inc. today revealed a bevy of updates that advance observability while at the same time reducing the total cost of deploying its platforms.

    As part of that effort, Splunk also announced it will now make workload-based pricing available to all customers.
    Previously, a select number of small customers had access to workload-based pricing while other customers licensed Splunk platforms based on how much data was loaded into the platform. That approach, however, tends to discourage IT teams from loading as much of their data as possible.

    CEO Doug Merritt said workload pricing was created to enable a value-oriented pricing model that customers could employ instead of a data-centric model that can discourage IT teams from analyzing as much data as possible to improve IT operations.

    To further lower total costs, the company is also previewing a Flex Index option for customers that choose workload-based pricing to enable longer retention for lower-value data at a lower cost. Splunk is also expanding its cloud storage to include a preview of SmartStore, which allows larger volumes of data to be stored more cost-effectively on Microsoft Azure Cloud initially with support for Amazon Web Services (AWS) and Google Cloud Platform (GCP) forthcoming.

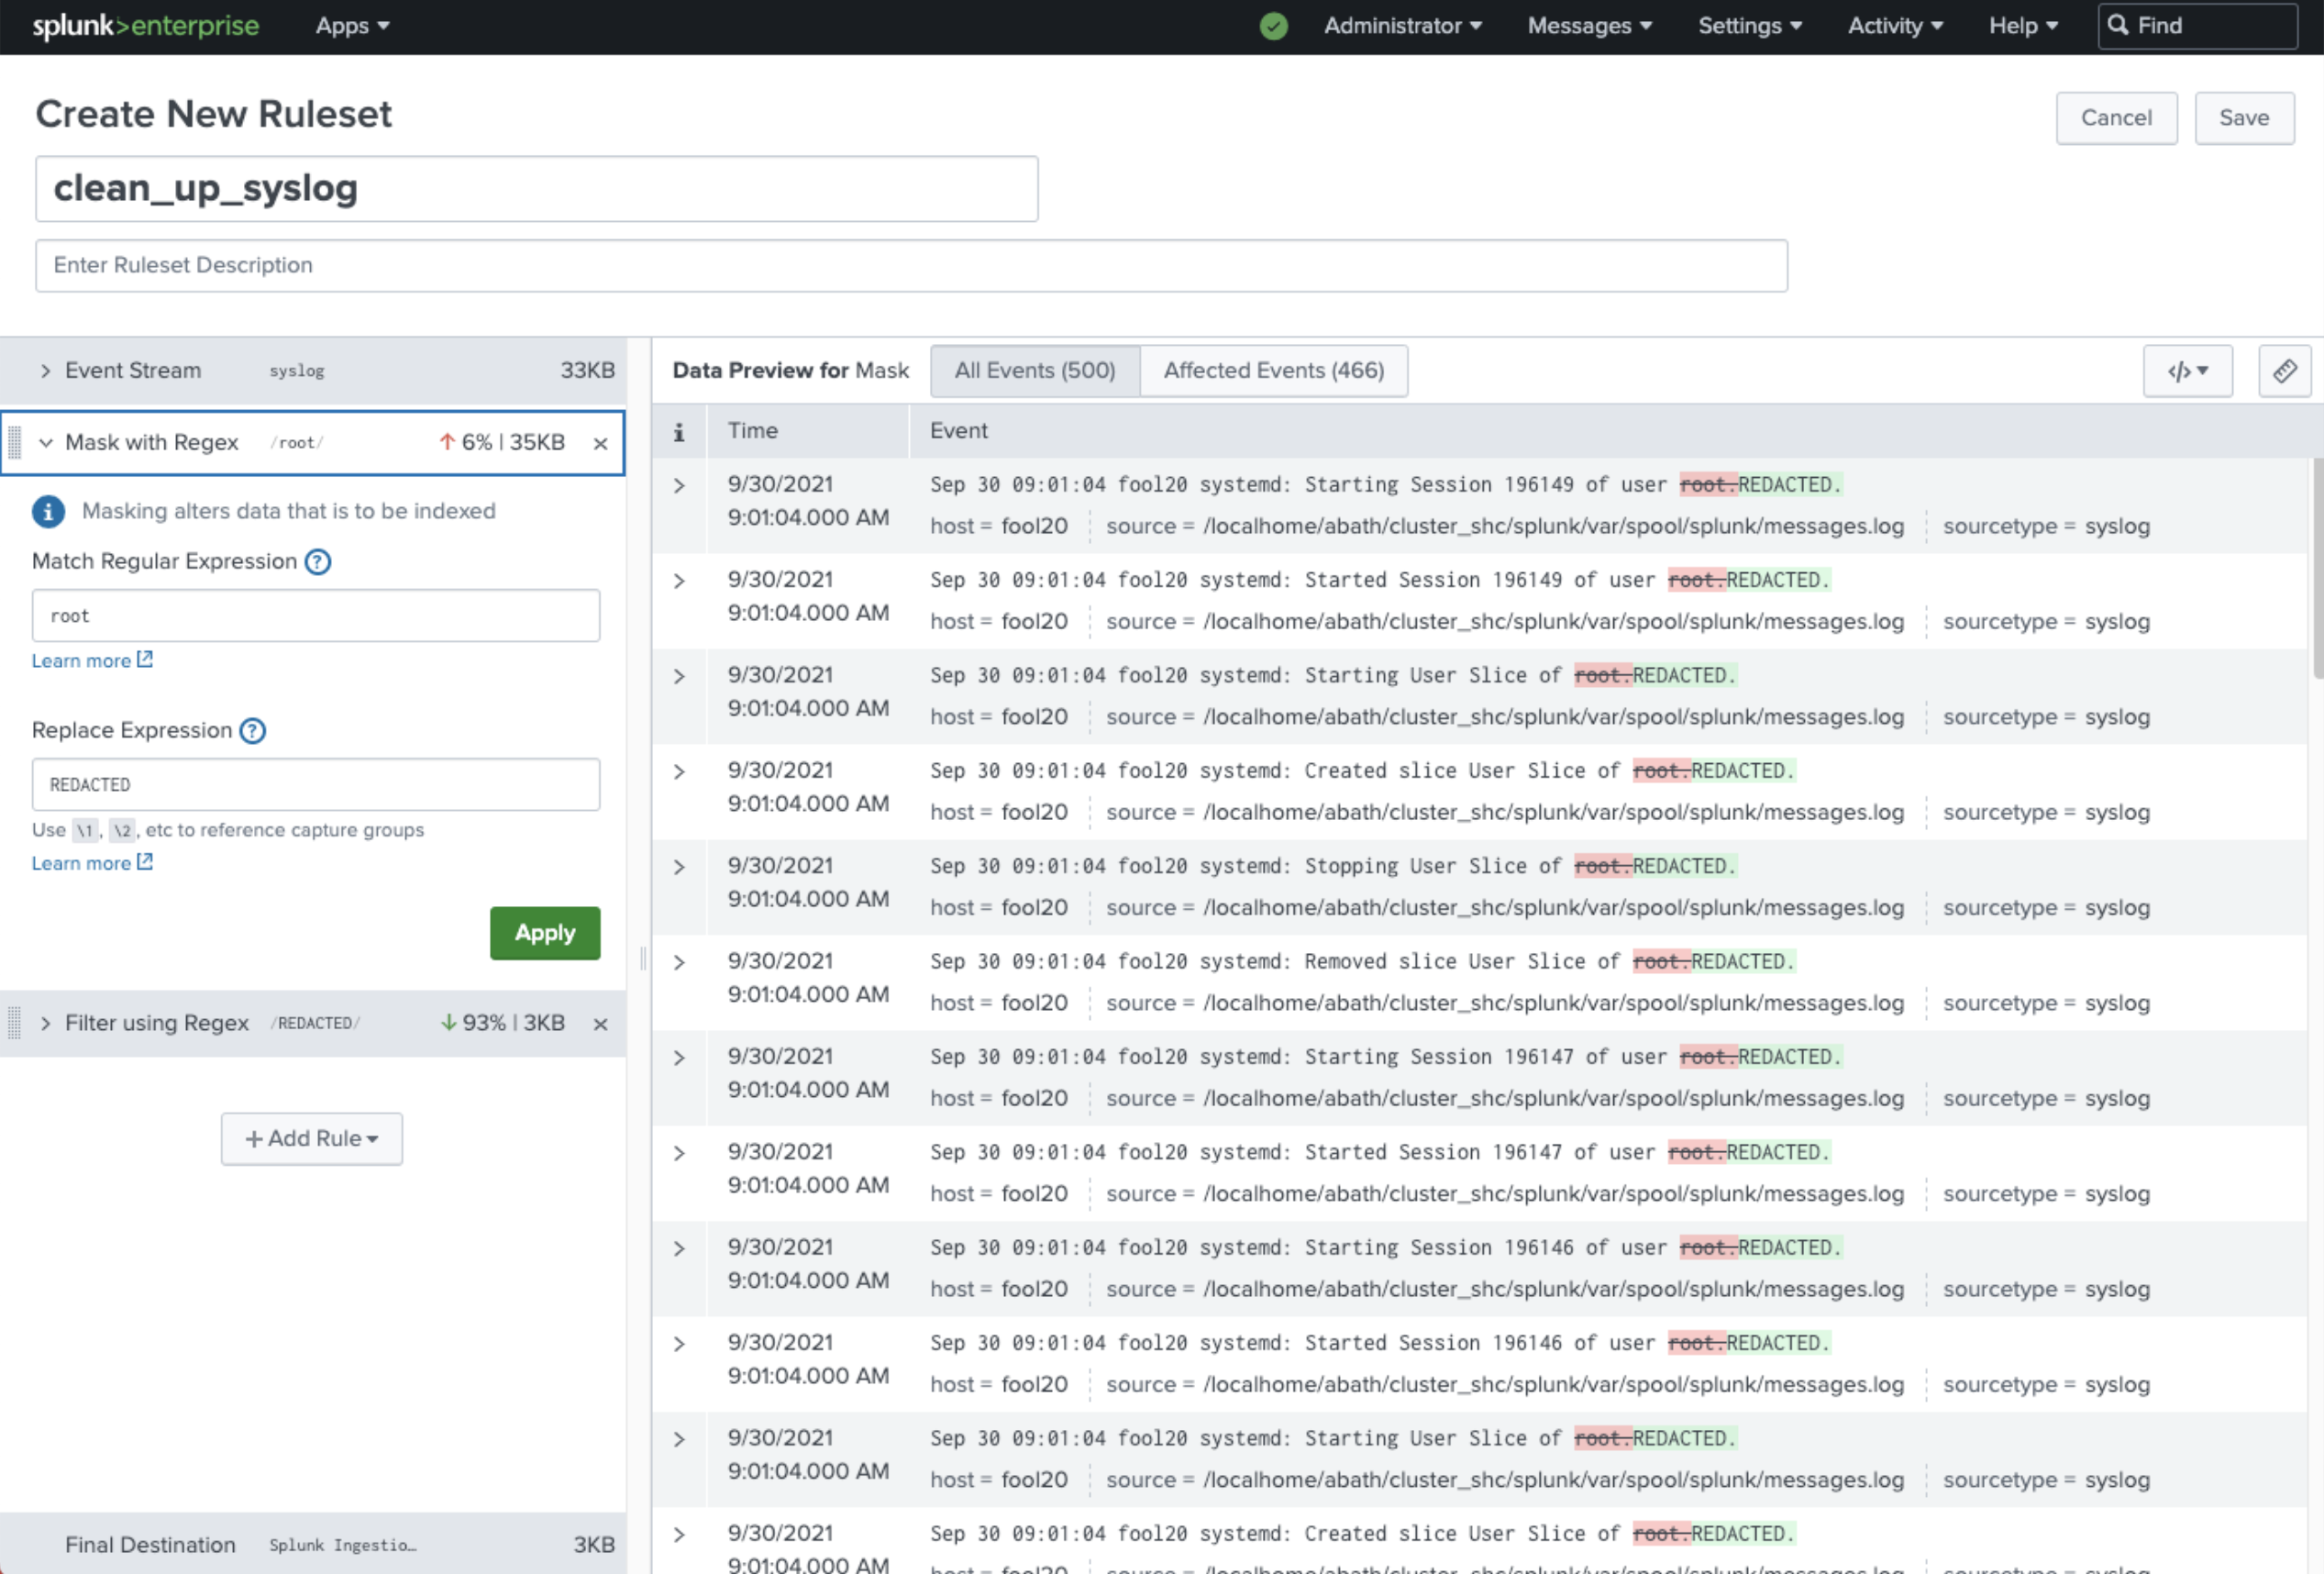
    Other enhancements to the portfolio include a preview of a data manager, a revamped onboarding tool for data stored in Amazon Web Services (AWS) and Microsoft Office 365, and Ingest Actions, which enables IT teams to act on data in motion in addition to data at rest stored in Splunk or the S3 cloud service from AWS.

    The company is also now making it easier to find and explore data via a federated search tool and a Splunk Dashboard Studio offering, available via Splunk Mobile, that makes it easier to create dashboards.

    At the same time, the company is also making available Splunk Operator for Kubernetes to make it easier to install its platforms in cloud-native environments. There is also now Splunkbase, a curated catalog that makes it simpler to find or develop a Splunk application.

    In terms of observability, the company is providing a preview of AlwaysOn Profiling for its application performance management (APM) platform, dubbed Splunk APM. AlwaysOn Profiling extends existing tracing capabilities to provide continuous code-level visibility and analysis.

    In addition, there is now a preview of an enhanced version of Database Visibility for Splunk APM, which automatically uncovers slow queries that are causing transaction latency without having to instrument a database.

    The company also announced that its real user monitoring (RUM) for mobile applications, which makes use of open source, now is generally available alongside the Splunk Observability Cloud for Mobile platform. The company also revealed there are previews of integration between Splunk Log Observer and Splunk Enterprise and Splunk Infrastructure Monitoring AutoDetect, a tool that automatically discovers infrastructure anomalies. There are also now additional Content Packs for managing Microsoft365, third-party APM tools and synthetic monitoring.

    Finally, Splunk has expanded its security portfolio to include Splunk SOAR App Editor, which provides a way to edit, test and create security orchestration, automation and remediation (SOAR) applications. There are now more than 350 SOAR apps now available on Splunkbase. The company also launched Splunk Intelligence Management based on a platform it gained with the acquisition of TruSTAR earlier this year and that it is making available security services via a team of experts dubbed SURGe.

    It’s not clear to what degree these additions will enable Splunk to fend off what has become a larger number of rival providers of observability platforms. However, as one of the most widely used IT operations management platforms in the enterprise, it’s clear Splunk enjoys an incumbent leader status it is determined to maintain.

  • CNCF Adopts Meshery to Advance Service Mesh Management

    CNCF Adopts Meshery to Advance Service Mesh Management

    The Cloud Native Computing Foundation (CNCF) announced this week during the ServiceMeshCon/KubeCon + CloudNativeCon conference that Meshery, a service mesh management plane created by Layer5, has become a sandbox-level project.

    In addition, Layer5 has also donated Service Mesh Performance (SMP), a set of tools for measuring the efficiency of a service mesh, to the CNCF. SMP provides an open source framework to define standardized benchmarking practices, performance test configurations and measurements as part of an effort to create a MeshMark index for rating a service mesh. A set of service mesh performance methodologies will also be published by the IEEE later this month, developed in collaboration with engineers from Layer5, Intel, Red Hat and HashiCorp.

    Layer5 CEO Lee Calcote said the goal is to make it simpler for IT teams to determine which service mesh to employ based on their specific use case requirements.

    Several service mesh platforms are starting to gain traction as a means to both manage application programming interfaces (APIs) and provide a layer of abstraction between lower-level networking and security APIs that makes those services more programmatically accessible to developers.

    Meshery itself is an implementation of SMP and the conformance tool created for the Service Mesh Interface (SMI), a separate CNCF project to promote interoperability between service meshes. Meshery is based on a set of microservices that are designed to make the platform easily extensible.

    That approach makes it possible to manage multiple instances of service meshes that might be deployed on virtual machines as well as Kubernetes clusters using a range of management tools that are part of the Meshery project.

    Meshery supports AWS App Mesh, Citrix Service Mesh, HashiCorp Consul, Istio, Kuma, Linkerd, Network Service Mesh, NGINX Service Mesh, Open Service Mesh and Traefik Mesh. Meshery also provides IT teams with more than 60+ best practices in the form of templates that can be used to deploy a service mesh.

    It’s still early days as far as adoption of service mesh in the enterprise is concerned. Most IT teams still rely on either proxy software or a gateway to manage APIs. However, as the number of APIs that need to be managed steadily increases, it won’t be long before many IT teams start to at least evaluate a service mesh.

    In the longer term, the impact those service meshes are likely to have on the management of IT could be profound. It is becoming apparent that a service mesh also provides a higher level of abstraction for invoking networking and security services. In fact, the service mesh may wind up playing a key role in driving the convergence of network and security operations with DevOps best practices.

    In the meantime, IT teams will need to decide to what degree they may want to standardize on a single service mesh versus letting individual teams implement their own preferred platform that could one day be centrally managed via Mashery. One way or another, the way APIs are managed and invoked will soon fundamentally change forever.

  • New Relic I/O Aims to Simplify Instrumentation

    New Relic I/O Aims to Simplify Instrumentation

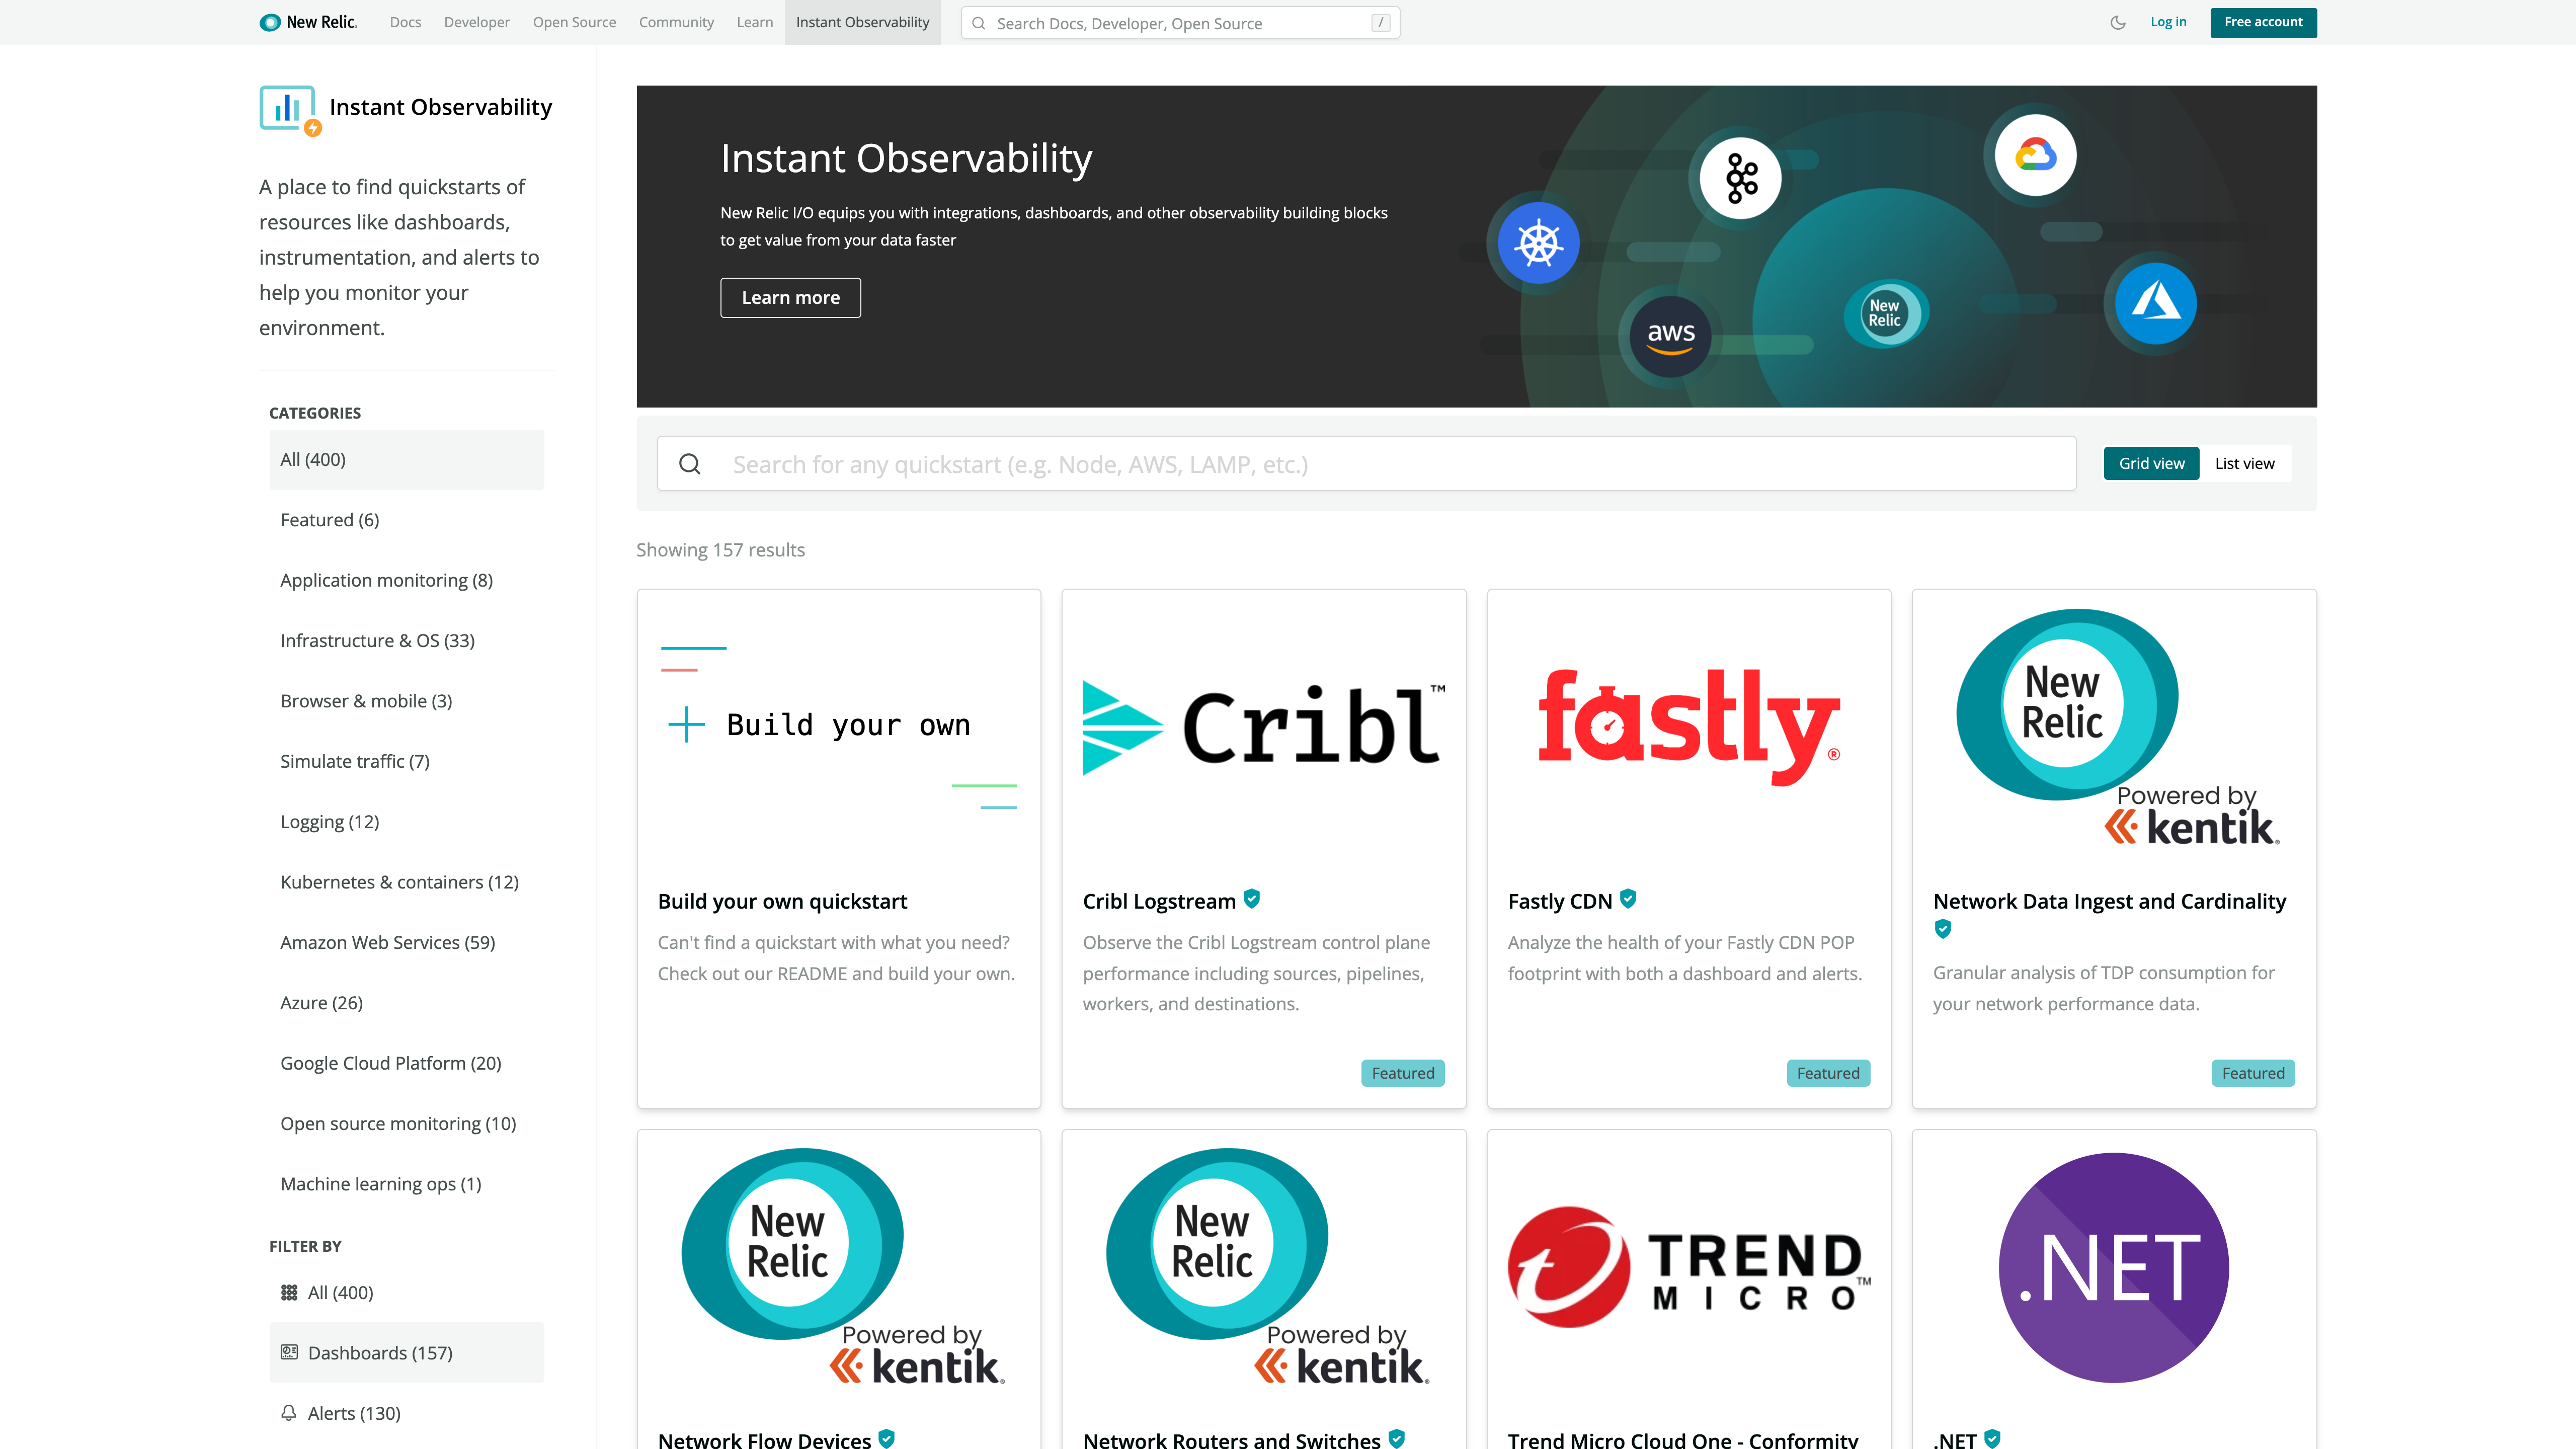
    New Relic today at the KubeCon + CloudNativeCon North America conference launched a New Relic Instant Observability (I/O) initiative through which it is making available open source tools to simplify application instrumentation.

    Marck Robinson, senior vice president for engineering at New Relic, said the catalog of tools will help DevOps teams instrument a much wider range of applications. New Relic will make those tools available as part of the free tier of its observability platform delivered via the cloud. DevOps teams will be able to use more than 400 pre-configured quickstarts to both instrument applications and create dashboards, Robinson said.

    New Relic itself is contributing quickstarts for cloud services, open source tools and platforms such as Kubernetes, Istio and Cassandra. Third-party vendors that have already contributed to the catalog include Cribl, Fastly, Gigamon, Kentik, Lacework and Trend Micro. Each contribution is being vetted by New Relic as part of an effort to foster the development of a larger open source observability ecosystem, noted Robinson.

    Robinson said overall, New Relic is trying to make it easier for DevOps teams to close an instrumentation gap that is impeding IT organizations from moving beyond monitoring to embrace true observability of their IT environments. The recent New Relic 2021 Observability Forecast report notes only a quarter of respondents (26%) have a mature observability practice, with the most commonly cited barriers to observability being a lack of resources (38%) and skills gaps (29%).

    As a result, DevOps teams often encounter a last-mile observability challenge when it comes to both instrumenting applications and then building their dashboards, said Robinson.

    As part of a larger effort to make it easier to instrument applications, New Relic has open sourced agent software, standardized on the OpenTelemetry tools being advanced under the auspices of the Cloud Native Computing Foundation (CNCF) and contributed the Pixie observability platform for Kubernetes environments to the CNCF.

    Observability in one some or another has always been a core tenet of any DevOps best practice. Initially, DevOps teams focused on continuous monitoring as the most effective way to proactively manage application environments. However, it can still take days, sometimes weeks, to discover the root cause of an issue. However, observability platforms are emerging that correlate events in a way that makes it easier for analytics tools to identify anomalous behavior indicative of a root cause of an IT issue. Armed with these insights, it becomes a lot simpler for IT teams to resolve issues faster.

    In contrast, monitoring focuses on predefined metrics to identify when a specific platform or application is performing within expectations. The metrics tracked generally focus on, for example, resource utilization. Observability, on the other hand, combines metrics, logs and traces—a specialized form of logging—to instrument applications in a way that makes it simpler to troubleshot issues without having to rely solely on a limited set of metrics that have been pre-defined to monitor a specific process.

    With the rise of microservices-based applications, the shift to the cloud and more end users than ever working remotely, the need for observability has never been more critical. The issue now is finding a way to make it much simpler to achieve.

  • Mastering API Gateways for the Modern Cloud-Native Enterprise

    Mastering API Gateways for the Modern Cloud-Native Enterprise

    As modern enterprises continue migrating to the cloud and the need for connected applications and devices dramatically increases, API-driven architectures are being widely adopted. In addition to the convenience of being able to efficiently connect and share resources, organizations benefit from the innovation and accelerated development speed that APIs bring in multi-cloud environments. APIs are not new, but as more enterprises adopt modern application architectures, they are increasingly occupying a large amount of a software development team’s delivery efforts. 

    When enterprises modernize and migrate to the cloud, it’s natural that challenges arise which need to be tackled before they become pain points—especially when it involves a complex microservices environment. API gateways are an essential ingredient that helps businesses overcome many of the challenges associated with APIs. API gateways are deployed at the edge of an infrastructure, responsible for routing client API requests to backend microservices. Modern API gateways also come with additional perks organizations can benefit from as teams and infrastructure grow simultaneously. 

    Let’s take an in-depth look at some of the major challenges organizations face around APIs, and how to maximize their benefits.

    Rapid Adoption Meets Growing Pains

    API-oriented architectures greatly accelerate the agility of an IT department, as they’ve become a well-known pattern for modern application architectures. However, this approach can be deceptive, as many critical issues and concerns around APIs aren’t always apparent from the onset. If they are not properly identified, they become growing pains teams have to face on a daily basis.

    The first challenge is the need to authenticate users when they make requests. API gateways allow organizations to integrate and consolidate authentication providers using their protocol(s) of choice. With billing and analytics, organizations need to understand the number of resources consumed when processing a transaction and how their customers consume their APIs. API gateways become the natural point at which to collect this data. 

    In terms of DevOps initiatives, some API gateways use service discovery to configure themselves dynamically which greatly accelerates a development and ops team’s velocity when shipping new features or fixes. To help teams deliver a highly available and resilient platform, API gateways are enablers that provide them with the puzzle pieces for advanced load balancing, rate-limiting, circuit-breakers, mirroring and more. These components make the DevOps mindset a reality. Teams can scale them as needed to realize production-grade environments, continuously updating deployments with software changes and avoiding any unintentional single points of failure (SPOFs). 

    In recent years, the evolution of API gateways has solved growing pains in the cloud, helping organizations leverage cloud-native technologies and workflows. Combining cloud-native technologies with an API-led integration platform creates an effective architecture for a digital enterprise to increase productivity. Automating production, operation and services is no longer a goal but a must-have.

    Modern API gateways features within this environment go well beyond what one would expect at first glance. API gateways can be the cornerstone of a deployment strategy transformation. With hundreds—if not thousands—of services to continuously deploy, the risk of introducing a regression to the platform soars, and being able to address this problem immediately is not enough. API gateways can help you transition to modern deployment strategies and blue/green or canary deployment becomes commonplace—helping deployments become an easily managed daily task.  

    API Gateways to the Rescue for Cloud-Native Architectures

    As part of the shift to modern application architectures, enterprises should invest resources in implementing API strategies as part of their software development initiatives. In turn, they should leverage API gateways to alleviate growing pains and simplify delivery efforts. APIs should be secured, managed, observed and even monetized. 

    API gateways can also help with critical issues related to authentication, security and SSL, billing and analytics, life cycle management, high availability and resilience, and they can even help you initiate a culture shift toward a DevOps mindset. By combining API-driven architectures and cloud-native technologies, organizations emerge with an effective architecture for the digital era. API gateways help overcome the challenges and unfold the networking intricacies of today’s cloud-centered world.

  • LF Networking (LFN) Adds to Open Source Portfolio

    LF Networking (LFN) Adds to Open Source Portfolio

    At the online Open Networking & Edge Summit + Kubernetes on Edge Day event LF Networking (LFN), an arm of the Linux Foundation focused on networking, today added several projects that promise to make it simpler to programmatically manage networking services based on open source software.

    Walmart is contributing a L3AF project for managing network applications that make use of an extended Berkeley Packet Filter (eBPF) capability that allows applications to run in a sandbox at the microkernel level of an operating system. Intel and Aarna Networks, meanwhile, are donating the seed code from an EMCO project that provides a universal control plane to securely connect and deploy workloads across distributed computing environments that span everything from the edge to the cloud.

    Arpit Joshipura, general manager for networking, edge and internet of things (IoT) for the Linux Foundation, said the L3AF project adds a control plane for managing those applications to the LFN portfolio that addresses load balancing, rate limiting, traffic mirroring, flow exporter, packet manipulation, performance tuning and other management tasks. Earlier this year, the Linux Foundation set up a separate eBPF Foundation to further advance development and adoption of eBPF across multiple operating systems.

    At the same time, LFN also revealed today that Project Alvarium, a tool for measuring how well data is being delivered to devices that was originally created by Dell, and eKuiper, an existing open source lightweight IoT data analytics and streaming platform, are now part of the LF EDGE portfolio of projects.

    Finally, an open source mobile edge computing project, dubbed Edge Gallery, that was originally created by Huawei has been contributed to the Linux Foundation.

    Joshipura said the LFN continues to gain momentum as more vendors contribute core technologies that, ultimately, don’t provide them with enough differentiated value to continue to develop on their own. The LFN today also revealed that VMware and F5 Networks have joined the LF EDGE consortium as premier members, while mimik and Veena, Inc. have become general members of LFN and the Eclipse Foundation has become an associate member.

    The LFN also provides a mechanism that promotes adoption of those technologies more widely than any one vendor can achieve on its own. The total cost of delivering next-generation edge computing platforms based on wireless 5G networks will also be sharply reduced as LFN projects continue to mature, said Joshipura.

    In general, the rate at which various LFN projects are updated continues to accelerate, said Joshipura. The Akraino project for creating blueprints for edge computing platforms recently delivered its fifth update to address use cases involving smart cities, cloud-native multi-tenant environments and vehicular networks. An EdgeX Foundry project for IoT platforms, meanwhile, recently revamped its application programming interfaces (APIs) to make them more secure and enable more message-based communications. The Home Edge project will also soon issue a Drewberries update that will address code stabilization, scripting, APIs, data synchronization and security.

    It’s now only a matter of time before these LFN projects become more integrated with DevOps workflows as IT teams seek to give developers more programmatic control over network services. The issue now is deciding not so much whether to integrate network operations and DevOps teams but rather determining to what degree those teams will need to fold into each other.