Category: DevOps Toolbox

  • PagerDuty goes beyond alerting to advanced analytics of incident resolution

    PagerDuty goes beyond alerting to advanced analytics of incident resolution

    PagerDuty has made a major move from simply alerting team members to potential issues via pager or web to actually becoming an advanced analytics platform to measure team and system performance regarding incident response. They announced their new functionality today (release below). This is really a big step up for PagerDuty which also recently announced closing on another round of venture caiptial.

    I spoke with Alex Solomon, CEO and Co-founder, David Shackelford, Product Manager and Nisha Ahluwalia, VP of Marketing recently about these new features. I had spoken with Alex some time back. He moved from Canada to Silicon Valley to found Pager Duty at the successful Y-combinator accelerator.  Since then they have made steady progress on executing on their plan.  However, this represents really a whole new market for PagerDuty. Proving insight into both team performance as well as system performance in regard to incident response is a big opportunity and Solomon, Shackelford and Ahluwalia are confident that PagerDuty is ready to capitalize on it.

    I am personally very excited by this new functionality. A mantra of business that I learned from my friend and serial entrepreneur, Rajat Bhargava is that you need that you need to measure everything and everything can be measured. This gives organizations the ability to measure incident response across teams and systems.

    Here is a sample of the system report:

    pager system report


    While there are vendors who do system analysis reporting, the combination of this with team analytics data should prove very powerful.

    PagerDuty’s Advanced Analytics Delivers Comprehensive View of Incident Resolution Across the Organization

    New Resolution-Time Metrics and Drill-Down Capabilities Enable Companies to Make Proactive Improvements to Increase System Reliability

    San Francisco – September 16, 2014 —PagerDuty, the leader in operations performance managementtoday announced the public release of its Advanced Analytics tools, which provide insights IT teams can use to improve team and system performance. Leveraging PagerDuty’s robust data on key operational metrics like incident frequency and time to respond and resolve, companies can now drive even faster incident resolution. The new capabilities further expand PagerDuty’s operations performance platform by giving managers the ability to analyze and improve key drivers of uptime.

    “Throughout the lifecycle of an incident, responders make real-time decisions, but little of that institutional knowledge is saved to make systematic improvements. Advanced Analytics gives responders and managers the tools they need to identify, analyze and share trends about their resolution times and incident load,” said PagerDuty Product Manager David Shackelford. “We’re excited to help our customers make smarter, data-backed decisions about their operations.”

    PagerDuty brings together data from all monitoring systems into a unified view, giving teams a single place to compare data about incidents with people and process metrics. With Advanced Analytics, managers gain better insight into how teams are responding to and resolving incidents, and determine whether teams are spending time on the right problems or spinning their wheels on unnecessary alerts. The reports provide a holistic view of team and system performance, enabling everyone from individual operations engineers to CTOs and CIOs to have richer discussions about these metrics.

    “PagerDuty’s Advanced Reporting saves us time since we’ve been calculating this data ourselves,” said Matthew Green, Senior Engineer at Rackspace. “We’re using the new reports to better understand the incidents we see in our environment on a daily basis. Also, seeing the resolution time data for our distributed teams will help us improve our response time.”

    Advanced Reporting is immediately available as part of PagerDuty’s enterprise plan.

    About PagerDuty

    PagerDuty’s operations performance platform helps companies increase reliability. By connecting people, systems and data in a single view, PagerDuty delivers visibility and actionable intelligence across global operations for effective incident resolution management. PagerDuty has over 80 platform partners, and is trusted by Fortune 500 companies and startups alike, including Microsoft, National Instruments, Electronic Arts, Adobe, Rackspace, Etsy, Square and Github. The company is headquartered in San Francisco and backed by leading venture capital firms Andreessen Horowitz, Bessemer Venture Partners, Baseline Ventures, Ignition Partners and others. Try PagerDuty for free, or to get more information, visit www.pagerduty.com

  • A How to Guide on Modern Monitoring and Alerting

    A How to Guide on Modern Monitoring and Alerting

    syslog-ng, riemann, collectd-notifications, elasticsearch: putting it all together

    Context

    At our organization (CCIN2P3) we are building an event-based infrastructure to push structured messages to different subsystems for alerting, reporting and storage. Using syslog-ng, each message is normalized into a structured event, optionally correlated with other messages, and conditionally routed to the next systems, including:

    • a synchronous web-dashboard,
    • different asynchronous alerting systems, and
    • a searchable storage backend.

    The events which are collected are essentially system and application logs. Here’s a few examples of interesting messages:

    puppet-agent[16528]: Finished catalog run in 44.06 seconds
    kernel: Killed process 29959, UID 42046, (hadd) total-vm:202363492kB, anon-rss:13069860kB, file-rss:60kB
    ata2.00: exception Emask 0x0 SAct 0xffff SErr 0x0 action 0x0
    EXT3-fs error (device dm-1): ext3_journal_start_sb: Detected aborted journal
    

    The unified nature of this pipeline makes it possible for a human to easily identify an event in all the available back- and frontends.

    In this post you’ll learn a way to implement this model, and achieve the following:

    • Collect system metrics
    • Monitor events for outliers
    • Normalize and Correlate these events
    • Route the events to a real-time stream processor and to a searchable storage backend

    We’ll describe the configuration files you’ll have to change, and explain the workflow that processes an event. For the impatient, we’ll illustrate the final result in a short recorded demo.

    Demo

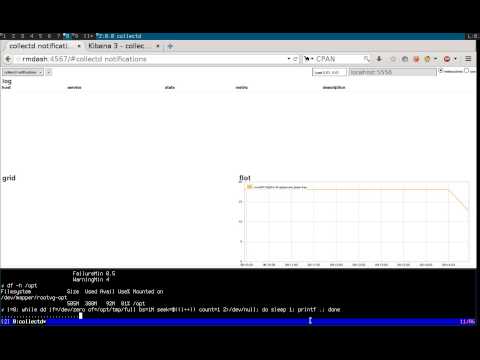
    Realtime monitoring using riemann, syslog-ng, collectd and elasticsearch

    Requirements

    We will assume you have basic knowledge of the following tools, as well as a running instance of each:

    The tools

    Here’s a list of all the tools we’ll be using, along with a short summary, and their main functions in the pipeline:

    On the client:

    • collectd: “a daemon that receives system statistics and makes them available in a number of ways”
      • periodically poll system metrics
      • trigger notifications based on predefined thresholds
    • (any)syslog: “system error logging protocol”
      • listen for syslog messages, including collectd notifications
      • forward them to a remote destination

    On the server(s):

    • syslog-ng: “a flexible and highly scalable system logging application”
      • listen for remote notification messages
      • patterndb: create structured events by parsing the flat collectd notification messages
      • route the events to the next stages (riemann, Elasticsearch, Nagios, Email, …)
    • riemann: “aggregates events from your servers and applications with a powerful stream processing language”
      • listen for remote structured messages (protocol-buffers)
      • expose a websocket and/or sse service for subscriptions
      • send asynchronous alerts to the next stages (e.g. Nagios or Email)
    • riemann-dash: “a javascript, websockets-powered dashboard for Riemann”
      • synchronous realtime in-browser display
      • web application to subscribe to collectd streams using websockets or sse
    • elasticsearch: “a flexible and powerful open source, distributed, real-time search and analytics engine”
      • store and index all events
      • expose an API for query e.g. by Kibana
      • “You know, for search!“
    • kibana: “Elasticsearch’s data visualization engine for the browser”
      • browser-based search interface to query elasticsearch

    Architecture

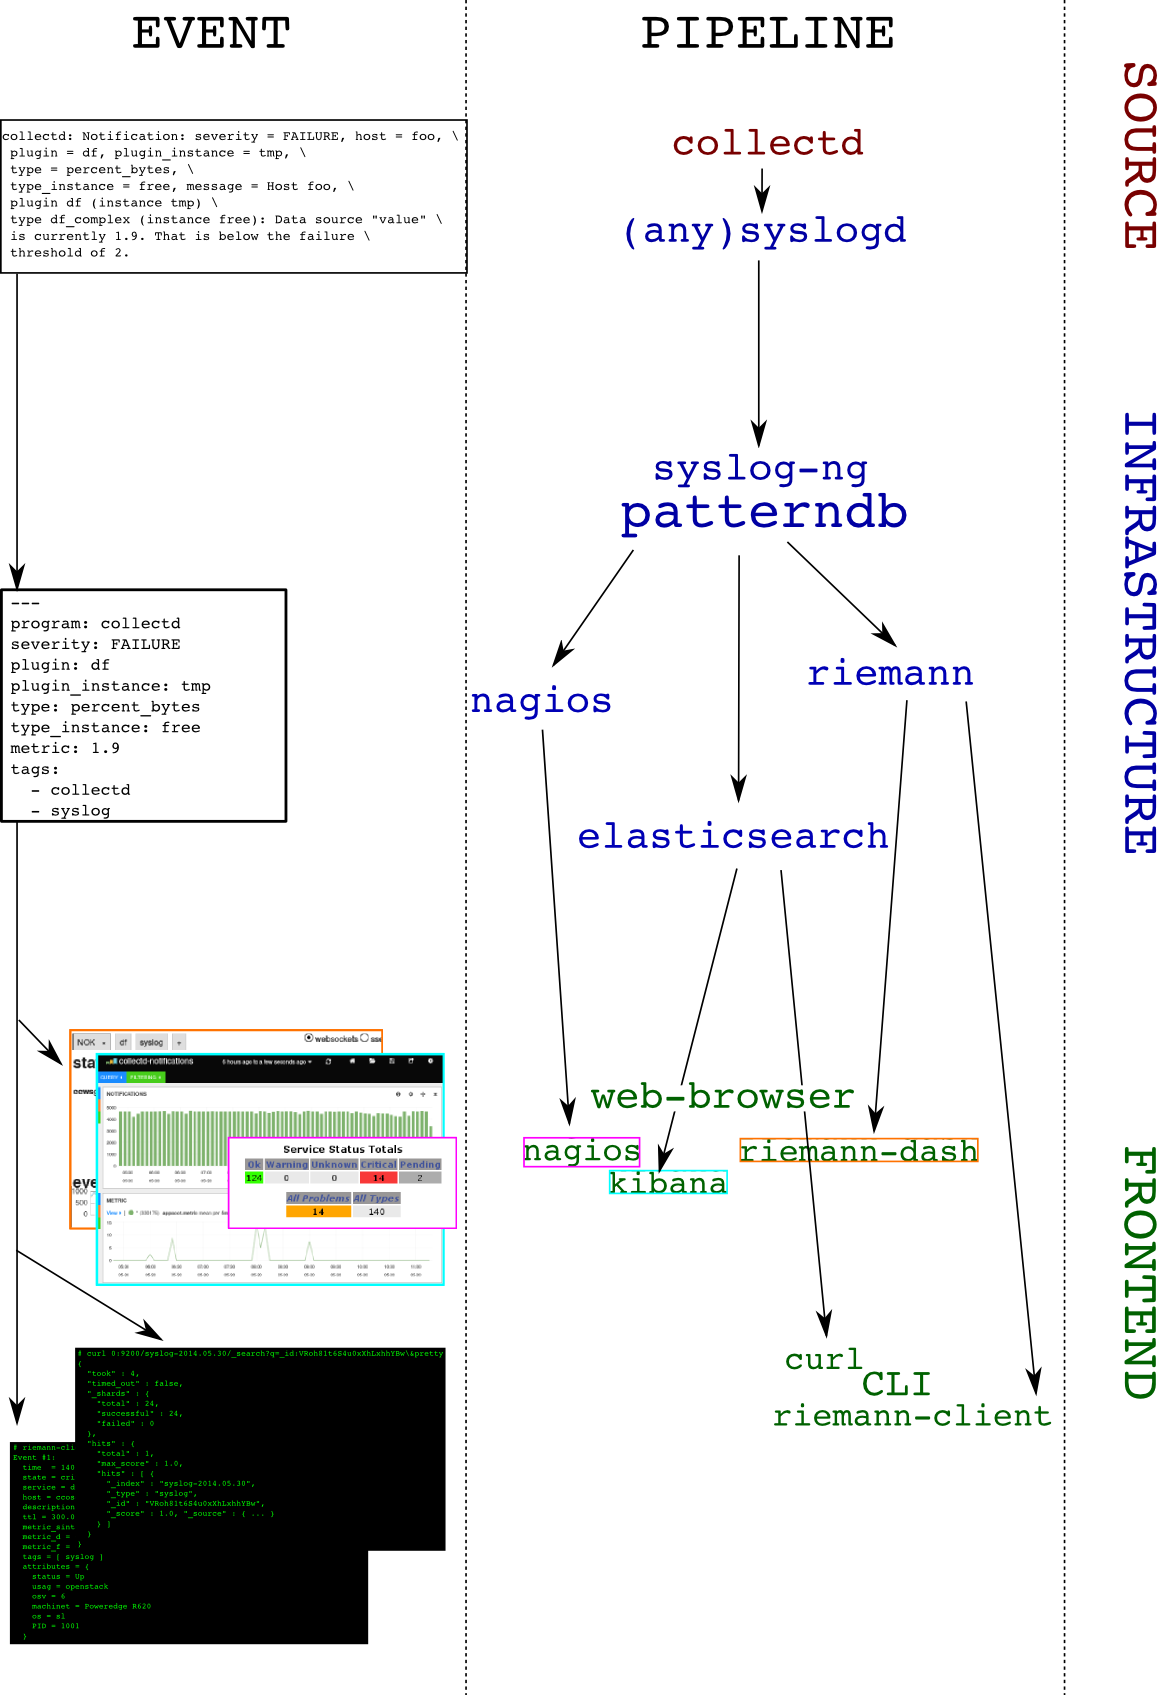
    To make things crystal-clear, we’ll choose an example: let’s track filesystem’s usage. The collectd-df plugin collects this information. Here’s a diagram depicting the dataflow: you can follow how an event is evolving from a user perspective on the left column, as it travels the pipeline (right column):

    architecture

    And the details:

    1. collectd-df plugin polls the filesystem utilization:
      df-tmp/percent_bytes-free is 1.9
    2. collectd-threshold plugin issues a notification as the failure threshold is reached: Notification: severity = FAILURE, host = foo, plugin = df, plugin_instance = tmp, type = df_complex, type_instance = free, message = Host foo, plugin df (instance tmp) type df_complex (instance free): Data source "value" is currently 1.9. That is below the failure threshold of 2.0
    3. collectd-network plugin receives this notification and sends it over to the local syslog server
    4. the local syslog server forwards the flat message to a remote destination
    5. the remote syslog-ng server receives the message and parses it using patterndb
    6. the patterndb extracts relevant values and creates a hash table (name-value pairs):
    • program: collectd
    • host: foo
    • tags: syslog, collectd
    • collectd.plugin: df
    • collectd.plugin_instance: tmp
    • collectd.type: percent_bytes
    • collectd.type_instance: free
    • collectd.thresh_type: the thresh type (above/below)
    • collectd.thresh_value: the failure thresh: 2
    • collectd.metric: the value of the current reading: 1.9

    This structured event is then routed to syslog-ng destinations, in our case riemann and elasticsearch. Both of these applications can then be used to query the event in a comprehensive manner, for example, “show me all collectd notifications concerning the plugin df and the instance tmp“

    Configuration

    Due to formatting issues, and for detailed examples on configuring the components of this solution, see the folowing link.

    Conclusion

    In this article we showed how to send collectd threshold notification messages to a central syslog-ng server, and how to extract numeric metric information from it. We also showed how to route the result to two backends, one of which can be used to view the data in real-time (riemann), and the other to query historical data (elasticsearch). This system could be extended in multiple ways, for instance:

    • by compiling a large patterndb to match multiple subsystem messages
    • by tagging important messages, and routing them to relevant destinations. For instance: “send all hardware errors to nagios“
    • by using the correlation context information to generate alerts, excluding self-healing components: “send an email if a filesystem is full and doesn’t come back to normal in less than 5 minutes”
    • by using the correlation context information to generate alerts upon reaching a threshold on the number of messages: “run this command if the same scsi device is referenced in more than 100 messages every minute”
    • send metric data to graphite

    Configuration files

    tarball

    Here‘s a transcript from a shell session working on these configuration files.

    Link to full article including configuration on github

  • Testing in the Agile Age

    Testing in the Agile Age

    The Agile Age
    For a business to survive or, dare I say, thrive in the “Agile Age”, it must adopt agile methodologies. The term agile may ring some bells with those of you from the product lifecycle field. But when I say agile, I’m not referring to product lifecycle terms like Scrum or Kanban. I’m talking about agility throughout the organization, starting from the CEO, through marketing, sales, R&D and, of course, to IT operations.

    To compete in today’s environment, you must act and react fast! If you don’t, your competition will beat you to it. Today, the barriers to compete are minimal and the only way to defend one’s stature is by innovating in short iterations.

    Agility facilitates survival in a highly competitive business environment. And it dictates a different DNA. One that can move fast, innovate and work in ridiculously short iterations.

    This new DNA demands an IT infrastructure that supports agility. What was so right in the waterfall-age is sometimes so wrong in the agile-age. While the right IT infrastructure can enhance agility, the wrong infrastructure will add friction and cause failures.

    Five years ago, the vast majority of IT infrastructures were dominated by giants like HP, IBM, Compuware, BMC, etc. Today, you’re more likely to see agile, streamlined companies making waves thanks to their ease of use and excellent ROI for their customers. Companies like Heroku, New Relic and BlazeMeter are fast becoming the new household names in the technology of today and tomorrow.

    Waterfall Vs. Agile Approaches

    A product lifecycle is built out of iterations. As adopting agile methodologies mean you have dozens or hundreds of extremely short iterations every year, the waterfall development cycle is no longer adequate. A typical iteration starts with product marketing specifications, then goes through design, development, QA and finally deployment. During the Waterfall age, this process would take many months to complete. However, in the Agile age, a typicaliteration can take anything from a few days for a minor release to a few weeks for a major release.

    Testing in the Agile Age

    An organization that relies on web or mobile applications to deliver services, benefits and features needs to introduce agility into its product development lifecycle. In order to achieve agility, we need to build applications differently than we did in the past. Bugs, bad user experience and downtime come with a far greater cost than they used to.

    The Agile Age is all About the Continuous Delivery Process

    By moving from Waterfall to Agile, the entire testing process has changed significantly. There can no longer be manual handoffs between development and QA in order to perform testing. There is simply no time as iterations are so short. Testing needs to be automated and performed as part of the cycle and not as the next phase. Today, testing is part of the continuous integration and deployment processes.

    What is Being Tested and by Whom?

    Today, testing is conducted by the entire technical team in all phases of the development lifecycle. Testing starts at the development stage by the developers, continues through the continuous delivery process all the way to post production monitoring of the application’s service level. While testing is performed throughout the product lifecycle, it is carried out by different teams with various skill sets: Dev, DevOps, Performance Engineering, QA, Ops and others. Some of these teams have a comprehensive understanding in the field of performance testing and some have close to zero understanding and little patience to learn. As these teams can no longer do handoffs to the QA team, they must carry out testing on their own. They need to leverage their skill sets and utilize tools that will enable them to perform these tests.

    A Fantastic Story: The Life of the Agile-Age Test Script

    The Agile-Age test script can be used by developers manually for troubleshooting, unit-testing and module-testing. Very quickly, the test is automated and run as part of the continuous integration cycle after each daily build. Prior to production, the test script can be used to run a load test. Once the release is ready for deployment, the test script is attached to the continuous deployment process as part of a Chef or a Puppet recipe to be performed as part of an automated deployment. The same test can also be used to monitor the application service 24/7 post production.

    Open Source Vs. Commercial

    If, in the past, the testing market was dominated by commercial tools such as Loadrunner and QTP, today it is obvious that the use of open source tools for testing such as Apache JMeter and Selenium is becoming increasingly common. Working with a commercial tool binds you to a certain company – making you dependent on its support team and feature roadmap. Open source tools today are far more up-to-date than many of the commercial tools and they give you freedom. With open source tools, you can find one that you like, download it, view a couple of YouTube videos and get going without speaking to anyone. In the past, no CEO would ever be fired for choosing IBM, today it’s the same for choosing open source. Not only do open source tools tend to be more up-to-date than commercial tools, they are also easily integrated with other open source tools and users can share their experiences. Most importantly, they can be altered and customized per use case.


    Conclusions

    For the past four years, we’ve been witnessing an IT revolution. Organizations have a new DNA – which some have started calling ‘DevOps’. This new DNA cannot survive without an IT infrastructure that supports agility. The right IT infrastructure can enhance the agility that DevOps requires, whereas the wrong infrastructure will create friction and ultimately cause failures. Testing has become an integral part of the development lifecycle. It needs to isolate bugs and bottlenecks – but it absolutely cannot stop or slow the release cycle.

    Cloud computing and open source tools have become a great facilitator for agility. They replace many of the old techniques, saving a significant amount of time while enabling users to achieve more with less. Apache JMeter, Selenium and AWS allow the Agile-Age professional to do ten times more with ten times less. In this agile age, an investment in testing might just be the smartest investment an organization can make.

  • Me and My Kanban

    Me and My Kanban

    There has been a growing interest in the Kanban board, a tool that helps teams visualize their workflows, limit work in progress and get more “done”.   Kanban Boards are mostly associated with Agile Scrum teams as a collaborative means of seeing the burndown of a sprint.   In fact, Scrum and Kanban are considered to be so interdependent that a new framework called Scrumban is starting to emerge.   However, Kanban is not limited to Agile.  A Kanban board can be very useful for any project or scope of work that would benefit from visualization.

    The premise behind the Kanban is almost deceptively simple.  A board is built with three columns:  “To Do”, “In Progress” and “Done”.   At the start of each sprint, all of the work that needs to be completed is captured on individual sticky notes and placed in the “To Do” column.  When the task or work is actually being undertaken, the note moves into the “In Progress” column.  Upon completion, it is moved to the “Done” column.   If the team has successfully completed the work that was planned for a sprint, all of the cards that began in the “To Do” column will end in the “Done” column.  Any other result opens the opportunity for questions about impediments, team velocity (the ability to absorb work) and sprint planning.

    You will often see team kanban boards built on whiteboards and peppered with multi-colored sticky notes.  There is also a great online tool (www.leankit.com) that offers a virtual team Kanban board with many of the same characteristics.  If the three columns are too basic, you are able to add more columns because of the nature of the project.   My only caution is that it is easy to inadvertently make deceptively simple into overly complex.

    I have recently started to use a personal Kanban board to manage my own workload.  While not perfect, I have seen a significant improvement in my ability to get things done.   It keeps me organized and focused.   I like moving the sticky notes around.

    To begin, I created a backlog column with a colored note for each of my outstanding tasks.  The list is never-ending so notes are added to the backlog just about every day.  At the start of each week, I re-prioritize the backlog to ensure that deadlines and other considerations are addressed.  I then take a reasonable chunk of tasks off the top and add each note to the “To Do” column.  These are my goals for the week.  When I start to work on a particular task, I move its note into the “In Progress” column.  Upon completion, the note is moved to “Done”.   At the end of the week, I celebrate what I have accomplished and analyze what was left behind.

    If a note stays in the “In Progress” column for too long or moves back to “To Do”, I have to question why.  Did I overestimate my velocity or time it would take to complete a task?  Have I been faced with extensive interruptions or unplanned work?  Was I waiting on someone else?   The visualization of the Kanban board helps me understand my own patterns of work and recognize how I contribute to or impact the results of my team.

    I highly recommend that everyone set up a personal Kanban, whether for work or personal tasks.  It is a good opportunity to practice while enjoying the pleasure of getting more stuff done.    You can use the whiteboard in your office or set up a free basic online board (like me) through LeanKit  (www.leankit.com).   I assure you – the results will be very interesting.

  • Panamax, Docker management for humans

    Panamax, Docker management for humans

    Panamax, a new open source tool from CenturyLink brings the promise of building complex Docker based environments like a child using Legos. The tool is a management interface for managing and building multiple Docker environments. You can search the official Docker repository as well as a number of others to find best of breed, Docker pre-built containers. Panamax is available on GitHub and is released under an Apache 2.0 license.

    I spoke to Lucas Carlson, chief innovation officer at CenturyLink yesterday about Panamax. Lucas also heads up the CenturyLink Labs and this is one of the first projects that they have developed and released. Lucas gave me a demo of Panamax. In just a few moments we had searched for and found several WordPress containers. We chose one from the official Docker repository and quickly installed it. After that it was simple to choose other services such as Ruby and add them to our instance as well. In no time we had added several different Docker containers and had build a pretty sophisticated environment. Below are some screen shots of Panamax in action.

    panamax 1

    panamax 2

    Lucas explained to me that he thinks of Panamax as “Docker management for humans.”  It makes building multi-docker environments really easy. From the Panamax press release:

    Prior to Panamax, running multi-container, multi-server apps with Docker was difficult. Developers needed to learn as many as five new technologies – libswarm, systemd, etcd, ambassador and fleet – as well as Docker-specific best practices just to get started. Panamax packages these technologies and best practices into an intuitive user experience that automates the heavy lifting of deploying complex applications. Developers simply drag-and-drop containers and can easily access the open-source cloud application marketplace. Panamax can run on laptops, virtual machines, bare metal or any public cloud that supports CoreOS like CenturyLink Cloud. 

    Right now as the previous paragraph points out, Panamax only supports CoreOS. Of course this gives it the availability to run on Amazon and a number of other cloud providers in addition to CenturyLink’s own cloud service. However, it is only a matter of time I would think until Panamax is ported to other cloud Linux OS distributions.

    Docker is already one of the fastest growing open source projects of all time.  Third party applications such as Panamax validate that there is an entire ecosystem that is beginning to emerge and thrive around Docker containers. I was pitched by several PR agencies this past week about new companies launching or coming out with products around Docker.

    Many of these companies believe that Docker is going to closely follow the path of VMware as it becomes the virtualization solution of choice.  What Docker will offer versus what others will offer is still being thrashed out. It was similar with VMware as well. What security would VMware provide and what 3rd party security was available? This was a burning question for a while. Similar questions will be asked around Docker and everyone jockeys for position around table here.

    CenturyLink of course feels that Panamax will give them a leg with Docker developers choosing the CenturyLink cloud over Amazon and others.

    So Docker continues its red hot ascent through the tech world. Panamax coudl become a star in the Docker world allowing everyone to make complex Docker environments as easy as building Legos. As Lucas said, it is Docker management for humans.

  • DevOps with purpose: It’s about your applications

    DevOps with purpose: It’s about your applications

    This is Part 1 of a series on DevOps with a purpose by Matthew Selheimer, Chief Technical Evangelist and SVP of Marketing at Houston-based ITinvolve.

    Unless you’ve been living under the proverbial rock these days you have no doubt heard about DevOps and the groundswell building around it. Today DevOps is being defined, promoted, touted and discussed as the next game changer in IT. Rather than argue about the best way to define DevOps in a general sense, this article will focus on something hopefully more useful – how do you determine what DevOps means for your organization?

    A common goal cited for DevOps is to enable faster release and deployment cycles by taking advantage of agile development methodologies; improved collaboration between business stakeholders, application development and operations teams; and automation tools. Beyond these elements, DevOps also requires a cultural acceptance of the need to focus on the flow of work across teams vs. simply optimizing individual teams and their specific units of work.

    By contrast, defining DevOps with a purpose means ensuring how you do DevOps is grounded in the realities of your specific organization. There is no “one-size-fits-all” DevOps, no matter what pundits, consultants, and vendors might tell you. Start by actually taking a step back. Ensure you are clearly taking into account your industry, your applications, your culture, and your people when developing your DevOps strategy; then apply DevOps principles against that foundation. Because every organization’s purpose will be different, your way of doing DevOps will not be the same as anyone else, even among your industry peers.

    There are, however, some general guidelines you can start with and then apply them to your specific situation. For example, I recommend analyzing your business goals and application portfolio using the pace-layering method, which focuses on three categories of applications – systems of record, systems of differentiation, and systems of innovation.

    Systems of record are usually quite stable with infrequent updates. This is often due to regulatory requirements and internal policies for theyse systems, and they tend to have a high degree of consistency within an industry and even across industries. Systems of record are often good candidates for waterfall development methodologies and longer release timelines. Your general ledger or payroll systems are good examples of systems of record.

    Systems of differentiation are those applications that are likely common to your industry but where you have an opportunity to differentiate your company from the competition based on functionality and the pace with which you update them. For example, if you are a financial services firm that provides retirement investment programs, you might make changes to your customer portal and how clients select new investment options on a quarterly or monthly basis in order to enhance customer experience and remain competitive and differentiate. If you are an airline, this might be your crew scheduling application, which ensures you have the right flight crews available when needed and can improve your on-time departure percentages to differentiate from the competition. In healthcare, your systems of differentiation might be the applications that health professionals use to store patient information and correlate test results to aid in diagnosis and treatment. In manufacturing it may be your supply chain management, process control, or shop floor applications.

    Systems of innovation are those truly groundbreaking applications that help you create new markets and revenue streams. In financial services, that might be a new kind of application that gives day traders a market advantage. For an airline that might be a whole new way of providing inflight entertainment, such as when Wifi and inflight entertainment first became available to passengers. In healthcare, it might be a new customer portal that promotes wellness services and reduces office co-pays by uploading fitness tracker data. For a retailer, it might be applications that support a new type of customer loyalty program, such as when Amazon introduced their Amazon Prime service a few years ago.

    Both systems of differentiation and systems of innovation are excellent candidates for agile development and DevOps principles. This is because they require high degrees of collaboration between business stakeholders, developers, and operations personnel to ensure the applications are in line with requirements, developed and tested quickly, and then made available in the market to drive differentiation and innovation. They are excellent candidates for the continuous delivery concept in DevOps where small releases are deployed quickly (and can be rolled back just as quickly if there are issues). In this manner, a large number of small deployments moves the competitive needle faster and provides greater value to customers over traditional waterfall development and disconnected development and operations practices.

    Defining DevOps with a purpose starts with an understanding of your industry and your applications. In the next article in this series, we’ll turn to the topic of organizational culture and its impact on DevOps transformation.

    About the Author

    matthew Matthew Selheimer is Chief Technical Evangelist and SVP of Marketing at Houston-based ITinvolve. Reach him at matthew@itinvolve.com

  • Bringing Collaboration, Orchestration and Lifecycle Management to Docker Containers

    Bringing Collaboration, Orchestration and Lifecycle Management to Docker Containers

    As you most likely know, Docker is a Linux container technology that stands to revolutionize or standardize the delivery mechanism of applications and services in the cloud.

    Docker, which just turned 1.0, has created an enormous amount of buzz, a vibrant community, and an extremely interesting ecosystem upon which developers and operations teams can draw to ultimately build better applications and better utilize cloud resources.

    We, at ElasticBox, wanted to see what we could do by combining these two great technologies. With developer and IT operations in mind, we’ve created the ability for you to consume Docker as a service with  collaboration, orchestration, and lifecycle management capabilities. You can now create Boxes and use Docker as a service, giving you and your team the ability to distribute Docker files as Boxes across your organization, collaborate on the continued development and maintenance of these assets, provide an orchestration tool for the deployment of application or infrastructure components, and finally, manage their lifecycle across different environments – development, test or production.

    Tutorial – Deploy the Ghost blogging platform in a Docker Container on any cloud using ElasticBox

    To demonstrate this integration, let’s launch an instance of Ghost, a simple but powerful publishing platform, in a Docker Container on the Cloud Provider of your choice. By the end, you will have built a Ghost / Docker Box in ElasticBox that can be deployed, versioned and shared. For step by step instructions, click through the Slideshare below.

    For more information on how to use Docker in ElasticBox, please visit our documentation.


  • The Continuous Delivery Pipeline — What it is and Why it’s so Important in Developing Software

    The Continuous Delivery Pipeline — What it is and Why it’s so Important in Developing Software

    Continuous Delivery (CD) is a software strategy that enables organizations to deliver new features to users as fast and efficiently as possible. The core idea of CD is to create a repeatable, reliable and incrementally improving process for taking software from concept to customer. The goal of Continuous Delivery is to enable a constant flow of changes into production via an automated software production line. The Continuous Delivery pipeline is what makes it all happen.

    The pipeline breaks down the software delivery process into stages. Each stage is aimed at verifying the quality of new features from a different angle to validate the new functionality and prevent errors from affecting your users. The pipeline should provide feedback to the team and visibility into the flow of changes to everyone involved in delivering the new feature/s.

    There is no such thing as The Standard Pipeline, but a typical CD pipeline will include the following stages: build automation and continuous integration; test automation; and deployment automation.

    • Build automation and Continuous Integration

    The pipeline starts by building the binaries to create the deliverables that will be passed to the subsequent stages. New features implemented by the developers are integrated into the central code base on a continuous basis, built and unit tested. This is the most direct feedback cycle that informs the development team about the health of their application code.

    • Test Automation

    Throughout this stage, the new version of an application is rigorously tested to ensure that it meets all desired system qualities. It is important that all relevant aspects — whether functionality, security, performance or compliance — are verified by the pipeline. The stage may involve different types of automated or (initially, at least) manual activities.

    • Deployment Automation

    A deployment is required every time the application is installed in an environment for testing, but the most critical moment for deployment automation is rollout time. Since the preceding stages have verified the overall quality of the system, this is a low-risk step. The deployment can be staged, with the new version being initially released to a subset of the production environment and monitored before being completely rolled out. The deployment is automated, allowing for the reliable delivery of new functionality to users within minutes, if needed.

    Your Pipeline Needs Platform Provisioning and Configuration Management

    The deployment pipeline is supported by platform provisioning and system configuration management, which allow teams to create, maintain and tear down complete environments automatically or at the push of a button.

    Automated platform provisioning ensures that your candidate applications are deployed to, and tests carried out against, correctly configured and reproducible environments. It also facilitates horizontal scalability and allows the business to try out new products in a sandbox environment at any time.

    Orchestrating it all: Release and Pipeline Orchestration

    The multiple stages in a deployment pipeline involve different groups of people collaborating and supervising the release of the new version of your application. Release and pipeline orchestration provides a top-level view of the entire pipeline, allowing you to define and control the stages and gain insight into the overall software delivery process.

    By carrying out value stream mappings on your releases, you can highlight any remaining inefficiencies and hot spots, and pinpoint opportunities to improve your pipeline.

    Don’t Add New Functionality Until You Get The Quality Right!

    Continuous Delivery is about enabling your organization to bring new features to production, one by one, quickly and reliably. That means that every individual feature needs to be tested prior to rollout, ensuring the feature meets the quality requirements of the overall system.

    In a traditional environment, development teams typically try to implement an entire new version in one go, addressing software quality properties (such as robustness, extensibility, maintainability) only when the project is close to completion. However, as deadlines loom and budget pressures grow, quality is often the first thing that is compromised.

    Poor system quality, low-user satisfaction and endless “quality band-aids” can be avoided by adopting the principle of not adding new functionality before getting the quality right. You should always first meet and maintain your quality levels and only then consider gradually adding functionality to the system.

    With CD, each new feature is required to meet the level of quality expected for the system as a whole, right from the start. Only once this quality level has been reached can the feature be moved to production.

    Getting Started With Continuous Delivery

    Obviously, organizations cannot and should not rush into adopting Continuous Delivery all at once throughout all their business units. The best approach is to focus on improving your biggest delivery bottleneck. CD will automatically show you what the next bottleneck is. This puts you on a measurable improvement path.

    The main goal of using Continuous Delivery is to roll out new features and functionalities that are better than previous iterations — gradually incorporating and refining the CD principle throughout the organization. Go slowly, go smoothly — and watch the improvements!

    Much of the material here is covered more extensively in the book, “The IT Manager’s Guide to Continuous Delivery” which  is available at go.xebialabs.com/IT-Managers-Guide-to-CD.html

    About the Author

    Andrew_Phillips_XebiaLabs_cropAndrew Phillips heads up product management at XebiaLabs. Andrew is an evangelist and thought leader in the DevOps, Cloud and Continuous Delivery space. He sits on the management team and drives product direction, positioning and planning.

  • The WhiteBox PaaS

    The WhiteBox PaaS

    One of my favourite blog posts about PaaS is James Urquhart’s ‘Is your PaaS composable or contextual? (Hint: the answer matters)’. In the post, James distinguishes two different types of PaaS: Contextual and Composable. He additionally implied a third type of PaaS (though he categorized it as “Composable”):

    “Perhaps most importantly, however, there are open source “build” tool chains being deployed directly to infrastructure services that exhibit a purely composable approach toward delivering and operating applications. Combining GitHub with Jenkins with Gradle with AWS CloudFormation and Autoscaling and so on gives a fully automated, flexible “platform” for application development and operations — everything you want from a PaaS. The catch, of course, is that you’ll need to assemble and maintain that tool chain over time (rather than letting the PaaS vendor do it for you).”

    The Whitebox PaaS:

    When we started VisualOps, at first we didn’t realize that we were building a new type of PaaS or rather a customizable PaaS, this was partly due to our DevOps background. As James pointed out, the value of a classic “Contextual” PaaS can be achieved by using the DevOps tool chain. There is more transparency and control implied by ‘customizable’ over ‘composable’ as all aspects of the environment are within your control. Each building block’s entire make-up is determined by you rather than merely arranged. The Blackbox PaaS removes this ability to define your own rules.

    Though currently this category of tool chain is mostly homegrown, the key point here is that PaaS does not have to be a Blackbox. A Whitebox PaaS exposes 100% native interface of the underlying infrastructure, giving ultimate control and transparency. Combining Infrastructure-as-Code and Configuration Management capability as a quick and easy way to build, automate and orchestrate applications. Compare the Whitebox PaaS with the Contextual PaaS and the advantage is clearly that the Whitebox PaaS poses no pre-determined constraints on the application, and as such your apps will be general-purpose and lock-in free.

    Benefits:

    A key benefit of this approach is that the Whitebox PaaS is capable of both deploying and managing itself.  With aWhitebox PaaS service it is possible that the customer can click to deploy a private clone, and no management effort is required since the clone is supervised by the “origin”. This removes the “operation immaturity” stated by John E Vincent in his blog:

    “To be clear while I feel that most organizations aren’t ready for the operational challenges of maintaining a PaaS, the job is made harder by the PaaS software. In both cases, the operational maturity of the products themselves simply isn’t there.”

    A further value is that in the WhiteboxPaaS is not th eapplication runtime. Instead,your code will run in standalone infrastructures (VMs), and PaaS only needs to help automate and orchestrate the application. Thus, even if the PaaS is down, your application will still run un-impacted. This entirely side-steps the issue of ” their downtime [being] your downtime”, as well as the security concerns raised by the multi-tenancy of the public PaaS.

    Objections:

    There may be some concerns regarding the learning curve necessary and intrinsic complexity of the WhiteboxPaaS as it requires your involvement with the application setup and the system architecture. It is true that it is by no means the easiest option. However if you are looking from a business minded perspective, having this knowledge will give you a great competitive advantage. If you don’t know how to do this you may lose the opportunity to build a better, faster and more robust application. Moreover, if people use PaaS to achieve “NoOps”, then it would appear that the real meaning of ‘undifferentiated heavy lifting’ is the day-to-day operations necessary to keep your application running, rather than the knowledge it was built upon. In this context using a WhiteboxPaaS absolves you of all heavy lifting, yet still leaves you with the opportunity and ability to make improvements, it is ‘customizable’.

    This is not to say that PaaS must always be Whitebox. James put it well: “it’s not an either/or choice, much like stability and resiliency”. Different types of PaaS serve different markets and different purposes. From our experience, we have seen some customers begin using a Blackbox PaaS such as Heroku and grow rapidly with it until they reach a point where they want or even need something more flexible and powerful, they then choose to migrate to AWS+Whitebox PaaS such as VisualOps. This progression allows you to concentrate your time and efforts wholly into your business itself at the beginning, then upgrade to a more proficient and flexible platform as your business grows.

    About the Author
    pengPeng Zhao is the Founder and CEO of VisualOps. Previously, he initiated and led the IaaS projects for China Mobile as well as being both a manager and developer in a various companies, including Reuters and Platform Computing. He holds a MsC. from Univerisity College Dublin. His twitter handle is @gnepzhao

  • 5 Secrets of Enterprise DevOps

    5 Secrets of Enterprise DevOps

    whatisdevopsThere is still much debate surrounding the merits of Enterprise DevOps, some say that DevOps is great for the highly scalable startups but not feasible for the enterprise, while others say that DevOps is mandatory for a company’s survival. When enterprises evaluate the potential impact of DevOps adoption, they should consider some key points:

    1. Enterprise DevOps Adoption: One Bite at a Time

    How do you make sure your developers get instant feedback? How can you go back and forth between versions? How do you integrate your entire CI/CD pipeline? While CI/CD for dummies is a good place to start, the biggest problem is how quickly you will get bogged down by the details. Whether you participating in the NASA challenge to find all asteroid threats to the human population and save the planet, or you are at an enterprise figuring out the DevOps strategy – first things first – define the problem and break it down into actionable chunks which may be done in parallel or sequentially.

    When an enterprise is  trying to tackle the DevOps challenge, the common scenario is that lots of people will have lots of interpretations on how and what it means to implement DevOps methodologies. It’s easy for projects to get stalled in the initial planning stages. The only way to take on this challenge is to break it down into smaller workstreams, for example, by defining the workflows in terms of infrastructure automation, build & test automation and configuration management – and deciding which technologies are the best fit to solve the specific challenges in each stream. So, basically, how do you eat an elephant? A spoonful at a time.

    defs

    2. Dead in the water without on-demand cloud capacity

    The limited enterprise data center infrastructure simply cannot keep pace with agile teams that need to be able to spin up multiple parallel environments with a click of a button or an API call without getting the message “ran out of capacity”. This issue becomes even more crucial when the project cycle peaks as a new application or updates need to be deployed in no time. To maintain agility in enterprise IT, enterprises must forever break free from capacity constraints, including compute and storage resources. Without a doubt the public cloud is a great fit – you must be able to use AWS and Google Cloud on-demand. To build a massive software lab entirely on premises, knowing fully well the bursty nature of the workloads, is downright foolish. If you want production on VMware and test environments in AWS, you need to ensure high fidelity environments to have real confidence in the test results. The environments must be exact replicas – identical VMs and identical networking in the data center and the cloud. The cloud gives you the capacity but how can you make the temporary test environment identical to production? Today it is indeed possible to clone your IT infrastructure in the cloud at the push of a button.

    3. Death by Scripting for Complex Multi-tier Environments

    Continuous integration and deployment are great methods increasing effectiveness and efficiencies. However in a multi-tier environment with complex networking elements, the overhead associated with the use of manual scripting to provision the relevant resources (multiple VMs, networking, storage), configure them and deploy all the components of an application each time you need a new test environment is very high. In addition, in today’s highly dynamic environment, scripts become outdated frequently, increasing the pain factor. Design for simplicity and scale: easily repeatable deployments, being able to snapshot and rollback to earlier versions are all requirements that must be carefully considered and met. For example, what if Jenkins could use a single API call to spin up multiple clones of your entire environment in the cloud, run all your tests in parallel, automatically release resources when completed and snapshot the environment in case of errors? Simplifying the automation and designing for complexity is a key requirement for enterprises.

    4. Destroying team silos is easier said than done

    redcarOne of the greatest enterprise DevOps challenges is to make the operations team fully integrated with the dev team and be able to plan and execute despite plenty of unexpected events. True integration of the development and operations teams cannot be stressed enough. For example, the ops team must be part of the SCRUM process. Creating a DevOps team is a start, but creating that DevOps team does not actually bring dev and ops together. Barriers between teams need to come down over time –  the different teams need to cooperate and collaborate towards a larger shared vision.

    5.Managing infrastructure as code is do-able and totally worth the effort

    Delivering on the promise of infrastructure as code does not have to be back breaking. Minimizing delivery cycles including creating just-in-time environments becomes a matter of an API call, hours become minutes. A wide variety of modern technologies are at your fingertips to help you achieve your mission. The most common scenario we see today may be the modern startup where its R&D organization was built with the DevOps notion from the get-go – but that doesn’t mean Enterprises will miss the bus. The enterprises that are adopting modern DevOps methodologies are doing so quickly, without a rip-n-replace of their entire infrastructure. For example, Ram Akuka, Director of DevOps at Deutsche Telekom shared their Enterprise DevOps journey describing how they used VMware, AWS, Chef, Jenkins and Ravello to set up a fully integrated CI/CD pipeline that accelerated their software delivery cycle like never before.

    About the Author

    shrudi bhattShruti Bhat, Director product marketing at Ravello Systems, the industry’s leading nested virtualization and software-defined networking SaaS. Prior to Ravello, Shruti was a virtualization junkie at VMware, where she managed the software-defined storage product line. She combines her MBA at UCLA Anderson with a bachelor’s in computer science engineering and has previously led R&D teams at IBM and HP as well as immersed herself in start-ups.