Category: DevOps Practice

  • How to Troubleshoot CPU Problems

    How to Troubleshoot CPU Problems

    Diagnosing and troubleshooting CPU problems in production in cloud environments can be tricky. Your application might have millions of lines of code, so identifying the exact line of code that is causing the CPU to spike might be the equivalent of finding a needle in a haystack. This article shows how to find that needle (i.e. CPU spiking line of code) in a matter of seconds/minutes.

    To help readers better understand this troubleshooting technique, we built a sample application and deployed it to an AWS EC2 instance. This application when launched caused CPU consumption to spike up to 199.1 percent. Here are the steps we followed to troubleshoot this problem:

    1. Identify threads that consume CPU.
    2. Capture thread dumps.
    3. Identify the lines of code causing the CPU to spike.

    Identify Threads Causing CPU Spikes

    In the EC2 instance, multiple processes could be running. The first step is to identify which process is causing the CPU to spike up, and the best way to do that is to use the ‘TOP’ command present in *nix flavor of operating systems.

    Issue command ‘top’ from the console

    <<start:code>>

    $ top

    <<end:code>>

    This command will display all the processes that are running in the EC2 instance, with high CPU consuming processes displayed at the top. When we issued the command in the EC2 instance, we saw the below output:
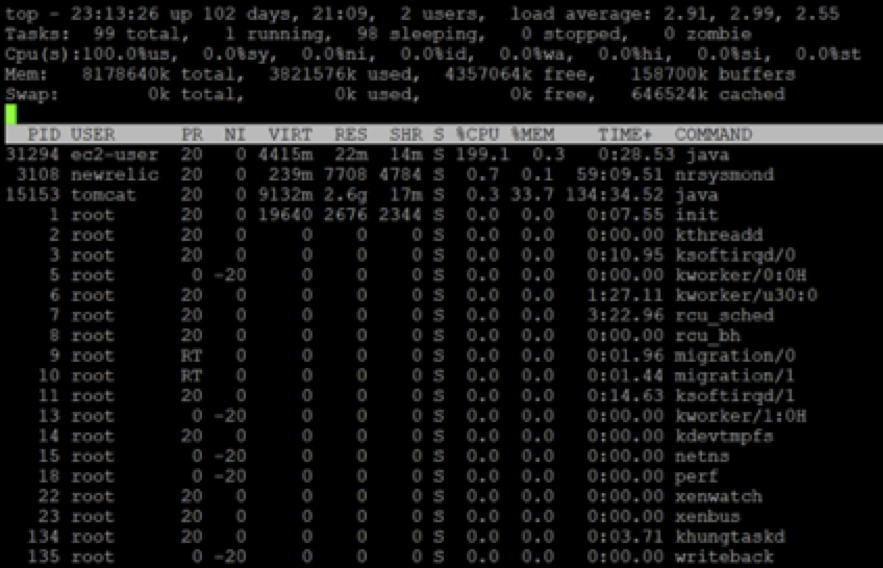
    Fig: ‘top’ command issued from an AWS EC2 instance

    From the output you see process #31294 is consuming 199.1 percent of CPU, which is high consumption.

    Now that we know which process in the EC2 instance is causing the CPU to spike, the next step is to identify the threads within the process that are causing the spike.

    Issue command ‘top -H -p {pid}’ from the console. Example:

    <<start:code>>

    $ top -H -p 31294

    <<end:code>>

    This command will display all the threads are causing the CPU to spike in the 31294 process. When we issued this command in the EC2 instance, we received the below output:
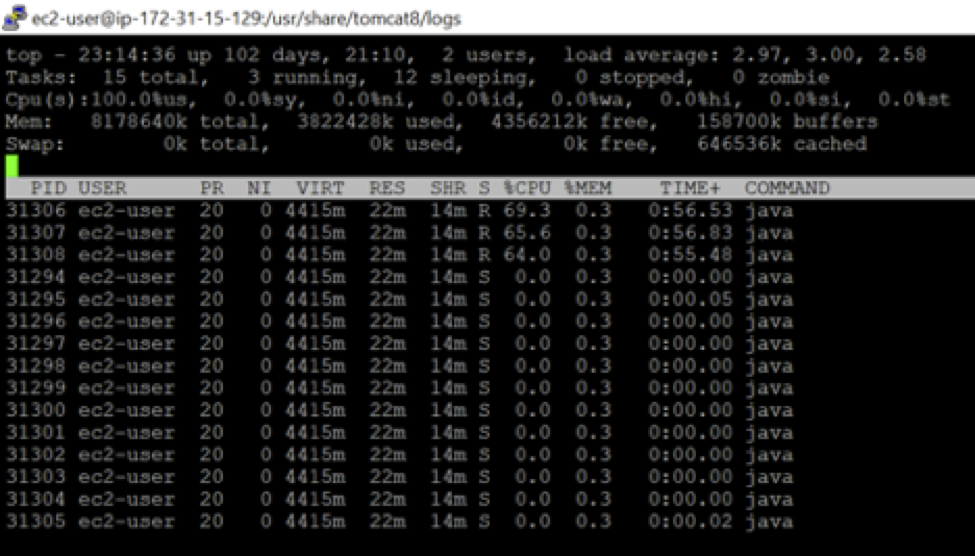
    Fig: ‘top -H -p {pid}’ command issued from an AWS EC2 instance

    From the output you see:

    • Thread Id 31306 consuming 69.3 percent of CPU.
    • Thread Id 31307 consuming 65.6 percent of CPU.
    • Thread Id 31308 consuming 64.0 percent of CPU.
    • The remaining threads consume negligible amounts of CPU.

    Now that we have identified the threads that are causing CPU to spike, the next step is to capture thread dumps so we can identify the lines of code that are causing the CPU spikes.

    Capture Thread Dumps

    A thread dump is a snapshot of all threads that are present in the application. Thread state, stacktrace (i.e. code path that thread is executing) and thread ID-related information of each thread in the application is reported in the thread dump.

    There are eight different options to capture thread dumps. You can choose the option that is convenient to you. One of the simplest options to take thread dump is to use tool ‘jstack’ which is packaged in JDK. This tool can be found in $JAVA_HOME/bin folder. Below is the command to capture thread dump:

    <<start:code>>

    jstack -l  {pid} > {file-path}

    <<end:code>>

    where pid: is the process Id of the application, whose thread dump should be captured and file-path: is the file path where thread dump will be written to.

    Example:

    <<start:code>>

    jstack -l 31294 > /opt/tmp/threadDump.txt

    <<end:code>>

    In this example, the thread dump of the process would be generated in /opt/tmp/threadDump.txt file.

    Identify Lines of Code Causing CPU Spikes

    The next step is to analyze the thread dump to identify the lines of code that are causing the CPU to spike. We analyzed our thread dumps through fastThread, a free online thread dump analysis tool.

    Once we uploaded the captured thread dump, the tool generated this report with multiple sections. On the right top corner of the report is a search box, where we entered the IDs of the threads consuming high CPU—basically, the thread IDs that we identified in step No. 1: 31306, 31307 and 31308.

    fastThread displayed the threads’ stack trace, as shown below.
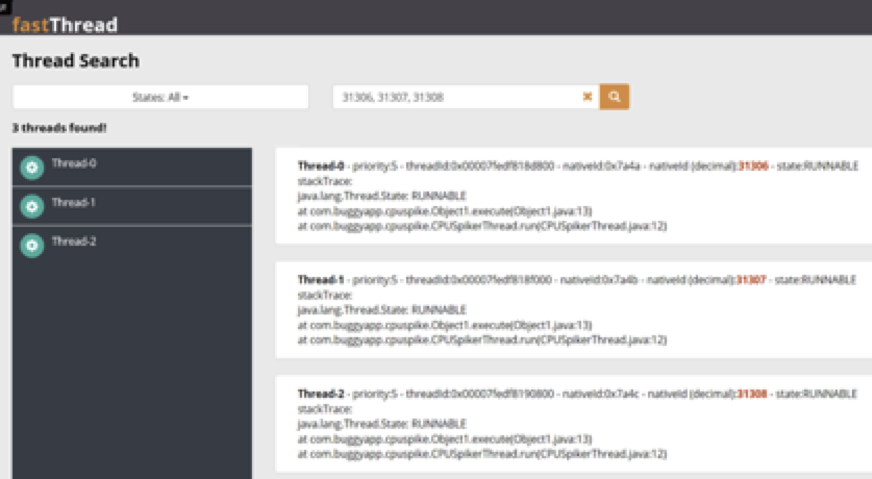
    Fig: FastThread tool displaying CPU consuming thread

    You can notice all the three threads to be in RUNNABLE state and executing this line of code:

    <<start:code>>

    com.buggyapp.cpuspike.Object1.execute(Object1.java:13)

    <<start:code>>

    Apparently following is the application source code:

    <<start:code>>

    1: package com.buggyapp.cpuspike;

    2:

    3: /**

    4: *

    5: * @author Test User

    6: */

    7: public class Object1 {

    8:

    9:         public static void execute() {

    10:

    11:                   while (true) {

    12:

    13:                               doSomething();

    14:                   }

    15:       }

    16:

    17:       public static void doSomething() {

    18:

    19:       }

    20: }

    <<end:code>>

    You can see line No. 13 in object1.java to be ‘doSomething();’. You can see that ‘doSomething()’ method is doing nothing, but it is invoked an infinite number of times because it doesn’t terminate but loops due to line No. 11. If a thread starts to loop an infinite number of times, the CPU will start to spike. That is what exactly happening in this sample program. If the non-terminating loop in line No. 11 is fixed, the CPU spike problem will go away.

    Conclusion

    To summarize, first we need to use ‘TOP’ tool to identify the thread IDs that are causing the CPU spike, then we need to capture the thread dumps. The final step is to analyze thread dumps to identify exact lines of code that are causing CPU to spike up.

    Enjoy troubleshooting and happy hacking!

    — Ram Lakshmanan

  • CloudBees: 2019 to Be Year of DevOps Metrics

    CloudBees: 2019 to Be Year of DevOps Metrics

    While DevOps has come a long way in terms of understanding and adoption, 2019 is going to be marked by a concerted effort to applying metrics to DevOps processes. Applying those metrics will not only substantiate the value of adopting DevOps, they also will provide the impetus many organizations need to close a variety of DevOps gaps that have emerged in recent years.

    For example, a recent survey of 1,076 IT professionals conducted by CloudBees, provider of the open source Jenkins continuous integration/continuous development platform, suggests that while a lot of advances have been made in terms of developers embracing continuous integration, there remains a lot of work to be done before organizations fully embrace continuous development. The survey finds 67 percent of respondents say they are practicing DevOps, but only 50 percent have implemented continuous deployment.

    Brian Dawson, DevOps evangelist for CloudBees, said one of the major reasons that gap exists is that getting developers to embrace continuous integration is an easier challenge than getting disparate developer and IT operations teams to jointly embrace continuous development.

    Closing that gap will require more organizations to measure precisely the benefits they are achieving by making the transition to DevOps, sometimes referred to as value stream management, said Dawson. Once those metrics are collected, he said, it should become easier to drive DevOps processes deeper into most organizations.

    The challenge, however, is that most organizations are not especially disciplined when it comes to monitoring metrics. In fact, according to the CloudBees survey, 34 percent of respondents admit they don’t gather any metrics from their DevOps pipelines.

    In the meantime, Dawson noted the rise of containers and Kubernetes soon may force more widespread adoption of DevOps, as microservices based on containers are frequently updated. Kubernetes may soon provide a common set of definitions from which developers and IT operations teams can create a unified set of processes. A full 79 percent of respondents report they are using Docker and 47 percent employ Kubernetes. Additionally, 38 percent of survey respondents are using containers in both development and test activities, compared to 33 percent using containers from development all the way through to production. CloudBees is trying to drive adoption of Jenkins X, a CI/CD platform that is based on a microservices architecture enabled by containers and Kubernetes.

    Of course, the DevOps gap is hardly limited to definitions. The CloudBees survey also exposes communications gaps that need to be bridged in 2019. For instance, according to the survey, C-level executives and developers have a generally lower opinion than IT operations teams and senior managers concerning the degrees to which DevOps practices are being adopted.

    Dawson said greater focus on DevOps metrics will go a long way to closing DevOps gaps that are becoming more apparent with each passing day. DevOps is relatively easy to subscribe to as a philosophy. It’s only when organizations begin to implement CI/CD systems in a way that can be measured objectively does the commitment to that philosophy get tested.

    — Mike Vizard

  • The Limiting Factors of Microservices Also Apply to FaaS

    The Limiting Factors of Microservices Also Apply to FaaS

    In enterprise development and deployment, the pattern is easy to detect. A big monolithic application is targeted for re-architecting as a microservices architecture. People excited about microservices get together and break up the design to make it far less monolithic and far more loosely coupled.

    If your organization is lucky, it is at this stage that those responsible realize that breaking a monolithic application down too far is bad for complexity, performance, monitoring and maintenance—pretty much everything re-architecting is supposed to fix.

    Far too many organizations don’t realize this until the implementation phase, though. First, a metric ton of little tiny microservices are deployed, then the organization realizes that functionality such as database access can be applied much more efficiently through one larger service that handles all interaction with the database for the app, rather than through five or 10 smaller services that replicate code and end up calling each other anyway.

    Function as a service (FaaS) has much the same issue. It is an astounding solution for some uses, but in the end, users must consider what access the function requires to other parts of the system and what task is being achieved. The early uses of FaaS are well-documented; longer running independent jobs such as image or video processing were a bit early hit, for example, particularly for services that have highly varying traffic rates. But other uses, such as handling bottlenecks in traffic spikes (hello holiday shopping season!) or out-of-band operations processing, are less documented at this point. Entire applications have been designed from the ground up in serverless, but they are relatively few in terms of overall applications out there.

    FaaS is highly suited to DevOps, because upgrading the function is as simple as redeploying code. There are no concerns about OS or library version, because those are largely beyond your control. But that is as big a negative as it is a positive. There is no flexibility in OS version or library inclusion because those are beyond your control—for the most part, anyway.

    As with the vast majority of new technologies, expect adoption of serverless to grow and the hype to grow more quickly. It is definitely in the market where we have seen massive shifts—virtualization and then containers really did live up to the hype in terms of usage—but it needs to have a driving reason for adoption. Look closely at what your application and its DevOps toolchain are doing before hopping into the deep end. For some uses, FaaS is the fastest/easiest/lowest-maintenance solution. But that does not make it the Swiss army knife that virtualization and containers have proven to be. Indeed, if you think persistent storage is painful under containers, try it in a FaaS environment—as just one example.

    FaaS is useful in many scenarios, but just remember where/when/why you are adding FaaS into your DevOps processes, and take advantage of on-demand processing with few scaling limitations while avoiding seeing everything as a FaaS problem because FaaS is the FaD.

    — Don Macvittie

  • Logging: Turning Good DevOps Teams into Great Ones

    Logging: Turning Good DevOps Teams into Great Ones

    The competition is on for DevOps teams that are expected to rev up production on a multitude of projects, with teams and companies aiming to stay atop the global software product marketplace. The complexity of code creation and the pace of deployment has picked up in recent years, and DevOps managers are starting to face serious challenges of scale and efficiency.

    Constant code generation is the first obstacle. Imagine a team producing millions of lines of code, working for weeks and hoping for a smooth release. But testing time arrives, and there is a total data meltdown.

    Wasting valuable programming hours is not an option, but what if managers had the tool to turn back the time to a version before the mistake happened? Managers or developers may view logging as an incredibly boring activity, but it is vital. It serves like a black box of what went wrong—but also a way to roll back the bad code, and return to a more manageable situation.

    Logging and tracking habits ensure that a DevOps team will not see their code fail in production, and cause expensive breakdowns in service. Logging becomes more than a wishful addition, but a pivotal tool that may save a project.

    Data is proliferating, code is constantly being written to offer innovative products or support existing ones. There is a massive amount of data projected to be generated in 2025, only a few short years away, if the global IT production sector keeps increasing its activity. This amount of data to be kept and logged would be roughly 10 times higher compared to the data generated in 2016. This issue has plagued Silicon Valley, but also worldwide tech centers: how to keep track of what is going on. How do companies such as Instacart, Lime and OpenAI track their changes and ensure viability and awareness of errors?

    There is the new role for DevOps managers: ensure fast, modern and stringent log management. Dedication to logging means generating tight order out of the chaos of code creation. The right tool will be economical, intuitive and fast, ensuring the possibility for control in what could become a runaway data meltdown.

    Logging is one of the pillars in the modern DevOps department, and while now it is important, it will become indispensable, along with metrics and analytics.

    DevOps are already aware of the possibilities of logging, to keep track of multiple avenues in product creation, from databases to server side events, and even the effects and behavior of users.

    Stringent log management means making use of a valuable resource of knowledge and decision making, but also operating with a complex system of data. DevOps managers will need the tools to span the demands of stringent log management, for a multi-step process involving log generation, transmission, analytics, storage, archives and disposal.

    The right logging system can streamline those steps. Inexpensive logging tools and systems can unify log management across teams and simplify the process of logging. More services are appearing each day, either cloud-based or self-hosted, and with varying levels of security. With increasing complexity and the drive to create ahead of the competition, it would be the task of DevOps managers to make the team aware of the tools, and to provide tools intuitive and fast enough for the good habit of logging and log management.

    — Chris Nguyen

  • Using Trade Studies in Vetting Tool Stacks

    Using Trade Studies in Vetting Tool Stacks

    Adding to your tool stack should entail more thought than, “Start your free trial today!” It’s great when there is an application need and cloud-based tools are easily grabbed with a few clicks. However, surveying alternatives before making a tool stack change can prevent costly mistakes. Trade studies can help vet best-fit tools for evaluation.

    Short for trade-off, trade studies originated in the aerospace industry as a decision-making aid. Teams of engineers (or developers) usually generate multiple proposed technical solutions for any non-trivial problem. A little searching will find the term multiple criteria decision analysis, with three popular techniques: the analytic hierarchy process, the Kepner-Tregoe method and the Pugh method.

    For DevOps teams, I lean toward variants of the Pugh method because it avoids creating an overly complex weighting and scoring scheme. Pugh analysis has gained popularity among Six Sigma aficionados for the same reason. Multi-disciplinary teams find the process easy to understand and the results just as useful as more algebraic methods taking longer and needing more input.

    Let’s look at three steps in a practical approach: setting criteria, ranking best-fits and starting evaluation.

    Setting Trade Study Criteria

    Most tool stack disasters result from discovering a tool doesn’t meet all the requirements as the project unfolds. In my previous life, our IT team went all-in on a big-name ERP application partly because it featured web-based portals for suppliers. My e-business team discovered those portals required specific port numbers be opened at the firewall, which corporate security immediately rejected. We coded a way out, using Adobe ColdFusion querying the database directly and securing it with LDAP sign-on, but it took months.

    You could search for the “information I could have used YESTERDAY” gif or you can spend time setting the right criteria. Pugh analysis starts with a matrix of criteria rows versus candidate tool columns. What most sources won’t tell you about Pugh analysis is a trick in generating that criteria list:

    • Start with must-have features, with current requirements and anticipated future requirements.
    • Research tools (data sheets!) for near-fits against those must-have criteria and create the matrix.
    • Add all the features prominently listed for each of those near-fit tools to the criteria.
    • Search again for more near-fit tools matching features on the extended list, adding to the matrix.

    A common mistake is stopping after the first two bullets. Almost every trade study I’ve done discovers more tools fit the must-have list but didn’t emphasize all those features on their website. It’s a bit time-consuming, because every time you find a feature of interest you must go back and recheck all the other tools on your near-fit list for it.

    Adding non-requirements? You’ll miss innovation opportunities outside the Venn diagram intersection. My recent client study on marketing reporting tools found one touting support for a dream-list feature. Digging into that tool found it may not support two must-have requirements but does support the others.

    Ranking Best-Fits

    That’s why the trade study criteria list should visually differentiate must-haves from extended features. I usually shade the extended feature rows, then plot how near-fit tools stack up against all criteria. You can certainly add weighting to features for a more sophisticated analysis, but I find a simple must-have versus nice-to-have usually suffices.

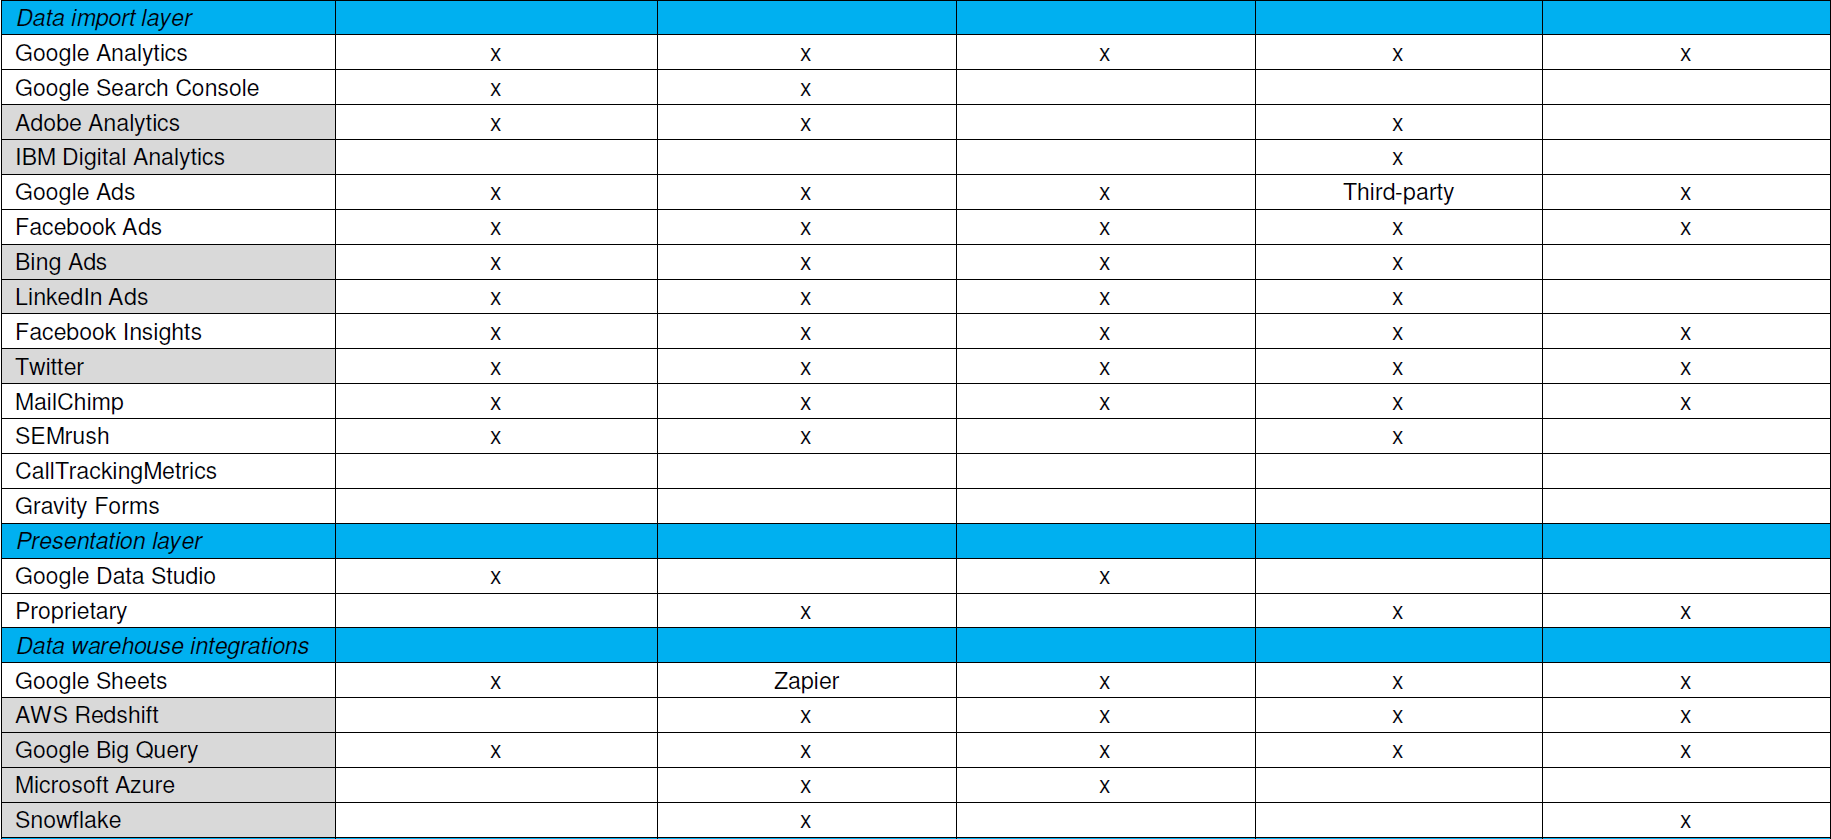
    Now start scoring. A strict Pugh analysis uses a plus-same-minus scoring system. Plus means the tool has a clear advantage on that feature, same is same, and minus means that tool is at a disadvantage compared to the others. I sometimes simplify that to just X for a tool having the feature, blank for it doesn’t. This is mostly a data sheet comparison, and you may want to inject other information such as found reading reviews.

    What you’ll find is a best-fit list, and it probably won’t be perfect. You’d like to see a couple tools capturing most or all the must-haves, and a few more capturing some of them and extended features for contrast. As an example, here’s the trade study matrix for that marketing reporting tool assessment I mentioned with the vendor names omitted.

    Trade studies provide simpler, faster, actionable analysis

    Starting Evaluation

    Notice this doesn’t have cost information yet. Cost biases technical decisions if applied too early, and feature coverage doesn’t necessarily correlate with cost. Vendors also don’t price their stuff the same way. Some price by developer seats, some by data source integrations, some by monthly tracked users (MTUs) on the web.

    With a best-fit list in hand, it’s time to discuss the findings with your team and add information for evaluation. Confirm the scoring, check the vendor pricing models, ask the vendors about unclear feature support and download those free trials to see how they work. Consider how to cover those uncovered must-have features, or if those even are must-haves if few tools support them. Maybe swapping out another tool in the tool stack gets better coverage. Think about innovation those extended features may enable.

    Want simpler, faster, actionable analysis without a massive RFP? Trade studies do that. I think it’s valuable to have one person on your team be the keeper of trade studies, someone skilled at interviewing for requirements and refereeing debates during evaluation. You may want to bring in a consultant skilled at competitive research and analysis to help develop your process. In any case, adapt your approach until trade studies help you make better selections—there is no one right answer.

    — Don Dingee

  • Understanding Pillar 1 of AWS’ Well-Architected Framework

    Understanding Pillar 1 of AWS’ Well-Architected Framework

    AWS’ Well-Architected Framework provides a wealth of incredibly valuable best practices and guidelines structured around five distinct pillars that more cloud-native organizations would do well to heed. The first of these pillars, Operational Excellence, recommends a number of particularly valuable techniques. However, successfully adopting the design principles and practices within Pillar No. 1 requires a strong foundation: a company culture that is willing to continuously work to improve.

    In practice, this can mean holding high-profile “Game Days” focused on advancing internal procedures, nurturing an environment where engineers and product leaders really collaborate to promote business value while pursuing rapid iterative release cycles, championing operational automation and related approaches. Fortunately, adopting the tenants of AWS’ Operational Excellence Pillar can naturally assist in implementing cultural changes where they are needed.

    Design Principles for Operational Excellence

    To achieve operational excellence within AWS, incorporate these six design principles:

    Perform Operations as Code

    The cloud makes it possible to apply the same rigorous practices used to reduce risks in software development (such as version control and automated testing) across your full application environment. Cloud infrastructure allows all aspects of operations to be defined, managed and implemented in software code, spurring a revolution in their automation and consistency.

    Annotated Documentation

    Without effective automation, maintaining documentation is tedious to keep in sync with reality—ultimately making it challenging to troubleshoot issues when they inevitably arise.

    Fortunately, the cloud makes it possible to create documentation automatically as an artifact of the build process. This documentation is detailed and annotated, always up-to-date and can be read by us humans (as well as systems). With automated documentation, engineers can react to issues more rapidly and accurately, and enlist automated systems to do the same.

    Make Frequent, Small and Reversible Changes

    While agile, iterative development methods have become commonplace in many areas, product-driven organizations tend to stick to large releases. However, operational excellence calls for a systems design that incorporates tightly focused, failure-resistant components in an environment designed for constant change and improvement. Implementing this flexibility allows for more rapid deployment of new iterations—but easy rollback if issues pop up.

    Refine Operations Procedures Frequently

    Operational excellence requires holding regular meetings to reflect, suggest and implement improvements to operations procedures, the same as those held when practicing any agile methodology. Game Days, where procedures are tested and iterated on, will help build and strengthen excellence as well.

    Anticipate Failure

    Rather than waiting for failures to strike and then studying the causes in a post-mortem, practicing routine “pre-mortem” exercises that recognize failure points before any harm is done. Game Days can then be used to investigate these scenarios and ultimately bolster resilience. For example, premier cloud-native organization Netflix demonstrates this design principle with its Chaos Monkey project, which is purpose-built to strengthen application resiliency against random instance failures.

    Learn From All Operational Failures

    Operationally excellent cultures have the openness to share post-mortem findings across the organization without pointing fingers. This broadly shared knowledge can then inform improvements in all areas of the business, not just in engineering and product departments but marketing, finance, and others as well.

    Critical Components of Operational Excellence

    Embracing the six design principles above paves the way for you to practice operational excellence in three key areas defined by the Well-Architected Framework: Preparation, Operation and Evolution.

    Preparation

    Operational excellence requires operations teams to possess a clear and complete understanding of the goals for each workload within the complete system, and how those goals will be achieved.

    Operational Priorities

    This clarity must include knowledge of the workloads the operations team is responsible for, the shared business goals and their role in achieving them and any relevant regulatory or compliance requirements. This information allows teams to correctly prioritize those workloads with greater importance or complexity.

    AWS offers these helpful resources for setting operational priorities:

    Businesses can also enlist AWS Certified Partners—experts selected by AWS to provide consulting, and professional and managed services as an extension of a company’s own operations team—to make sure priorities are set wisely.

    Design for Operations

    A well-architected workload is designed for operations from the beginning, with consideration for deployment, updates and similar needs. AWS provides the ability to model entire workloads as code, from applications to infrastructure, policy, governance and operations. It also offers a robust set of tools and services for operation design, such as CloudFormation and the AWS Developer Tools. Businesses can also create systems featuring the observability and insights needed to operate workloads by using AWS Cloudtrail, AWS VPC Flow Logs, AWS CloudWatch and more.

    Operational Readiness

    Beyond the technology used, operational excellence is also a function of elegant, consistent processes and procedures for deploying and operating workloads. This means maintaining accurate documentation, building a well-trained and resourced team of experts and having governance that makes sure everything is done the right way.

    It’s also smart to utilize automation when evaluating environments. CloudWatch events can be automatically addressed by scripting procedures created with AWS Systems Manager’s Run Command and Lambda. Configurations can be automated and benchmarked against best practices using AWS Config rules.

    Operation

    The first step to operational success is clearly defining it with key metrics based on shared business goals, so that events can be addressed with those goals in mind and success can be recognized when (or when not) achieved.

    Understanding Operational Health

    Because no two businesses are the same, the definition of operational health and success will vary. For example, one company might have workloads that demand low-latency and high-throughput performance to be prioritized over cost. Another might require a focus on cost-effectiveness and high availability. Operations teams must first understand those priorities and how they serve business goals to deliver what is actually needed.

    AWS offers tools and services for analyzing workloads to serve specific goals. CloudWatch Logs and Dashboards can provide system and business level views of key metrics. Amazon ElasticSearch and Kibana can offer further visualization of operational health metrics, as can outside tools and services like Logstash and Grafana.

    Responding to Events

    When events occur, operational excellence means having prepared and even anticipated failures and putting metrics, processes and procedures into action for a quick and effective response. At the same time, teams must have metrics to understand the business impact of workload components to resolve the highest priority issues first. AWS enables teams to script automatic event responses, such as automated rollbacks triggered by failures. Amazon CloudWatch offers a powerful service for these automated responses.

    Evolution

    Curiosity and a desire to learn and improve are essential traits for operations teams pursuing operational excellence. Every experience should be viewed as an opportunity to learn and to share that new knowledge base. The best teams enjoy learning from failure and by asking for the perspective of other business units.

    AWS offers an incredible platform for the analysis and experimentation needed to evolve practices. Amazon CloudWatch and CloudTrail can be combined with Amazon ElasticSearch with Kibana. Data exported to Amazon S3 can enable analysis with Amazon Athena and Amazon QuickSight. AWS also helps share best practices with CloudFormation templates, Chef Cookbooks, Ansible Playbooks, Lambda functions and more. 

    — Jonathan LaCour

  • 5 Ways KPI Analysis Helps DevOps

    5 Ways KPI Analysis Helps DevOps

    Four Vs drive big data solutions: volume, velocity, variety and veracity. Volume and velocity are technical considerations usually receiving a healthy dose of attention among architects and coders. However, variety and veracity often determine success or failure, and they tend to sneak up on teams who haven’t fully considered them. Key performance indicator, or KPI, analysis can head off variety and veracity problems before they escalate.

    When some folks say “KPI analysis,” they mean KPI monitoring and evaluation—the business intelligence perspective. I’m talking about a DevOps analysis discovering which KPIs should be monitored and what data is needed. One step in this analysis traces each desired KPI back through necessary transforms to its required data sources, often termed as facts. Such an analysis clarifies variety and quickly establishes a path to veracity.

    From a strategy perspective, KPI analysis can also mitigate the symptoms of “big bad data” that devour an organization, consuming people and resources rapidly. Here are five ways KPI analysis helps DevOps teams get a handle on big data.

    1. It prevents over-measuring. If you don’t know what you’re looking for, more data probably won’t help you find it. Teams experiencing FOMO (fear of missing out) expand their data gathering, hoping more variety uncovers something interesting. Once your KPIs have been discovered and fully analyzed, stop exploring and start exploiting. Stick to monitoring KPIs directly driving the most impact for your business.
    2. It minimizes bloating. In any computational system, the most expensive operation is moving data. Simply moving stuff around eats processor, network and storage bandwidth. Even with cost-effective storage available, unnecessary data means a bloated infrastructure and less efficiency. KPI analysis identifies a minimum spanning set of data sources. A workload-optimized solution then concentrates on efficient algorithm implementations, yielding results aligned with your KPIs.
    3. It stops wallowing. Allowing people too close to raw big data is extremely dangerous. Off-the-shelf analytics tools often carry a lot of non-KPI variables with them. Cloud-based martech tools are some of the biggest offenders; they are essentially showing off how many ways they can expose their underlying data. Avoiding the temptation to wallow through intriguing but ultimately irrelevant data saves precious brain cells. Customize reports and optimize dashboards around your KPIs.
    4. It de-obfuscates conversations. Nope, not talking about JavaScript here. We want everyone in the organization talking about the same KPIs and only those KPIs. You’ve seen those presentations where someone tries to dazzle an audience with mostly meaningless charts and graphs. Obfuscating your KPIs underneath a pile of other observations wastes time and risks defeating the purpose. Trust your KPIs and focus all organizational conversation on those.
    5. It thwarts non-causality. This is one place where data scientists and analysts really earn their money. Part of a solid KPI analysis determines causality—if your data sources change by some amount, the KPI needle responds by a quantified amount. Understanding those relationships is critical in avoiding false conclusions from data. If your KPI isn’t moving despite changes at the data sources, or your KPI is changing and the obvious data sources aren’t, step back and look at causality and transforms again.

    If you’re seeing these symptoms developing in your organization, it might be a sign automation was rushed in before KPIs were completely analyzed. At that point the toughest symptom to deal with is bloating. You may be stuck with a sized and funded infrastructure, and you really shouldn’t throw out good data already captured. Ongoing KPI analysis can lead your team to optimizations moving forward.

    Ideally, KPI analysis is performed upfront and these symptoms never develop. Realistically, complex systems have cycles of learning before their behavior is fully understood. Even a good upfront analysis may benefit from a revisit as trends start becoming apparent. When KPIs are rolled up periodically, you’ll need a minimum of six periods of results before expected causality is confirmed, maybe more. If that period is monthly, you’ll need ample patience.

    You’re spending too much on a big data solution to afford a big bad data outcome. KPI analysis is an important step, one DevOps teams with both technical and business expertise can excel at with some practice.

    — Don Dingee

  • Demystifying Crucial Phases of Project Management

    Demystifying Crucial Phases of Project Management

    With competition becoming more intense for development companies, project management is becoming a more integral part of every project. It’s no longer limited to the actual creation of a new project. Now, it’s about planning, communicating, collaborating and analyzing. With so many moving parts, it’s difficult to understand all of the important phases of project management.

    This guide will cover all the phases of project management so you can understand how they apply to your projects in DevOps. Even if you don’t have a background in project management, you’ll be a pro in no time.

    Defining Project Management

    First, we need to articulate exactly what project management is. It’s the discipline of initiating, planning and executing the work of a team to achieve specific goals within a time frame. It involves a lot of interteam collaboration, and it isn’t any single activity.

    Project management experts draw knowledge from areas including human resources, communications, risk management and even accounting. That being said, there are a lot of moving parts that can make project management tricky, particularly with large projects or growing teams. Knowing all of the phases of a project process makes it possible to navigate these areas effectively.

    A project process is any unique action that represents the entire project internal process within DevOps. This is usually decided by the project manager. It might include instructions, procedures, plans or organizational software.

    Understanding the Phases of Project Management

    When you’re talking about the project life cycle, you need to understand the project management phases. Throughout the project life cycle, you should be able to define clear goals. These will include a combination of the following:

    • What will be accomplished?
    • How will you measure what has been accomplished?
    • Who will work on the project?
    • How will you monitor progress?

    Having these questions above in mind will direct the project along its life cycle. Without any clear initiative or direction, you can’t expect team members to know where to go with their tasks. That’s why clear goals are key in the world of DevOps, where every task matters.

    Now that you know the importance of clear goal setting, it’s time to finally define the phases of project management. There are five in total, and they are:

    1. Initiation
    2. Planning
    3. Execution
    4. Performance monitoring
    5. Closure

    Phase 1: Initiation

    This is the beginning of the project. In this phase, you’ll want to define your goals, what the project is exactly, and how it fits into your company goals. One of the biggest pitfalls in the world of development is choosing to start a new project for technology’s sake. While there’s always something to be gained in innovation, avoid falling for shiny-object syndrome. Just because you have new technology doesn’t mean it makes sense as part of your bigger business strategy.

    To make sure you’re choosing the right project for your team, ask the following questions in this phase:

    • Why are you choosing this project now?
    • Is this project realistic?
    • What does the end result look like?

    From there, you’ll need to get approval for the project from higher-ups. This might take some time, so be sure to articulate your goals clearly at this stage so you don’t waste energy. Finally, you or your project manager will create a project initiation document (PID), which is a formal outline of the purpose and requirements of a new project.

    It’s smart to include developers across teams in these initial meetings to ensure they can give guidance about the technical challenges of a new project. Remember, collaboration is key at every stage.

    Phase 2: Planning

    Now that you’ve gotten the green light, it’s time to create a plan of action. This will involve goal setting and job responsibilities for all team members of all levels. Don’t forget about the S.M.A.R.T. goal-setting process to make sure you’re creating goals that are realistic. Remember, smart goals are specific, measurable, attainable, realistic and time-bound by a deadline.

    This is the most vital stage of project management. It’s when you’ll put pen to paper and work out any kinks. Poor planning will reflect itself in every stage after, so take the time to work with teams to decide the best plan of action. Limit your deadlines for every task to 10 days or les to ensure you don’t let obstacles take away from your final product.

    Phase 3: Execution

    The time for planning is over and now it’s time to get down to business. This is exciting because you’ll see your project start to shape itself. Your programmers are busy coding, designers are building graphics and managers are creating progress reports.

    Don’t forget to update your higher-ups during this process, even with small changes. Regular updates are necessary to make sure everything is progressing according to schedule. Conduct weekly meetings to make sure everyone knows how the entire team is progressing as well as their own next steps. A project management software is valuable at this stage.

    Phase 4: Project Performance

    Now that the project is completed, it’s time to reflect on your success. Did everything align with your original goals? Did you meet your deadlines? Think about your objectives, your deliverables, your cost,and the performance of the project. How did all of these things measure up?

    You’ll base your future project plans on the success of your analysis at this stage. Even though the project is officially done, that doesn’t mean there isn’t still more to learn. Also, don’t forget about preparing maintenance for your software going forward. You might need a program like Amazon CloudWatch – monitoring and logging service to continue to learn about the success of your project into the future.

    Phase 5: Closure

    Your project is completed and your analysis is coming to a close. It’s time to follow-up on any final pieces and close the door on your project for good. This is also known as the post-mortem phase because it’s when you’ll decide your key takeaways and stop progressing.


    Project managers will meet together to decide key players, project performance, and deadline analysis. How can you learn from the events of the past few days or weeks to grow during your next project? Don’t overlook this stage. It’s important to reflect on what worked and what didn’t. If something didn’t work out the way it was planning, talk about it.


    Finally, host a team meeting to talk about how the project went as a group. You might have a different perspective than those under you, and it’s important that everyone feels heard. Take team member feedback seriously so you can learn from it for next time.

    Manage Projects Successfully

    In the world of DevOps, project management plays a lead role. Don’t overlook any stage in the process as not being necessary. It’s important to have a well-rounded, thoughtful approach to leadership. There is no perfect way to lead a group in big projects, but you can use every phrase to carefully tackle new challenges and grow your team strengths.


    When you practice these stages above, they’ll come naturally. You’ll notice each stage leading gently into the next, and that’s how you make a business that’s ready for anything. Every project manager will experience some level of failure, but learn how to roll with the punches and keep moving forward.

    — Wendy Dessler

  • CollabNet VersionOne State of Agile Survey: Join the Fray

    CollabNet VersionOne State of Agile Survey: Join the Fray

    If you follow the news on Agile software development, topics such as adoption, scaling, Kanban, Scrum or certifications, it’s likely you saw statistics in your reading that were taken from the “State of Agile Report.”

    For the last 12 years, CollabNet VersionOne has been surveying the Agile software development community and providing this valuable body of research to the market. The data is widely cited in publications worldwide and used by organizations to gauge trends in the industry and help business leaders in their decision-making. Many vendor organizations also reference the report to gain insights on how to better serve customers.

    Last year, the 12th “State of Agile Report” was compiled with insights from nearly 1,500 respondents. That’s a lot! The more IT professionals who take this survey, the more useful the results will be. By gathering more survey responses, CollabNet VersionOne can provide a more accurate analysis to help guide the industry.

    The best way for us to get a big-picture view of how organizations are adopting and scaling the practice is to gain an understanding of individuals’ experiences.

    Results from Last Year

    Last year’s report told us that organizations are realizing the benefits they set out to achieve by adopting Agile. Here were some other the key insights from the report: (You can download a full copy of the report here: https://explore.versionone.com/state-of-agile).

    • Agile is expanding within the enterprise – Adoption is growing within organizations, both more broadly and deeply. A higher percentage of respondents this year report that “all or almost all” of their teams are Agile, and that the principles and practices are being adopted at higher levels in the organization.
    • There is room for improvement in maturity – Only a small percentage of respondents indicated that their organizations have a high level of competency with Agile practices across the organization. The majority acknowledge that their organizations are still maturing.
    • Organizations are scaling Agile – The Scaled Agile Framework (SAFe) is reported as the most widely used approach for scaling. Internal coaches, consistent practices and processes across teams and the implementation of a common tool across teams are the top three factors reported to have been most helpful in scaling Agile.
    • DevOps initiatives are on the rise – The survey reveals the importance of accelerating the speed of delivery of high-quality software and the emphasis on customer satisfaction. It’s no surprise, then, that a large number of the survey respondents report that a DevOps initiative is underway or planned for the next 12 months.

    Who Should Take the Survey?

    The “State of Agile” survey is for anyone with stakes in the software development life cycle. It is not just for enthusiasts or members of teams using the practice; even if your organization is not using Agile, we still want to hear from you.

    Here are some examples of job titles that fit within the scope of this survey:

    • Business analysts
    • C-level executives
    • Development leaders
    • Software developers
    • DevOps managers
    • Consultants/trainers
    • Product managers and owners
    • Project managers
    • Scrum Masters
    • Agile coaches

    If any of these roles describe you, we welcome you to take the 13th annual “State of Agile” survey today. It will take you around five to eight minutes to complete. You can begin by clicking here. Responses will be accepted until midnight, Dec. 31.

    Thank you for your valuable input.

    — Thomas Hooker

  • The Third Way of DevOps: Stacking the Cards in Your Favor

    The Third Way of DevOps: Stacking the Cards in Your Favor

    In the Third Way of DevOps, change is as much attitude as it is behavior

    In our first post, “The Third Way of DevOps – From Knowing to Being,” we shared our thoughts on effectively applying knowledge to put the Three Ways of DevOps into practice. This blog explores a complementary dimension: How to build confidence when faced with a seemingly impossible task.

    This is the all-too-familiar setting. You’ve seen an opportunity to improve things and genuinely want to do something about it. But you soon feel the clarity and anticipation draining out of you. First there’s the pressure of the day job. Then there’s the inertia of your co-workers, who are oblivious of or indifferent or hostile to your ideas. And finally, as if these concerns weren’t enough, you’re faced with the difficulty of unlearning old habits and developing new ones. In short, you don’t take action on what you have learned and know.

    Self-efficacy

    Expressed in the somewhat abstract language of the theories of Planned Behavior and Reasoned Action, there’s a gap between behavioral intention and actual behavior. A plausible explanation for the gap is low self-efficacy, defined as the conviction that one can successfully execute the behavior required to produce desired outcomes. It’s the belief we have in our own abilities, specifically our ability to meet the challenges ahead of us and complete a task successfully. This is a crucial precondition because investigations have shown that peoples’ behavior is strongly influenced by their confidence in their ability to execute that behavior.

    If-Then-Else

    So why doubt your ability to change? Well, when a change seems large, the gut reaction is to feel the need to come up with a project plan. Because a plan creates the confidence that when the steps are taken, the desired results will be achieved. Without a plan, we’d be irresponsible risk-takers. That’s how we’ve been taught to think. And rightly so—at least, in a predictable environment, where you can determine which steps will have which effects. If you work with IT, you are likely to think in terms of If-Then-Else. This is how we would like to believe IT always works. Predictably.

    If-Then-Maybe

    However—and this might be the biggest “however” you’ve come across for a while—things are not always predictable. Not unpredictable in the sense that it should have worked but something just went wrong because we didn’t do enough homework; unpredictable as in simply unknowable. Unpredictable as in possibly seeing a pattern of behavior in hindsight, but never having been able to predict it, let alone control it. Unpredictable as in “complex adaptive systems,” as they are referred to in the world of complexity thinking. It’s no longer If-Then-Else; the name of the game is If-Then-Maybe.

    Complexity Thinking 

    Complex adaptive systems are all around us but if you’ve been used to thinking that things are—or could or should be—predictable, you tend not to see them for what they are: one of kinds of systems that exist in nature. The Cynefin sense-making framework describes systems in terms of five domains: obvious, complicated, complex, chaotic and disorder. Obvious and complicated are both predictable domains, where something in the complicated domain needs a bit of work to discover the predictability than when it is obvious. Complex and chaotic are unpredictable domains, the main difference being that something chaotic is dangerously unpredictable and therefore needs direct action. There is a fifth domain: disorder. You are in this domain when you don’t know which of the other four domains best describes the current situation. A word of warning: People’s cognitive bias will often lead them to think that they are in their usual domain, in which they feel most comfortable.

    Step by Step 

    The way to introduce changes in complex systems successfully is to take it step by step. Because you can’t predict the results of a step, you have to closely monitor what effects—both desired and less so—each step creates. Then, based on your assessment of the new situation, you determine which next step to take. Rather than moving in a straight line toward a “to be” end state, you move each step to the “adjacent possible.” You make good use of the disposition of the system; in other words, where the energy is tending to flow.

    No Big Answers, Just Little Questions

    So, it’s not a case of looking for the big answer. It’s about a series of small questions. The Toyota Kata approach recommends asking ourselves (and others) these questions:

    • What are we trying to achieve?
    • Where are we now?
    • What obstacle is now in our way?
    • What’s our next step, and what do we expect?
    • When can we see what we’ve learned from taking that step?

    A key concept is that we should work towards the next “target condition.” This is an interim goal on the way to whatever we want to achieve. It just describes where you want to be next, not how to get there. It labels the future set of circumstances that lie just beyond our current level of understanding. It will typically have to be achieved between a relatively short period between a week and a few months; otherwise, it will be ineffective. How we will get there will emerge though the process of experimentation.

    Stack the Cards in Your Favor 

    So the next time you feel inspired to make a (little) difference, don’t be discouraged by the prospect of having to think everything through in detail. This is often even contra-productive. The liberating realization that you can take things step by step, is good for your self-efficacy, increasing the chances of actually achieving results.

    This article was co-authored by Mike Orzen.

    — Mark Smalley