Category: DevOps Practice

  • How Low-Code Makes DevOps Stronger

    How Low-Code Makes DevOps Stronger

    While its roots can be traced back to rapid-application development (RAD), low-code application development started to gain serious momentum about three years ago. Initially, some in the DevOps community dismissed the trend, even as myriad approaches—from no-code to low-code for professional developers—started to enter the market.

    At the time, enterprises of all sizes had embraced agile software development processes, moving to cloud infrastructure for some critical workloads and using test automation tools widely. DevOps emerged as an essential discipline, and it was assumed that its dominance would overshadow low-code.

    Fast forward to 2021, Gartner predicts that the low-code development market will increase by 22.6%, to a total of $13.8 billion in one year, so it’s clear that the obituary for low-code was premature. The growth of the low-code market hasn’t restricted growth of DevOps, either. Thousands of medium to large enterprises either are already adopting or planning to adopt low-code for professional development, and DevOps’s growth continues. Low-code platforms for professional development haven’t replaced the DevOps model; instead it places an emphasis on a robust software development life cycle working with the business and IT to increase the velocity of transformational digital experiences.

    The Need for Speed

    During the early days of the COVID-19 pandemic, many organizations were compelled to accelerate their digital innovation to adapt their business activities to the new normal, or find new ways to compete against more nimble competitors to stay afloat. To enable delivery of their services to suddenly distributed customers and employees, they began to switch to low-code development platforms to deliver solutions faster.

    Low-code software is easy customizable, can fit any organizational needs, doesn’t require in-depth coding skills and speeds up development. Low-code platforms feature a host of pre-made tools to develop an app in a matter of hours instead of weeks or months.

    Some low-code development platforms feature integrated DevOps services and automated testing capabilities. Cutting edge platforms use AI to generate test cases to be executed on the cloud as part of the continuous integration/continuous delivery (CI/CD) pipeline). While these platforms It don’t replace developers, they can help to automate their work so they can focus their time on new features and big ideas, rather than on coding repetitive but essential tests, or on figuring out the back end complexities.

    A Confidence Booster

    With a low-code platform, DevOps teams get automated tools for testing, deployment, security, data management — all of the back end development necessities — plus front end and design capabilities. This is a very different set of skills and expertise, but using low-code platforms to simplify development processes allows almost any developer to work on any app through its full life cycle.

    Even if an aspiring coder from the organization’s marketing team builds an internal app, DevOps team won’t have to worry about build validation or version control, because low-code enables a continuous process.

    One small DevOps team can efficiently and confidently manage building and deploying an app from any developer. It can also deploy these apps across multiple devices — with very little upskilling of different programming languages required. Low-code platforms include pre-wired components, templates and sample apps for smart speakers, wearables, AR, PWA, native mobile and other real-world use cases.

    Strategic Focus

    Once low-code frees the organization’s DevOps teams from repetitive tasks and eases workload burdens, teams can concentrate on more complex problems, like upgrading and maintaining existing enterprise-class apps — enterprise resource planning comes to mind — or work on other high-value digital and operational strategic initiatives.

    Long Live DevOps and Low-Code!

    Low-code for professional developers is best suited for developing consumer-grade mobile and multi-experience apps. Whether an organization is trying to digitize an old process or create new ways to engage with consumers, business partners, customers or employees, low-code development helps organizations be more responsive and agile — just like a good DevOps culture. With the ever-rising demand of a digital economy and the subsequent shortage of development talent, by adopting the velocity of low-code development approaches, we can enhance the power of the developer (and the DevOps) models to meet the next business challenge.

  • Continuous Testing Practices – Part 2

    Continuous Testing Practices – Part 2

    In my prior blog, Continuous Testing – The Quest for Quality at Speed, I described five tenets and some of the practices for continuous testing to help explain what continuous testing is. In my consulting work, I find it necessary to use 15 categories of practices to assess an organizations’ continuous testing capabilities. Given the large number of practices, I am publishing the complete list in three parts.

    This article is part two, which covers the following categories of continuous testing practices:

    • Test automation
    • Test tools
    • Test infrastructure management
    • Test scripts
    • Test results

    You can read part one here.

    Test Automation

    • Test automation requirements are defined.
    • New automated tests are created for each new feature in compliance with the test strategies for the product or service.
    • Automated test cases are reviewed and tested to ensure they satisfy the purpose of the test.
    • Automated test cases are compliant with test case standards for the product or service.
    • Automated test cases are designed to run independent of each other.

    Test Tools

    • All testing tools in a pipeline are integrated into a common framework which enables orchestration of test resources and automation of test tasks.
    • A test framework supports automation of everything needed for testing including test cases, test tools, applications, test infrastructures, and test data.
    • A test framework can be invoked, controlled and released through an application programming interface (API) so that it can be integrated into a DevOps continuous delivery toolchain.
    • Features provided by test frameworks include capabilities to orchestrate the test infrastructure, select tests, control the execution of tests, monitor tests in progress and report test results, logs and verdict data.
    • A selection criterion is defined for test tools. The criterion includes requirements for coverage, automation features, support, compatibility with the automation framework, compatibility with test progress reporting systems.
    • Test tool software versions are maintained in a source version management system.
    • A common test automation framework is defined for the entire organization to ensure all test tools can integrate and be orchestrated with common test automation practices.
    • Test automation tools are available for testing all features of an application that can be automated.
    • Manual testing tools are available for testing features that must be tested manually. These tools can report results to a common test management reporting system.
    • Test authoring tools support input error checking and features which help encourage scripts development according to best practices. Examples of such features include the ability to create and use a repository of known good test utilities for control and analysis of the system under test.
    • DevOps-ready test tools are employed that easily integrate into a test framework and toolchain and elastically scale on demand vertically or horizontally, to match the varying capacity and workload demands of tests of software changes going through the continuous delivery pipeline.
    • DevOps-ready tools can be orchestrated, scaled, invoked, controlled and monitored from an API.

    Test Infrastructure Management

    • Standards for describing resources and topologies for test configurations are documented.
    • Techniques used to accelerate the time for executing tests are used such as vertical and horizontal scaling of test campaigns.
    • Test resources and topology files are maintained in a software version management system.
    • Orchestration and automation tests are conducted to verify the software that supports orchestration and automation layers satisfy their assessment criterion
    • The test infrastructure used for each stage in the pipeline is a replica of production configuration variations, as much as is practical.
    • Infrastructures for testing are elastic, with the ability to stand up and release (i.e. orchestrate) infrastructure configurations as needed for use with specific tests. Typical techniques that are employed to orchestrate test environments include dynamic infrastructure configuration tools, infrastructure-as-code (IaC) strategies, cloud services, testing-as-a-service (TaaS) providers and use of tools to stand up and release applications and test resources packaged in immutable containers.
    • Database migration, replication and restore tools also need to be tested to ensure they can function quickly enough to keep up with the speed of the DevOps continuous deployment pipeline cadence.
    • Health checks on the test environment are used to reduce the chance of false negative test verdicts that could be caused by test environment failures.

    Test Scripts

    • Test scripts are maintained in a software version management system.
    • Guidelines for test scripts and test suites practices are documented.
    • Test utilities, tests and test suites follow guidelines for documentation, test results reporting, reuse and maintenance practices.
    • Test script peer reviews are conducted to encourage collaboration and to ensure test script best practices are used.
    • Each test script has a unique identification.
    • The test type of the script is identified (for example, sanity test, build test, smoke test, security, acceptance test, conformance test, functional test, unit test, patch test, bug fix test, integration test, regression test, performance test, system test, other).
    • Evidence, including an execution log, demonstrates that each verdict of tests work.
    • Tests determine at least one verdict, which may be ‘Pass,’ ‘Fail’ or ‘Inconclusive.’
    • Verdict and assertions priorities are recorded or reported.
    • Tests are data-driven. Data inputs control execution of the test.
    • Each test script is is tagged with a codified risk level.
    • Failure verdicts reported by the script include a tag for risk priority.

    Test Results

    • Techniques are used to ensure test results analysis keeps up with accelerated tests. For example, test design techniques, analysis tools built into test frameworks, test results dashboards and/or test results analyzers that run in parallel with the tests.
    • Quality assurance goals include specific thresholds for test coverage prior to release such as run-to-plan (RTP) and pass-to-plan (PTP) minimum thresholds. RTP is a measure of how many tests of the total planned tests have completed. PTP is a measure of how many of the completed tests pass. For example, 95% RTP and 90% PTP.
    • Quality goals include a measurement and threshold for reliability. For example, S-curves for pass rates can indicate reliability when the pass rate stabilizes for a period. Example: 95% pass rate for three consecutive test cycles.
    • Time to recover a failed service is routinely tested and used to calculate mean-time-to-recover (MTTR).
    • Monitoring and management tests are conducted to verify monitoring and management capabilities of the pipeline satisfy their assessment criterion.
    • Technical and business metrics are designed to monitor the success of DevOps testing for technical continuous improvement and to justify business cases needed to implement those improvements.
    • Input and output metrics and acceptance criterion exist for each stage in the value stream.

    What This Means

    Continuous testing (CT) practices are critical to success with DevOps. Many organizations underestimate both the importance and the practices needed to engineer continuous testing. This article is the second in a three-part series that provides a comprehensive list of practices that can be used to understand and assess an organization’s continuous testing capabilities. To learn more about my blueprint for continuous testing, refer to my book Engineering DevOps.

  • Continuous Testing Practices (Part 1)

    Continuous Testing Practices (Part 1)

    In my prior blog, Continuous Testing – The Quest for Quality at Speed, I described five tenets and some of the practices for continuous testing (CT) to help those understand what continuous testing is. In my consulting work, I find it necessary to use 15 categories of practices to assess an organizations’ continuous testing capabilities. Given the large number of practices, I am publishing the complete list in three parts.

    This article is part one, which covers the following categories of continuous testing practices:

    • Continuous testing tenets
    • Leadership
    • Culture
    • Test strategy and plans
    • Test management

    Continuous Testing Tenets

    • The continuous testing principle “shift left” is practiced, in which tests are conducted as early in the pipeline as possible.
    • The continuous testing principle “fail early” is practiced, in which tests are arranged so that the most likely problems are found in the early stages of the pipeline.
    • The continuous testing principle “fail often” is practiced, in which tests are run frequently and with many different conditions such as different variations of operating systems, production topologies, browsers and production versions of services.
    • The continuous testing principle “test fast” is practiced, in which tests are run in quick cycles to get to a verdict as quickly as possible.
    • The continuous testing principle “be relevant” is practiced in which tests are focused on the most important tests and results for each purpose and stakeholder.

    Leadership

    • Leaders establish a definition and vision for software quality.
    • Leaders establish a definition for test coverage.
    • Leaders clarify how everyone’s roles fit with the CT strategy.
    • Leaders establish incentives for CT performance.
    • Leaders proactively sponsor quality assurance testing as a strategic element of their budgets and operations rather than viewing testing as a cost to avoid. This includes budgeting time and money for DevOps test training, test resources, test frameworks, test tools, test management and establishing policies for assessments.
    • Operational and capital expense budgets are planned together with all stakeholders to ensure all stakeholders agree there is enough opex and capex budget for the organization to accomplish quality goals for the budget period being planned.
    • Cost accounting practices ensure the capex and opex expenditures are tracked and made visible to stakeholders.
    • Schedules for CT improvement projects are identified and tracked.
    • Skills development programs provide individuals and teams opportunities to learn CT practices.
    • The performance of continuous quality assurance programs are monitored and made visible to stakeholders.
    • Leaders participate in creating and maintaining guidelines for codifying and tagging business risk priorities.

    Culture

    • Quality is everyone’s concern. Responsibility for attaining high quality software products is shared by everyone on a cross-functional team.
    • Cross-functional team members collaborate for testing. This reduces confrontation and friction between people who find failures and those who fix the code.
    • Dev teams embrace the creation of good tests and analysis of test results.
    • Ops team members contribute to test planning, test creation, test execution and test results analysis.
    • Policies for test creation and test coverage are agreed upon by the cross-functional team including Dev, QA, security and Ops team members.
    • A test architect is a role within the organization. The role has expertise in CT practices and helps cross-functional teams understand and apply them.

    Test Strategy and Plans

    • Test strategies and plans are created for each product or service and reviewed by cross-functional teams including development, QA, Ops and security teams.
    • Test strategies and plans identify the type of tests, and the extent of testing activities, for each stage in the value stream.
    • Test requirements and tasks are included in agile planning procedures for each theme, epic and user story.
    • Test strategies and plans define a test coverage standard, test case standards, and input/output criterion for each pipeline gate.
    • Test plans identify the test cases and all the supporting requirements to implement and execute the test cases as required satisfying the test strategy and test management goals.
    • Test strategies and plans identify the approach for system and acceptance testing.
    • Test strategies and plans identify any tests that are to be conducted in production.
    • Test strategies and plans identify any tests that are to be conducted for security testing.
    • Test strategies and plans identify a target for test automation and manual testing for each type of testing. For example, 100% of all tests in the integration stage and 85% of test in the pre-production stage is a typical goal.
    • The test strategy requires that changes to a database or changes to an application that uses a database have tests defined for the database and the application use of the database.

    Test Management

    • All aspects of test management, such as test planning, test guidelines, test code version management and version management of test results are handled by tools that are well-integrated into the continuous delivery pipeline and any test framework being used for test automation.
    • Schedules for all test tasks are identified and tracked.
    • New features have a scheduled task to ensure test goals are met for each new feature.
    • Each test case has associated attributes that can be used to find tests according to the attributes. For example, an attribute could be type of test and the feature purpose of the test.
    • Test environments and resources needed to satisfy requirements to run each test are identified and available programmatically for scheduling purposes.

    What This Means

    Continuous testing practices are critical to success with DevOps. Many organizations underestimate both the importance and the practices needed to engineer continuous testing. This article is the first in a three-part series that provides a comprehensive list of practices that can be used to understand and assess an organization’s continuous testing capabilities. To learn more about my blueprint for continuous testing, refer to my book Engineering DevOps.

  • SREs Say AIOps Doesn’t Live Up to the Hype

    SREs Say AIOps Doesn’t Live Up to the Hype

    What can you expect when investing in artificial intelligence for IT operations (AIOps)? Real-time visibility across huge volumes of information. Lightning-fast event correlation and anomaly detection. Automated remediation and self-healing, without Ops personnel having to lift a finger.

    It all sounds amazing—at least, if you believe the marketing hype. But do those kinds of AIOps benefits actually translate to the real world? According to a recent survey of nearly 300 site reliability engineers (SREs), not so much.

    Among SREs surveyed—including engineers for some of the world’s largest, most innovative digital companies—just 12% use AIOps as a day-to-day part of their monitoring toolkit. Nearly 40% never use it at all.

    Why aren’t current AIOps solutions living up to the hype? And what can this gap tell us about the state of IT monitoring in general? Let’s take a closer look.

    Sprawling Complexity

    In theory, AIOps should be a perfect fit for SREs. These are, after all, the people with one foot in the world of operations, one in development, whose job is to make distributed software systems ultra-scalable and reliable. A solution that can turn mountains of data about those systems into actionable insights should be exactly what SREs need. And, in fact, 53% of SREs cite lack of unified visibility across the stack as their biggest cloud application monitoring challenge.

    And yet, if we gauge by utilization, today’s AIOps tools don’t seem to be delivering on that promise. Asked about the value of AIOps, just 7.5% of SREs, on average, view AIOps as “high-value”—even less than those SREs (9%) who perceive its value as low.

    Why is AIOps so slow to catch on? Ultimately, the barriers facing these tools are the same as those facing human engineers: massive and growing complexity in IT environments. As digital products become more dependent on third-party cloud services, as the number of things businesses want to track grows (from infrastructure to application to experience), the sheer volume, velocity and variety of monitoring data has exploded.

    Diverse Data Sources

    Compounding the problem, enterprises increasingly rely on multiple “same-service” providers for IT services. That is, they use multiple cloud providers, multiple DNS providers, multiple API providers, etc. There are sound business reasons for doing so, such as adding resiliency and drawing on different vendors’ strengths in different areas. But even when two providers are doing basically the same thing, they use different interfaces and instrumentation, and their data sources often employ different metrics, data structures, and taxonomies.

    Whether you’re asking a human being or an AI-driven tool to solve this problem, this heterogeneity makes it extremely difficult to visualize the complete picture across the infrastructure. It also creates gray areas around how best to take advantage of each vendor’s different rules and toolsets. All of which makes automating anything beyond the most superficial operations tasks hugely challenging, if it’s possible at all.

    Optimizing AIOps

    AIOps really is the solution to this problem—or at least, an important part of the solution. Machine learning is, after all, tailor-made to analyze large volumes of observational and engagement data and react in real-time, as well as to continually identify opportunities for improvement. But before we can get there, we need to change the way we think about AIOps.

    Don’t try to do everything at once.

    It would be great if we could deploy AIOps, let it learn about our environment and watch it magically start remediating issues on its own. But we’re not there yet. (And if a vendor tries to convince you we are, you should definitely be skeptical.) If we break down our expectations into smaller, more manageable chunks, however, AIOps can accomplish quite a lot.

    Event correlation, topology analytics and smart alerting, for example, are all areas where AIOps can provide significant value right now. For these more limited objectives, AIOps can absolutely reduce tedious manual effort for human operators, reduce mean time to repair, improve visibility and more, and digital businesses should be leaning on AIOps to do that.

    Invest in AI and ML training.

    Part of the reason adoption of AIOps tools remains sluggish stems from the fact that many teams still just don’t fully understand how they can use them. The more SREs are exposed to AI/ML training, the more opportunities they will identify for concrete, meaningful applications of AIOps. For example, only 27% of SREs said, “Experimenting or receiving training to expand knowledge or skills” was a major activity as part of their job.

    Embrace “Platform Ops.”

    The biggest step we can take is to rethink how we use AIOps within an organization. Today, AIOps tools—like SRE resources themselves—are often dedicated to a specific digital product or service. As a result, enterprises end up trying to apply their AIOps tools, and the SREs using them, to support everything associated with that product (DNS, API, CDN, cloud monitoring, etc). As IT environments continue to get even more complex, though, businesses will likely find that shifting to shared platform tools and teams yields better results.

    Instead of trying to apply AIOps across every part of a digital service, imagine applying it to one part of that service (for instance, focusing on just DNS, or just APIs). In this way, the AIOps tools, as well as the teams using them, gain in-depth expertise across all the different interfaces and instruments used for that function and get continually better at normalizing multi-provider data sources across them. At that point, this platform-specific AIOps capability can then be scaled and reused across the company—providing more advanced DNS AIOps (or API, or CDN, etc.) for multiple digital products and teams.

    Now, you’ve got an advanced, highly specialized toolset for optimizing an important platform function, regardless of which digital product happens to be using it. You’ve narrowed the scope of how you’re using a given AIOps implementation while going much deeper into that function than a more generic, broad-based implementation could achieve. All of a sudden, even more advanced automation and self-healing becomes possible. And the loftiest marketing claims of AIOps start to look less like hype and more like viable real-world outcomes for your business.

  • Hasura Extends Scope of GraphQL API Platform

    Hasura Extends Scope of GraphQL API Platform

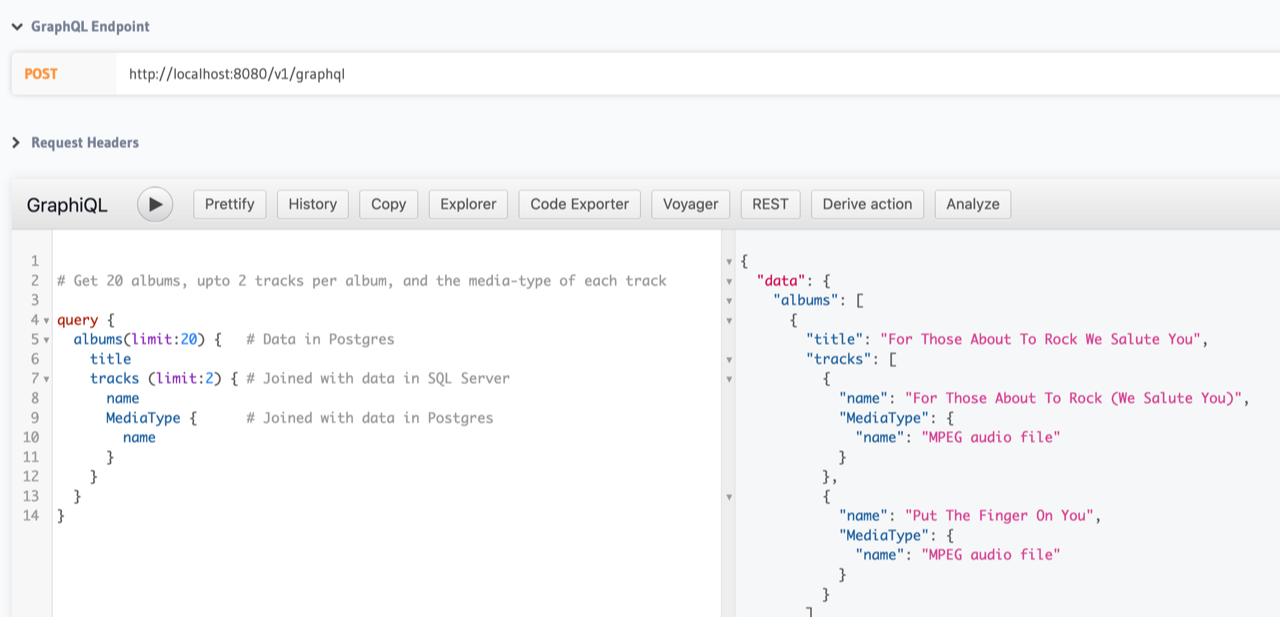
    During its online an HasuraCon ’21 conference, Hasura today announced that it has made it possible for developers to employ GraphQL application programming interface (APIs) to launch queries against data residing in multiple databases.

    At the same time, Hasura announced a preview of schema sharing capabilities along with support for workflows based on GitOps processes that it will make generally available later this year. The Hasura Cloud platform can now deploy local migrations from staging to production with a simple git push in addition to accessing previews of applications on every pull request to the git repository.

    The schema sharing capability added to the Hasura GraphQL Engine is intended to bridge the gap between beginner and power users by allowing them to share and install samples of permissions, relationships and metadata. In addition to improving collaboration, the goal is to make it easier to onboard software engineers as projects evolve and become more complex.

    Originally developed by Facebook, GraphQL has emerged as a popular alternative to REST APIs because it enables developers to retrieve data at a more granular level, which results in improved performance.

    Hasura is a provider of an instance of a GraphQL engine the company has developed around a project that is now hosted by the GraphQL Foundation, an arm of the Linux Foundation. The GraphQL Foundation counts among its members Airbnb, Amazon Web Services (AWS), Apollo, Coursera, Elementl, Facebook, GitHub, IBM, Intuit Hasura, Paypal, Prisma, Shopify and Twitter.

    GraphQL provides a complete description of the data made available via an API and is organized in terms of types and fields rather than traditional endpoints. In addition to clarifying what data is available via that API, developers can employ types to avoid writing manual parsing code.

    Since last summer, Hasura has been making available a pilot of a GraphQL implementation that is capable of supporting remote joins across disparate databases. That capability is critical because data sets that are related to a specific business process may wind up being stored in multiple databases.

    Hasura

    Tanmai Gopal, Hasura CEO, said the open source Hasura GraphQL Engine has already been downloaded more than 250 million times this year. Downloads in 2020 reached 100 million. The challenge is that while GraphQL offers a superior alternative to REST APIs, most of the API tooling that exists within organizations is still designed around REST APIs, noted Gopal.

    To accommodate that reality, Hasura has made a tool available that will convert a query designed using GraphQL into a set of calls that are compatible with REST APIs. Developers still gain the benefits of being able to launch more granular queries, noted Gopal.

    REST APIs, in general, are becoming more problematic as organizations embrace microservices-based applications. It often takes minutes to refresh a simple dashboard because of the amount of data that REST APIs are trying to pull from various data sources. As organizations embrace digital business transformation, they are also encountering application latency issues that can be traced back to the amount of data being called from multiple microservices.

    Hasura says in addition to providing a more efficient method to access data, Hasura is also working on adding caching capabilities to its core engine to further improve performance.

    It’s not clear at what rate GraphQL might replace REST APIs, but DevOps teams should assume organizations will wind up employing a mix of both for years to come. The challenge is going to be determining when to make the transition as organizations become more dependent on APIs.

  • GitLab Updates Approach to Integrating DevOps Workflows

    GitLab Updates Approach to Integrating DevOps Workflows

    GitLab today took the wraps off a major update to its continuous integration/continuous delivery (CI/CD) platform that embeds analytics tools in workflows to identify the root cause of inefficiencies, among other additional capabilities.

    David DeSanto, senior director for product management at GitLab, said that capability is part of an ongoing effort to include value stream analytics within the core GitLab 14 platform as an alternative to acquiring and deploying a separate platform. There are also additional charts and dashboards that enable DevOps teams to uncover bottlenecks over time.

    In addition, GitLab announced it is extending the security capabilities of the platform by adding integrations with open source Semgrep and Trivy vulnerability scanning tools as part of an effort to enable organizations to embrace DevSecOps best practices within workflows. GitLab has also added support for the fuzz testing tool it gained via the acquisitions of Fuzzit and Peach Tech to enable DevOps teams to test application security more thoroughly along with making available additional dashboards to track security metrics.

    As part of an effort to enable organizations to better secure their software supply chains, GitLab has also added support for immutable pipeline definitions that can’t be altered without specific levels of permissions being granted. That capability also enables DevOps teams to more easily achieve compliance with any number of regulatory frameworks, noted DeSanto.

    The company is also adding a pipeline editor that provides access to a visual tool for creating, managing and visualizing pipelines. That tool is designed to both make DevOps more accessible to novices and provide experienced DevOps teams with an alternative tool for managing pipelines in a way that doesn’t require them to write additional code.

    Finally, as part of its comprehensive approach to DevOps, GitLab is also making available agent software for Kubernetes clusters to eliminate the need for organizations to acquire a separate DevOps platform to build and deploy cloud-native applications based on microservices constructed using containers. The company now provides IT organizations with the option of crafting a GitOps workflow for Kubernetes using either an agentless or agent-based approach.

    Gitlab is betting that, as DevOps continues to evolve and mature, more organizations will prefer to replace the various tools they need to integrate themselves with a platform that lowers the total cost of DevOps. Gartner is forecasting that, by 2023, 40% of organizations will have switched from multiple point solutions to a DevOps value stream delivery platform to streamline application delivery, versus less than 10% using such a platform in 2020. Today, only 10% of organizations are employing such a platform, according to Gartner.

    There should also be many more organizations employing DevOps workflows to build applications. Organizations of all sizes now realize how dependent they are on software to drive a wide range of digital business transformation initiatives. The rate at which that software can now be securely developed and updated, in many cases, goes to the heart of their ability to compete. The issue is finding a way to achieve that goal without constructing a platform that ultimately takes time and resources away from building secure software.

  • How Containers Simplify DevOps Workflows and CI/CD Pipelines

    How Containers Simplify DevOps Workflows and CI/CD Pipelines

    DevOps enables organizations to capitalize on the flexibility of cloud resources in real-time, which is a huge game changer. Just as the adoption of Agile methodology can make a development team more responsive, DevOps revolutionizes implementation of IT objectives from end to end, from a waterfall-style process gating company productivity to a dynamic process that makes better-quality software fast and easy.

    Organizations have been taking advantage of increasingly flexible resources and moving away from conveyor belt-style project delivery with hardware and software resource planning, ordering and integration. DevOps provides a way to address the question, “If we can provision resources quickly and easily, how can we complete entire projects with similar responsiveness?”

    As DevOps lowers the wall between development and operations, staying sane and accountable doesn’t have to bog down processes. Structured communication still takes place, but in an iterative, incremental fashion, much like polishing a jewel.

    Instead of lofty goals set in the somewhat-distant future, practical solutions can be created, deployed and adjusted. The process gets applications in the hands of end users far sooner, smooths any rough edges using actual user feedback, and helps organizations not only become more responsive to changing needs but make much more efficient use of valuable software development and operations resources.

    Why Dev and Ops Teams Need to Collaborate

    It can be hard for an organization’s culture to adapt to this level of change. But both development and operations teams have some pain points that help motivate them to work together more dynamically.

    The development (Dev) side of the house wants to deliver more timely solutions, ensure greater acceptance of new applications and use its resources more efficiently. Operations (Ops) has challenges with hardware resource planning; they have maintenance and cost-reduction projects that are delayed. Ops also has insights into new features, efficiencies and integrations, but with no way to implement them.

    These and other pain points arise when traditional, waterfall-style processes constrain communication and implementation. Creating a new flow between the two teams helps to reduce these pain points.

    Rather than being tied to a specific technology, DevOps is a methodology aimed at making software development efficient. Containerization narrows the gap between development and IT Ops to a minimum. Containers are a great tool for enabling DevOps workflows and simplifying the development and delivery pipelines. Containers hold the code and dependencies required to run an application and reside in isolation. This enables teams to develop, test and deploy apps inside these closed environments. And this doesn’t affect different parts of the delivery, making the lives of testers and developers a lot easier.

    Enabling CI/CD

    DevOps has created a way to automate processes to build, test and code faster and more reliably. Continuous integration/continuous delivery (CI/CD) isn’t a novel concept, but tools like Jenkins have done much to define what a CI/CD pipeline should look like. While DevOps represents a cultural change in the organization, CI/CD is the core engine that drives the success of DevOps.

    With CI, teams must implement smaller changes more often, but they check the code with the version control repositories. Therefore, there is a lot more consistency in the building, packing and testing of apps, leading to better collaboration and software quality. CD begins where CI ends. Since teams work on several environments (prod, dev, test, etc.), the role of CD is to automate code deployment to these environments and execute service calls to databases and servers.

    The CI/CD concept isn’t entirely new, but it’s only now that we have the right tools to fully reap the benefits of CI/CD. Containers make it extremely easy to implement a CI/CD pipeline and enable a much more collaborative culture. Containers are very lightweight and can scale endlessly, run on any environment and are very flexible. It doesn’t get easier than this.

    Now, you can move code across containers–or container clusters, as is the case with Kubernetes–instead of moving code among various virtual machines (VMs) in different environments. VMs are static and leverage a monolithic application architecture, whereas containers use a distributed microservices model. This opens doors to new benefits when it comes to elasticity, high availability and resource use.

    As part of a DevOps team-oriented approach, team members can reach out to their peers and share innovation, feeding their knowledge and experiences into the evolving process. Development teams can put the new resources to use, taking advantages of technologies such as containers and Kubernetes to architect solutions. Working together, this cooperation lets Ops run with the solution, scale it, distribute and upgrade efficiently without delay.

    Putting it All Together

    DevOps has helped organizations reimagine their entire development lifecycle. And while DevOps brings cultural change, CI/CD is the core engine that makes DevOps successful. New tools like containers now make it easier for organizations to make the most of CI/CD. However, data storage must be taken into consideration, because it undergirds a dynamic DevOps environment. It also provides failover, disaster recovery and other essential availability and reliability features. Software-defined storage offers the flexibility that a dynamic DevOps environment needs. It’s a crucial element in the success of your DevOps program.

  • Linux Foundation Makes Available Software Manifest Tool

    Linux Foundation Makes Available Software Manifest Tool

    The Linux Foundation is making available a set of free tools for building software bills of material (SBOMs) based on the software data package exchange (SPDX) file format it curates.

    Backed by more than 20 organizations, SPDX is an effort to standardize the way metadata describing the contents of a software package is described.

    The SPDX specification was submitted last fall to the International Organization for Standardization (ISO) by the Joint Development Foundation, an arm of the Linux Foundation.

    The Linux Foundation, as part of its efforts, is also making available a free, online training course to provide IT teams with the foundational knowledge required to create and maintain SBOMs.

    Kate Stewart, vice president of dependable embedded systems for the Linux Foundation, said SBOMs play a critical, often overlooked role in maintaining the security of a software supply chain. One of the major challenges organizations have today is that an SBOM isn’t often created, which makes it harder to discover what software components have been included in a package. That makes it difficult for organizations to determine if they are employing a version of a software component that now has a critical vulnerability that was just recently reported, noted Stewart.

    Even when there is a SBOM, its construction can vary from one team or organization to the next. The tools provided by the Linux Foundation are intended to standardize how the fields used to describe a SBOM are defined, added Stewart.

    The SBOM tools being advanced by the Linux Foundation are, in part, a response to President Biden’s executive order pertaining to the security of software supply chains, added Stewart. The National Telecommunications and Information Administration (NTIA), as a result, is now asking for wide-ranging feedback to define the minimum requirements for a SBOM.

    It may take time before there is an agreed upon SBOM standard, but as microservices based on containers become more prevalent, it’s also apparent the issue will become more pressing. More, smaller packages of software being deployed in the enterprise without manifests will only further exacerbate an application security crisis that has deepened in the wake of recent high-profile software supply chain breaches.

    Ultimately, a SBOM should automatically be self-generated as part of any DevOps workflow. The challenge is there is still a massive amount of software being created outside of any formal DevOps workflow. On top of that, the massive amount of poorly documented legacy application software already deployed in an enterprise IT environment makes it clear how big an issue the lack of a simple SBOM really is.

    It’s not precisely clear who inside an organization should be responsible for standardizing SBOMs. The challenge is that within many organizations it’s not the kind of issue for which developers are rewarded, much less motivated, to solve. Nevertheless, everything from application security issues to the massive amount of technical debt that stems from duplication of software development projects can all be traced back to the lack of a simple manifest.

    Of course, now that many organizations are starting to appreciate just how dependent they are on software, more questions are being asked about how it’s constructed. The thing that many of the business executives asking those questions are about to discover (with some incredulity) is how much of the software the organizations depend on is still being built using methods that have more to do with a medieval craft than they do a manufacturing line.

  • Code Ownership Is Key to Accelerate Debugging

    Code Ownership Is Key to Accelerate Debugging

    App stability is a fundamental part of every app experience. Broadly speaking, app stability is a measurement of the number of total app sessions that are crash-free or the percentage of daily active users who do not experience an error. End users have little patience for apps that crash or fail. Every application, whether it’s B2B- or B2C-oriented, suffers some level of instability and fails occasionally. Ideally, organizations should aim for app stability scores close to 99.999%. To achieve that quality of performance, software engineers must be fast and efficient in fixing coding errors that are frequently the cause of app crashes.

    But that’s a major challenge using the traditional approach to debugging. Most major applications have a wide variety of engineers, including completely separate engineering teams, all working from a single code base. Each team typically uses their own unique issue tracker to monitor errors, such as Jira or Asana. In addition, teams typically use their own channel in a collaboration platform to communicate internally, like Slack or Microsoft Teams. This causes silos between the various engineering teams, limiting communication and visibility between each team.

    When an error occurs, all the engineering teams are alerted about the bug through their own issue trackers. From there, they figure out where the error occurred in the code and who is specifically responsible for fixing it. This requires each team to manually review code as they try to locate the bug, which wastes precious time as engineers duplicate one another’s efforts. Because teams are using different communication channels, there’s little to no collaboration or alignment between the various engineering teams during this process. Overall, this approach to debugging is a cumbersome and inefficient undertaking that slows the process of repairing apps, ultimately hurting the end user experience.

    Consider a real-world example. Suppose your team is one of a dozen engineering teams, all working together on an application that creates a mobile game. Perhaps your team works on maintaining the in-app purchases feature set, while another works on the account setup flow and yet another team works on character customization features. If a bug suddenly crashes the app for a significant portion of users (resulting in a clear drop in the app stability score), every team will receive an error alert through their issue tracker notifying them that a coding issue has caused the application to fail. No one will know if their team’s code was responsible. As a result, each team is forced to go through the laborious process outlined above. If it turns out that the bug was in the character customization code, then the teams responsible for in-app purchases and account setup have wasted valuable time and resources searching for the error.

    The only team that should be notified of a bug is the one responsible for the part of the code a bug originates from. The emerging concept of code ownership makes this possible, providing a faster and easier approach to debugging. With this method, organizations create code owner files to determine which engineers or teams are responsible for each section of code, feature flags or experiments. If section X within the code fails, then team X will be responsible for addressing it. In the example above, only the team responsible for the code associated with character customization would need to find and fix the bug.

    This makes it much easier to respond to application issues and allocate the correct resources to remedy those issues. For end users, code ownership means that malfunctioning apps will be fixed faster, improving the customer experience and boosting business metrics. From an internal POV, engineering teams become far more cost- and time-efficient, freeing developers to take on new projects they actually enjoy working on.

    A culture of code ownership also helps engineering teams adopt other best practices for debugging. One major example is error prioritization. Not all bugs cause significant app instability and need to be fixed right away. When a team can ignore errors unrelated to their code, they have more time to fully hone in on and evaluate the errors they are responsible for. With this focused approach, they can establish metrics determining if they need to fix a bug immediately or if it can wait.

    Simply put, code ownership eliminates the confusion and guesswork associated with the process of debugging, allowing engineering teams to easily identify, own, prioritize and remedy bugs. Embracing code ownership is critical for companies to improve app stability, which is the most fundamental measure of an app’s health. This ties directly into business outcomes, because app stability is closely associated with customer retention, customer growth, sales and revenue. By speeding up debugging efforts, code ownership has a pronounced, positive impact on stability, boosting each of those metrics.

  • Automatic Right-Sizing is Magical Thinking

    Automatic Right-Sizing is Magical Thinking

    Some months ago, AWS evangelist Corey Quinn wrote a short blog post titled “Right Sizing Your Instances Is Nonsense.” As usual, Corey was spot-on in his takedown of cost-reduction-magic-AI industry hype. But his piece only scratches the surface. I would take the argument a step farther and say that anyone who tells you they can automatically and generally “right-size” compute instances simply doesn’t understand how software works.

    Does that strike you as overly aggressive? Stay with me. Even if you don’t wind up agreeing, there’s a lot to be learned about AIOps from a discussion of “automatic instance right-sizing.”

    What is Right-Sizing?

    Quoting directly from the website of one of the many services that claim to provide “right-sizing” for cloud instances:

    “The Recommendations Engine leverages the time series data of relevant utilization metrics for your resources, then creates a statistical model around average and peak utilization periods. The tool leverages historical utilization data to identify performance characteristics across instance types, families and zones to provide valid recommendations for your workload.”

    The idea behind this “right-sizing” is quite simple, really: track a bunch of cloud service metrics (and maybe a bunch of OS metrics, too, if they are available), use some statistical model—commonly called “AI” on VC decks—and magically deliver recommendations for a more cost-effective cloud instance type.

    There’s just one problem: creating a useful statistical model from generic metrics is practically impossible unless your software is purpose-built to support it, and that is never a software design goal. In fact, software is almost always built in a way that is completely contrary to this goal, and for very good reasons. To understand why, let’s go over the assumptions behind “right-sizing”:

    1. The software will be able to use all given resources
    2. Performance will improve (or degrade) predictably and uniformly with added resources
    3. Metrics accurately describe application load
    4. Scaling dimensions are independent
    5. There will be no side effects on connected systems

    It turns out, none of these assumptions behind right-sizing are generally true.

    A Crash Course in Software Scaling

    In theory, software is bottlenecked on resources, be they CPU, disk, RAM, network, what have you. In practice, however, it is extremely difficult to build software that can fully utilize resources.

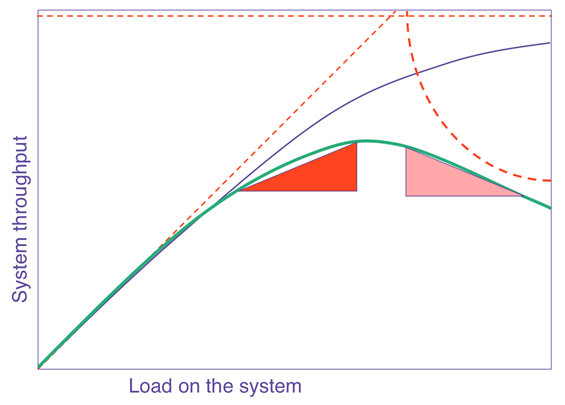
    The general curve that describes how software scales with resources or load is known as the Universal Scalability Law (USL). In a nutshell, it says that on any chart showing scale versus performance, you will see a region of linear scaling where adding resources (say, CPU cores) proportionally increases performance; however, you will then see where performance continues to increase on a nonlinear basis, with smaller and smaller gains with every additional resource until, at some point, the benefit is so marginal as to be completely negligible. This is known as Amdahl’s law, which states that the performance of every program is limited by the serial part.

    Beyond Amdahl lies the issue of retrograde scaling, the existence of which people often forget about until the consequences hit them smack in the face. In this issue, adding resources actually slows down the system. That’s right. From this point onward, larger servers will make your software slower.

    The reason this happens is that, to scale linearly, the workload and resources must be completely isolated and decoupled from each other, which isn’t realistically possible. There are always shared components, e.g. the kernel scheduler, the memory controller, the main PCI bus, perhaps the algorithm requires locking. In any case, the net result is queueing on the shared resource, which might also become a bottleneck when overloaded. Think of a supermarket checkout: you can admit more and more shoppers into the store, but they will still end up waiting at the checkout, eventually, no matter how many registers you open and staff. Performance is limited by the number of checkout counters, not by the number of shoppers or clerks. Worse yet, if the queue gets out of control (maybe people got tired of waiting and shopping carts are literally abandoned in front of remaining shoppers, blocking the path to checkout — think of this as the contention of retries and timeouts), the throughput of checkout will decrease as counters are starved for shoppers.
    right-sizing

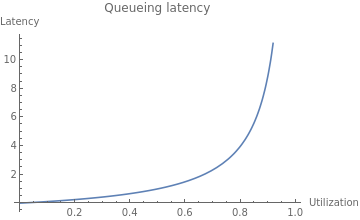
    The USL shows us what happens to throughput as we scale, but what about latency?
    right-sizing

    As resource utilization approaches 100%, the wait time for the resource will approach infinity in a nonlinear fashion. This is why systems are designed to run at low utilization, so that quality of service does not degrade too much. You might see a server running at 50% utilization and think, “We can use a server with half the resources and save money!” but if you actually try to do that, you will degrade latency and quality of service to an unacceptable level, most likely causing an outage.

    The Dark Arts of Configuration

    Even if your software is able to take advantage of available resources in theory, it needs to be properly configured to use them. Buffer sizes, thread pool sizes, memory heap size, number of connections—most software has numerous options to tune it for resources and specific workload. You can’t just change the box size and expect it to work! Not to mention, it’s quite possible your current configuration is far from optimal. I’ve substantially reduced cluster sizes on several occasions by making a one-line configuration change.

    For example, a common web server configuration is the number of concurrent requests the server can handle (often expressed as number of threads), which relates to the number of CPU cores available, the amount of memory available to the specific workload and the average time it takes to handle a request. The problem you are solving isn’t “What instance size will have the best ROI?” but rather “What combination of instance size and configuration will have the best ROI?” That is a totally different question that requires specific knowledge of the application to answer.

    Let Them Eat Cache

    In the old days, when you tried to allocate memory beyond what was currently available, the operating system would simply refuse your request. Ah, the good old days were simple! Alas, in our quest to simplify programming and resource management, and to allow software to efficiently adapt to a changing environment, we made common use of resource tradeoffs. For example, a complicated computation can be calculated again and again using the CPU, or the results can be saved and reused, saving CPU time and trading it for the use of RAM or disk. This pattern is quite common; when you overallocate memory, the operating system may trade off CPU to free memory by compressing memory objects, or it may trade off disk space by paging out RAM to swap. Java, Node.js and Go each have a similar tradeoff where they spend CPU time on garbage collecting to free RAM. Modern software makes numerous tradeoffs between CPU, RAM, disk and network in multiple dimensions. The end result is that different resources are coupled in many unexpected and obscure ways.

    Lies, Damned Lies! (And Metrics)

    Speaking of that server running at 50% CPU utilization, it is quite possible that server is also maxed out on CPU at the same time. How can this be? It’s because the metrics you see are not raw data but aggregates—in many cases, averages—and aggregates hide certain behaviors that can be very important; for example, peaks and bursts, such as the ones you get from compaction, garbage collection and other periodic processes that routinely run in modern software. There are billions of events happening every second on a modern server, and only a few data points of metrics emitted every minute. All metrics are loss-y; it’s simple math, really. But machine learning (ML) models are only as good as the data they work on, so if the metrics weren’t specifically created to show the relevant behaviors—and they weren’t—the model would be completely blind to their existence.

    What is “Performance,” Exactly?

    Whenever we deal with resource allocation, we are interested in its impact on performance, which raises the obvious yet rather uncomfortable question: what’s your definition of “performance?” Is it throughput? Latency? Mean or the 99th percentile? Of which transaction? Or, perhaps you are mostly interested in the rate of purchases executed on the website? These are all different things, and often, optimizing one might degrade the others.

    This kind of discussion is the first step in any performance engineering session—but completely absent from the scope of “right-sizing” services, and the last thing you want is the generic cost function of the ML model costing you money.

    This wouldn’t be so bad if all performance goals could be achieved at once, but, sadly, some of them are in opposition: e.g., higher throughput causes higher latency due to queueing effects. When making changes to software systems, we have to know what performance metrics are important to us.

    The Curse of Local Optimization

    It is very tempting to look at a cluster of machines as an independent system. But if that system is doing something meaningful, it is part of some bigger system, and changing the configuration will likely have an effect on the larger system it is a part of. When we make changes to subsystems, it is with the intent of improving the system as a whole, to make the customer happy and make more money. But when a change to a subsystem is motivated by a desire to reduce the cost of the subsystem, the result is often an increase in the overall cost of the system! This is because the local cost of subsystems is relatively small compared to the cost of the entire system, not to mention the possible reduction in the income of the system. For example, you could save lots of money by using older, slower servers, but your customers won’t be very happy with a slow application and your profits will suffer—which will probably cost you much more than whatever you saved.

    To take this ad absurdum, you could save 100% of the subsystem cost by turning it off completely. Of course, the assumption is that changing server sizes will not have any side effects, which, as discussed, is highly unlikely. There will be side effects on connected systems as well, some of which will not appear immediately. Load is variant, and operational overprovisioning and buffers were often put in place for a reason. It’s quite likely the reason for low utilization is safety margins.

    The Problem With “Right-Sizing”

    The basic problem with “right-sizing” is the rather obvious, yet implicit, assumption that there is such a thing as “the right” size. Software engineering is all about tradeoffs, precisely because it’s very rare (if it happens at all) that one thing can be improved without making another thing worse. Tradeoffs mean business decisions to make, and you really don’t want a generic ML heuristic to make those for you. ML is very good at dealing with problems where a lot of data is available, the data is high quality, the data is predictive of behaviors (which isn’t the case for complex systems!) and most important, the problem is well defined. Most problems in AIOps are very far from this. Don’t take it from me, take it from the people who excel at both high-scale ops and ML.

    Even if it was feasible to make such ML models work, software is unable to automatically adapt to different machine sizes and fully utilize server resources. If it were, companies like ScyllaDB and Azul Systems wouldn’t need to exist. Creating software that is scalable and resource-efficient on modern hardware is a very difficult problem, and without those building blocks, ML models are constructing very shaky structures.

    It’s worth emphasizing that I’m not arguing against adapting the size and configuration of servers, only that doing so automatically and blindly for some local “cost-saving” goal isn’t the solution you might think. The goal of such changes should be to raise the overall quality and performance of the larger system guided by a theory of how that system works. ML is not a replacement for human thought and learning. There might certainly be an “optimal” instance type, or even a few, but “optimal” implies a target metric that certainly isn’t cost reduction. No system exists for the sole purpose of being inexpensive. All systems exist to serve business requirements first, and to be low-cost second.