Category: DevOps Practice

  • DevOps/Cloud-Native Live Boston: Get Certified, Network and Grow Your Career

    DevOps/Cloud-Native Live Boston: Get Certified, Network and Grow Your Career

    DevOps and cloud-native technologies are changing the application development landscape, accelerating the pace of innovation and transforming the way organizations develop, deploy and employ modern software. The DevOps/Cloud-Native Live! event is coming to Boston on May 25 to provide attendees with all the knowledge and tools they need to succeed in the world of DevOps and cloud-native computing.

    This in-person event will bring together DevOps luminaries and cloud-native experts to discuss some of the hottest topics in the industry today, share valuable insights and offer hands-on training to all attendees to help them future-proof their careers and stay ahead of the competition.

    DevOps/Cloud-Native Live! Boston features a stellar lineup of speakers, including:

    • Tracy Bannon, software architect and DevOps advisor at Mitre Corporation
    • Andi Mann, CTO at Qumu
    • Joshua Corman, former chief strategist, CISA COVID-19 task force and founder of I am the Cavalry
    • Elizabeth Lawler, founder and CEO at AppLand
    • David Owczarek, former SRE manager at Adobe Sign
    • Daniel (Dan) Kirsch, managing director and principal analyst at Techstrong Research

    At the conference, attendees will have the opportunity to meet these leaders and speakers, exchange ideas and information with like-minded peers, attend educational sessions and get certified by completing upskilling sessions. These upskilling sessions are designed to help both new and seasoned engineers hone their skills, adapt for future growth and improve operational efficiency.

    Joshua Mazgelis, cloud architect and senior sales engineer at Progress will be conducting a hands-on training session on “Cloud Agility with Chef.” In this session, attendees will learn how they can improve cloud security and compliance without sacrificing agility and how to use Chef software to detect, correct and automate remediation of security vulnerabilities across the infrastructure.

    Check out our interview with Joshua Mazgelis below for a sneak peek of what to expect from the “Cloud Agility with Chef” upskilling session.

    [videopress oyeKYTnR]

    The agenda for DevOps/Cloud-Native Live! Boston features a mix of topics, including technical sessions, lively discussions and case studies covering digital transformation, DevOps principles, Kubernetes, cloud-native tools, DevSecOps, API security, monitoring and observability, ITIL v4 and more.

    There will also be two amazing onsite giveaways:

    • Attendees will have a chance to win a pair of tickets to a Red Sox versus Yankees game (Terms and conditions apply).
    • Attendees will get a chance to snag free tickets to a pre-release private viewing of “Top Gun: Maverick” (First come, first served).

    By visiting the expo hall, attendees will also be able to interact with sponsors and receive valuable content. Breakfast, lunch and coffee will be offered to all attendees as well.

    To see the full agenda and to register, please visit the DevOps/Cloud-Native Live! Boston website.
  • GitLab Gets an Overhaul

    GitLab Gets an Overhaul

    GitLab launched its next major iteration, GitLab 15, starting with its first release version, 15.0, which the company said pulls together new DevOps and data science capabilities into the platform. With GitLab 15, GitLab says it provides (or soon will provide) continuous security and compliance, enterprise Agile planning, visibility and observability, workflow automation and increased support for data science workloads.

    In an interview with DevOps.com, Hillary Benson, director of product management, detailed how GitLab 15 provides several security benefits, including the ability to automatically create an exportable software bill of materials (SBOM) and signed attestation for build artifacts, centralized security policy management including a two-step exception approval process, as well as providing compliance managers the ability to see project history changes and better enforce policy. “Supply chain security, especially, has become a major area of focus for us, both because it’s become a high priority in the industry and because GitLab is uniquely positioned to support customers well in this area,” Benson said.

    GitLab 15 also provides improved static application security testing (SAST) with stronger and more flexible rules and finding management, Benson said. Finally, users can pool together GitLab project data to create custom automations.

    According to Benson, GitLab 15 will also introduce more capabilities that interlink data across every stage of the DevOps life cycle from initial planning, implementation, deployment and monitoring. “Some of the things that will happen in this area are additional options for the types of work items that can be managed,” said Benson. That includes supporting a more diverse range of workflows and frameworks—including enterprise Agile frameworks. The platform will continue to support issues, epics and requirements and soon enable tasks, features and objectives.

    GitLab 15 provides new capabilities the company hopes will increase visibility and enable an end-to-end view of value delivery and application health, the company said. The unified collaborative context will help remove DevOps silos within organizations and decrease incident rates as well as provide comprehensive insights into issues that hinder performance in addition to real-time triaging of incidents. These new capabilities can help shorten lead times from code to production, reduce error frequency and severity, help development teams deploy more frequently and reduce mean-time-to-recover (MTTR) after an incident.

    Upcoming features include improved product analytics and experimentation, such as increasing the practicality of surfaced data by enabling testing and validating new ideas and measuring the adoption of DevOps best practices across teams and projects, Benson said. Expanded support for all DevOps research and assessment (DORA) metrics including improvements to value stream analytics for projects and groups is also addressed. “This is about making it easier to understand what value your product is bringing,” said Benson. “We’re introducing product analytics and experimentation to increase the practicality of the data that you’re using and the data you’re collecting to actually move your product forward,” says Benson.

    Finally, GitLab 15 will increase support for data science teams and their workloads. “This is about streamlining the development and deployment of machine learning models to train and test those and then get them into production. We’ll also be working on providing monitoring for those workloads so that it can be understood if those models are being used, how they’re being used and where there may be performance issues,” said Benson.

  • Datadog Adds Support for OpenTelemetry Protocol

    Datadog Adds Support for OpenTelemetry Protocol

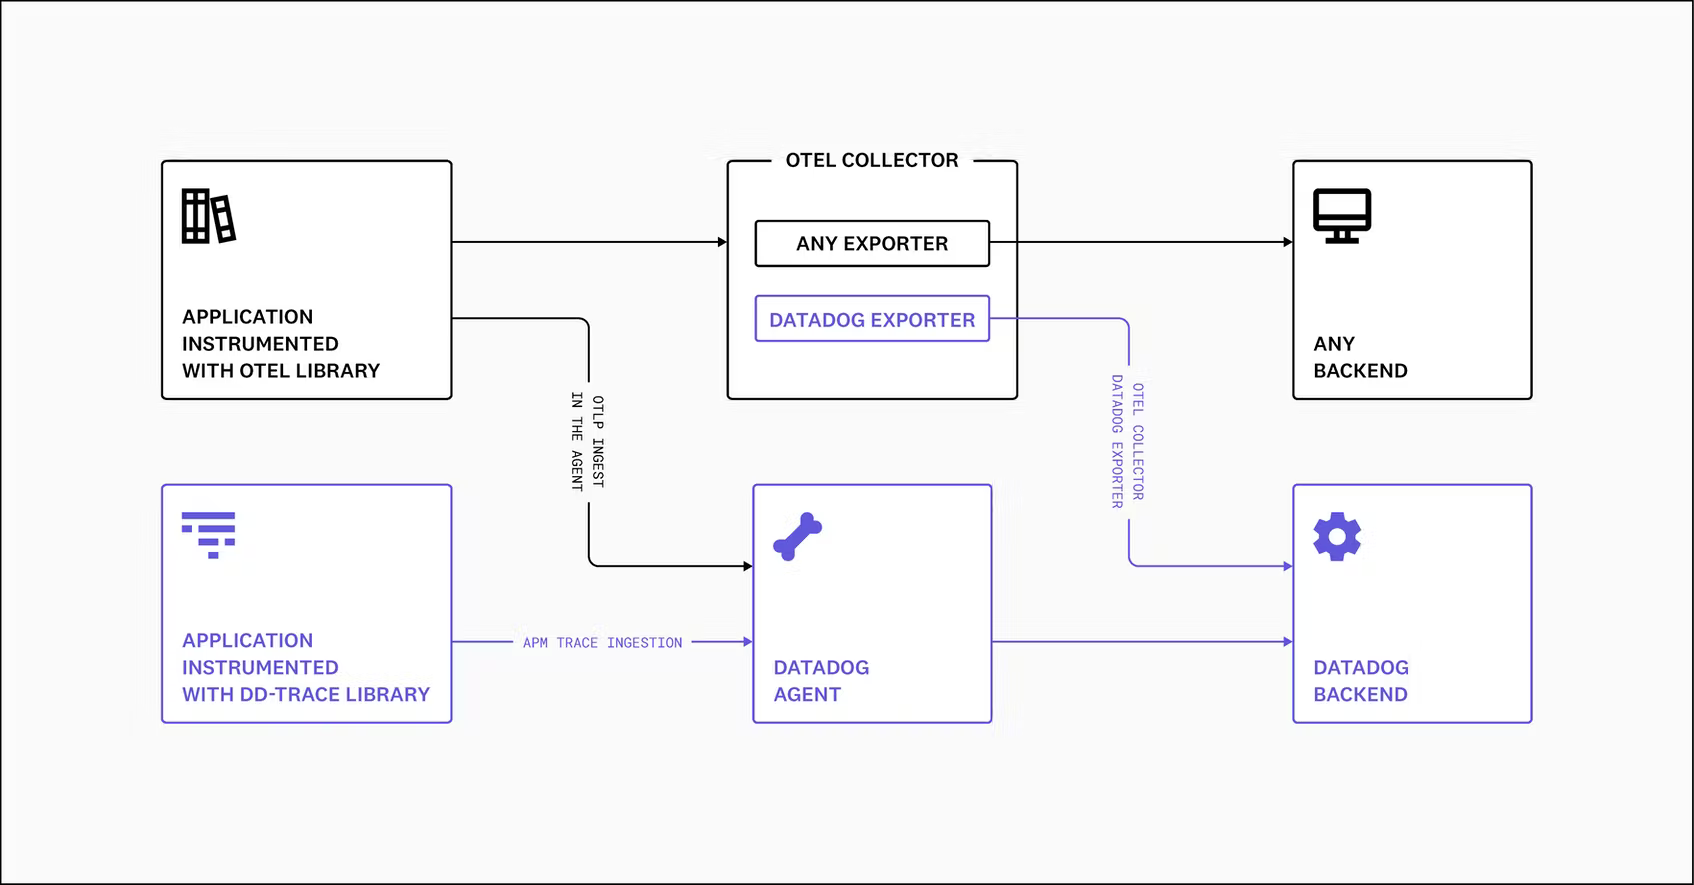
    At the KubeCon + CloudNativeCon Europe 2022 event, Datadog announced it made support for the OpenTelemetry Protocol (OTLP) generally available in the agent software it provides to instrument applications.

    Ilan Rabinovitch, senior vice president of product and community at Datadog, said that capability eliminates the need to install a separate OpenTelemetry collector to aggregate metrics, logs and traces from applications instrumented using the open source OpenTelemetry libraries being advanced under the auspices of the Cloud Native Computing Foundation (CNCF).

    The Datadog Agent can already collect application profiles, network data and infrastructure metrics via more than 500 integrations provided by Datadog. OpenTelemetry extends that capability with a set of application programming interfaces (APIs) and a wire protocol for instrumenting applications.

    Datadog is the latest in a series of providers of observability platforms that added support for the OpenTelemetry project that continues to gain momentum. The goal is to make it less costly to instrument applications using open source agent software that surfaces a consistent set of interfaces. Previously, each observability platform provider developed their own agent software that DevOps teams would need to install. Datadog is making a case for agent software that, in addition to collecting data from existing applications, is now compatible with the OLTP protocol created by contributors to the OpenTelemetry project.

    The issue that DevOps teams will need to come to terms with is that while OpenTelemetry agent software is free, many of them have already installed proprietary agent software to instrument applications. That agent software can often provide additional context that is not yet available in OpenTelemetry. History, however, shows that, in time, open source projects with larger numbers of contributors will outpace the ability of any single vendor to innovate.

    One way or another, DevOps teams will be instrumenting more applications as more microservices-based applications are deployed. The dependencies that exist between microservices make it too difficult to manage an application environment without additional instrumentation. The goal within many DevOps teams is to eventually replace the hodgepodge of monitoring tools that track a limited set of pre-defined metrics with an observability platform that not only aggregates metrics but enables DevOps teams to launch queries and surface IT issues before they become a major issue. In some instances, the rationalization of monitoring tools will help justify the acquisition of an observability platform.

    Observability, of course, is one of the core tenets of any set of DevOps best practices. Achieving it, however, has always been a challenge. Rabinovitch said an observability platform that regularly surfaces critical IT issues without requiring DevOps teams to launch queries to search for anomalies will eventually win the battle for observability supremacy.

    In the meantime, there is already no shortage of observability platforms. The challenge will be determining which one enables the highest level of instrumentation at the most reasonable cost.

  • Continuous Delivery Foundation Adds Interoperability Project

    Continuous Delivery Foundation Adds Interoperability Project

    At a CDEventscon event this week, the Continuous Delivery Foundation (CDF) announced it is hosting a CDEvents project through which it hopes to create a vendor-neutral specification for defining the format of event data across multiple services, platforms and systems.

    Andrea Frittoli, open source developer advocate at IBM, co-creator of the CDEvents project and member of the CDF technical oversight committee, said the open source consortium is launching this initiative to foster interoperability across continuous delivery (CD) platforms. In the context of the CDF, that mission spans both continuous integration and continuous deployment platforms that are subsets of CD.

    CDEvents itself is based on an existing CloudEvent specification created by the Serverless Working Group within the Cloud Native Computing Foundation (CNCF). As part of the effort, the CDF has already built a proof-of-concept implementation that enables Tekton pipelines and Keptn orchestration tools for managing application life cycles to communicate over a common event protocol.

    Collecting metrics from multiple DevOps platforms is a challenge because there is no standard for sharing event data. Analytics providers and value stream management platforms that collect metrics need to create connectors for each platform they support. CDEvents would provide a standard interface for collecting metrics from any developer tool or platform. That data would also make it easier to visualize workflows that describe artifacts and their metadata, he added.

    That lack of a common way to describe events means developers not only must constantly re-learn how to consume events, it also limits the potential for libraries, tooling and infrastructure to facilitate the delivery of event data across environments ranging from routers and tracing systems to software development kits (SDKs).

    Naturally, it may be a while before this continuous delivery specification results in increased interoperability across DevOps environments, but the need for one across what has become a patchwork of fragmented tools and platforms is self-evident. Many organizations are already investing in an assortment of analytics tools in the hopes of improving the rate at which applications can be developed and deployed. In too many instances, DevOps teams have inadvertently created bottlenecks that slow down the rate of development. The challenge is that, as new tools and platforms are added to a DevOps workflow, they are not likely to be able to share data with those applications until a connector is created.

    Not everyone, of course, is a fan of having more metrics. The goal should be to coach teams on how to become more efficient rather than implementing a set of draconian mandates. Arguably, such mandates are only going to drive away developers that are trying to strike a balance between coding as an art form and application development as a craft.

    Nevertheless, as organizations better appreciate the critical role software plays in driving business processes, the greater the desire to measure the pace and efficacy of their application development efforts—to justify the levels of investment in software development they are making.

  • What SREs Can Learn From the Atlassian Outage of 2022

    What SREs Can Learn From the Atlassian Outage of 2022

    What happens when the tools and services you depend on to drive site reliability engineering turns out to be susceptible to reliability failures of their own? That’s the question teams at about 400 businesses presumably asked themselves in the wake of a major outage in Atlassian Cloud. The incident offers a number of insights for SREs about reliability risks within reliability management software itself—as well as how to work through complex outages efficiently and transparently.

    What Caused the Atlassian Cloud Outage?

    The outage, which began on April 4 and finally resolved April 18, affected about 400 Atlassian Cloud customer accounts. Atlassian Cloud is a hosted suite of popular Atlassian products including Jira and OpsGenie. The outage meant that affected customers could no longer access these tools or the data they managed in them.

    According to Atlassian, the problem was triggered by a faulty application migration process. Engineers wrote a script to deactivate an obsolete version of an application. However, due to what Atlassian called a “communication gap” between teams, the script was written in such a way that it deactivated all Atlassian Cloud products, not just the obsolete application.

    To make matters worse, the script was apparently configured to delete data permanently, rather than mark it for deletion, which was the intention. As a result, data in affected accounts was removed permanently from production environments.

    The Good, the Bad and the Ugly

    The Atlassian Cloud outage may not be the very worst type of incident imaginable—failures like Facebook’s 2021 outage were arguably worse because they affected more people and because service restoration was complicated by physical access issues—but it was still pretty bad. Production data was permanently deleted and hundreds of enterprise customers experienced total service disruptions that have lasted several days and counting.

    Given the seriousness of the incident, it’s tempting to point fingers at Atlassian engineers for letting an incident like this happen in the first place. They seem to have written a script with some serious issues, then presumably deployed it without testing it first—which is exactly the opposite of what you might call an SRE best practice.

    On the other hand, Atlassian deserves credit for responding to the incident efficiently and transparently. Although the company was silent at first, it ultimately shared details about what happened and why even though those details were a bit embarrassing to its engineers.

    Crucially, Atlassian also had backups and failover environments in place, which it used to speed the recovery process. The major reason why the outage lasted so long, the company said, is that restoring data from backups to production requires integrating backup data for individual customers into storage that is shared by multiple customers, a tedious process that Atlassian apparently can’t perform automatically (or doesn’t want to, presumably because it would be too risky to automate).

    Unfortunately for impacted customers, it does not appear that any fallback tools or services were made available while they waited for Atlassian to restore operations. We imagine this poses more than minor issues for teams that rely on tools like Jira to manage projects and OpsGenie to handle incidents. Perhaps those teams stood up alternative tools in the meantime – or perhaps they crossed their fingers, hoping their project and reliability management tools would come back online ASAP. 

    Takeaways for SREs From the Atlassian Outage

    For SREs, then, the key takeaways from this incident would seem to be:

    • Always perform dry runs of migration processes in testing environments before putting them into production. Presumably, if Atlassian engineers had tested their application migration script first, they would have noticed its flaws before it took out live customer environments.
    • Back up, back up, back up—and make sure you have failover environments where you can rebuild failed services based on backups. While this outage is bad, it would be 100 times worse if Atlassian couldn’t restore service based on backups and data had been lost permanently.
    • Ideally, each customer’s data should be stored separately. As we noted above, the fact that Atlassian used shared storage seems to have been a factor in delaying recovery. That said, it’s hard to fault Atlassian too much on this point; it’s not always practical to isolate data for each user due to the cost and administrative complexity of doing so.
    • SRE teams would do well to think about how they’ll respond if their reliability management software itself goes offline. For example, it might be worth extracting and backing up data from your reliability management tools so you can still access it if your tool provider experiences an incident like this.
    • Over-communicate with your customers often and early. In this case, there was initial radio silence that left customers in the dark. Most of this chatter eventually took place in public forums.

    Conclusion

    The Atlassian Cloud outage is notable both for its length and for the fact that, ironically, it took out software that teams use to help prevent these types of issues from happening at their own businesses.

    The good news is that Atlassian had the necessary resources in place to restore service as quickly as possible. A shared data storage architecture led to slow recovery, which is unfortunate; again, it’s hard to blame Atlassian too much for not setting up dedicated storage for each customer.

  • How to Get the Supply Chain Back to (Better than) Normal

    How to Get the Supply Chain Back to (Better than) Normal

    If a chain is only as strong as its weakest link, today’s supply chain is in dire straits. A recent infographic from The New York Times shows all too clearly that the international supply chain is in upheaval, due directly or indirectly to the outbreak of COVID-19. At the same time, reams of data generated along the supply chain are going to waste. The internet of things (IoT) can’t single-handedly fix the supply chain, but IoT technology combined with the cloud, AI and automation has the potential to bring the supply chain (and society) back to something resembling normal—actually, something better than normal.

    Indeed, even during “normal” times, the supply chain was stretched to the limit by the challenge of constantly reducing costs and improving margins, as well as optimizing delivery times for just-in-time (JIT) inventory. With that said, the last two years have been especially grim, with factories, stores and restaurants literally shutting down for lack of materials. Then there’s the computer chip shortage, which is doing nothing less than “dragging down the economy,” according to a White House briefing room document,

    The problem is now multifaceted, so the solution is not going to be as simple as adding a better monitoring mechanism.

    At a minimum, companies need better visibility into and transparency of their supply chains. This gives them more control over the entire manufacturing process, from sourcing raw materials to delivery of final products. Technologies like IoT, AI/ML, automation and edge computing can optimize supply chain management by providing visibility and metrics so companies can make real-time decisions.

    In manufacturing, for example, IoT can bring greater visibility into the production workflow. Data from the digital twins of machinery—analyzed in real-time and fed back to control systems—can lead to improved levels of operational and business efficiency. When manufactured goods are ready to be shipped, IoT technology can guide the logistics and transportation of goods as they move from manufacturers to end users. In addition to managing supply, companies also need to get better at predicting customer demand so it’s a self-sustaining feedback loop.

    However, companies adopting these technologies need to be aware that they will not be effective on their own. As with any digital transformation initiative, people and processes are as important as technology. To ease or even overcome today’s supply chain challenges, companies must not only agree on common data exchange formats and APIs across the supply chain but also dedicate themselves to ongoing cooperation and motivation to achieve the common goal of streamlining and hardening the supply chain. To these ends, open source will be critical to the ongoing development of common, industry-wide standards that enable companies to future-proof their solutions.

    For example, carmakers such as Tesla are simplifying their supply chain by using a higher-end processor that can perform multiple functions rather than using dozens of dedicated microcontrollers for each function, with updates pushed out over the air. Organizations need to think along similar lines when it comes to their IoT architecture. Developers have historically thought about IoT applications in a discrete way—creating custom frameworks for creating apps for low-power devices. Rather, developers should be considering IoT applications as an extension of their application portfolio—using the same languages, frameworks and tools for IoT apps that they use for cloud applications.

    Post-Pandemic Supply Chain Issues

    As we move into the next phase of the pandemic, it might be tempting to believe that all will be right with the supply chain world. However, beyond COVID-19, there are several macro trends that will affect the supply chain, including climate change, cybersecurity and the changing dynamics of global trade.

    To combat climate change, for example, companies will need to reduce their Scope 3 emissions. The EPA defines Scope 3 emissions as the result of activities from assets not owned or controlled by companies themselves but by their supply chain (or value chain). Scope 3 emissions are often the majority of a company’s greenhouse gas emissions. To reach sustainability goals, companies will need better resource management of their supply chains.

    Supply chains also are increasingly being used as a cyberattack vector. This includes both physical entities, like building operations (such as the hack of Target systems via a third-party HVAC vendor) or the software supply chain (such as the SolarWinds hack). In fact, it’s no longer a matter of if an organization gets attacked, but when.

    The war on Ukraine has magnified the intricacies of our hyperconnected global economy. The U.S. government and its allies have imposed severe sanctions on Russia, a move that will have widespread repercussions. The New York Times reported that the “response that U.S. officials have promised could roil major economies, particularly those in Europe, and even threaten the stability of the global financial system.” The same could be said for the global supply chain, if Russia responds by, for example, cutting off shipments of materials needed to build semiconductors or mounting new cyberattacks.

    Conclusion

    COVID-19, a steady and stealthy rise in cyberattacks, trade barriers, war … None of these factors caused the problems we’re seeing with both physical and technological supply chains; rather, they have exposed existing weaknesses for all the world to see—and experience. Organizations must work together to increase resiliency and security through the use of key technologies such as IoT, AI/ML and edge, as well as a commitment to open, standards-based solutions.

  • New Relic Expands Scope of Observability Reach

    New Relic Expands Scope of Observability Reach

    At its Futurestack conference, New Relic announced it expanded the integrations and tools it provides for its observability platform and added its first cybersecurity tool.

    The company now provides more than 470 integrations with cloud services, open source tools and other enterprise technologies, with support for offerings from Akamai, Atlassian, CircleCI, Cloudflare, Netlify, PagerDuty and Postman now being added to its Instant Observability platform. The company has also added the ability to now collect logs alongside metrics and traces within its Application Performance Monitoring (APM) offering.

    Finally, New Relic has deepened its cloud ties with Microsoft, added a guided user onboarding interface, support for a wider range of instrumentation methods, tighter integration with Kubernetes and, for the first time, is branching out into the realm of cybersecurity via a New Relic Vulnerability Management service that is being added to its software-as-a-service (SaaS) portfolio.

    Ishan Mukherjee, group vice president for product go-to-market at New Relic, said New Relic Vulnerability Management is the start of a larger effort to enable IT teams to leverage the observability data they already collect via the New Relic platform to drive the adoption of DevSecOps best practices. Legacy approaches to vulnerability management create yet another silo of data that only further aggravates cybersecurity blind spots, he noted. New Relic Vulnerability Management aggregates data collected via its agent software and integrations with a wide range of platforms to provide a unified view of the overall security posture of an IT environment, Mukherjee added.

    It’s still early days as far as adoption of observability platforms is concerned, but it’s apparent that platforms that unify the collection of metrics, logs and traces across both applications and the IT infrastructure they run on are transforming how IT is managed. Most DevOps teams today are able to continuously monitor IT environments using tools that track a set of pre-defined metrics; observability platforms make it possible to aggregate data so that DevOps teams can launch queries that help them uncover the root cause of an IT issue. That capability is increasingly becoming critical as IT environments—thanks, in part, to the rise of microservices and cloud computing environments—become too complex for IT teams to manage using legacy tools.

    The challenge is that most IT teams are not quite sure what questions they should ask to get the most value from investment in an observability platform. Observability platforms that accurately surface issues without requiring much intervention from IT teams are likely to gain the most traction, as the competition among providers of these platforms intensifies.

    In the meantime, organizations might want to start reevaluating roles within their IT teams as it becomes simpler to collaborate around a single source of data. The days when IT teams had to triage issues using disparate tools that surfaced conflicting data may finally be coming to an end. As such, it should become possible for a team of IT professionals to manage a wider range of processes across an extended enterprise IT environment.

    Naturally, it may be a while before observability platforms drive wholesale reorganizations of IT teams, but it’s now more a question of when rather than if that day will come.

  • Creating Automated GitHub Bots in Go

    Creating Automated GitHub Bots in Go

    Events management requires quick responses, which can be challenging since there is typically an incredibly large volume of events that take place every day. Therefore, relying on humans to respond to these events quickly is error-prone, messy and often frustrating. These events have easily reproducible steps that can be codified and are perfect reasons for a bot to exist.

    Creating a bot reduces the daily noise of events so that important humans can focus on important human activities—such as programming, innovating or, most importantly, sleeping.  There are already many bots that exist and that can solve numerous problems. For example, Dependabot helps keep your GitHub dependencies updated with automatic pull requests. Google Calendar has a Slack bot that reminds you when a meeting is about to start. Of course, there are also situations where there isn’t a pre-made bot yet, which provides the perfect opportunity for developers to create their own!

    My preferred programming language is Go, and I’ve used it to create multiple bots. A favorite bot I created helps to manage a large open source project called Telegraf, which I discuss in more detail at the end of this article. Bots are not limited to open source projects; another bot I created proved valuable when I worked for a larger enterprise company. It was a Slack bot that could run commands on Amazon EC2 Windows instances and help teams quickly perform actions for customers, such as resetting passwords in seconds as opposed to days.

    Creating Your Own Bot for GitHub

    Let‘s look at how you can get started creating a bot written in Go that can interact with GitHub. The package google/go-github lets you interact with the GitHub API and makes creating a bot for GitHub easy. Tools like these are your first step in developing your own bot. Using this package, you could create something similar to what Dependabot does. In order to begin receiving GitHub events for you to react to (such as someone creating a pull request), you need to create a GitHub App.

    GitHub App 1

    The GitHub documentation does a great job describing how you can do this, but the important piece to be aware of is a callback URL. The callback URL will be a publicly available address associated with your Go program so that GitHub can route events to it. I use AWS Lambda functions to host the bots I’ve created and managed by using Serverless Framework, but you could use anything you want as long as you get a public URL. If you are interested in using a Lambda function as well, your “main.go” can be as simple as just calling “lambda.Start” and passing in the function that will hold the business logic.

    GitHub App 2

    Because you are using a public URL, security is important. Once you have created the GitHub App, you will be given a secret token that you can use to help validate incoming requests. The google/go-github package makes this easy; all you have to do is call github.ValidatePayload and pass it your secret token and incoming HTTP request to ensure the payload is valid. If successfully validated, the function will return the JSON payload that defines the event you just received. You can parse the payload by using the function github.ParseWebhook, which will return to you an empty interface and can hold any value. Therefore, you will need to use type assertion to access the underlying type to see what event you have received.

    GitHub app 3

    Depending on the event type, you might want to take different actions. Perhaps if someone made a new issue you would receive the type github.IssuesEvent, which would be good to perform initial triage such as adding the appropriate labels. It is also possible to receive the event type github.CommitcommentEvent, which would indicate someone had just made a comment that you could check for special commands such as automatically restarting the build system. You could, for example, also create a welcome comment whenever someone creates a new issue, as seen in the code snippet below.

    Picture 4

    Creating a Slack Bot

    These examples have focused on interacting with GitHub, but can be replicated to create a Slack bot similar to the Google Calendar bot. The package slack-go/slack allows you to interact with the Slack API with which you can post messages or create “modals” that allow users to interact with custom buttons and lists.

    Creating a Slack bot is a similar process to creating a GitHub App. Slack provides a user interface to register a bot, and similar to GitHub, the main thing it needs from you is a public URL so it can send your bot events. You can then also verify incoming events by using the function slack.NewSecretsVerifier using the secret token provided by Slack. As an example, once these steps are completed, your bot can then begin sending messages to channels to help you answer questions.

    SlackBot

    Bringing it to Life

    An example of a bot can be found in the Telegraf project, which is InfluxData’s open source data collection agent. We have a bot written in Go helping us maintain the repository named “telegraf-tiger.” One of the first interactions users have with the bot is when they submit a new pull request. When the request is made, the bot will chime in with a friendly reminder to sign our contributor’s license agreement (CLA).

    reminder

    Once signed, the bot can be asked to verify if the CLA has been signed by adding a comment “!signed-cla” and give the pull request a shiny green checkmark to let the maintainers know everything is ready.

    Another area our Tiger bot supports is sharing the artifacts that our continuous integration (CI) system builds for each pull request with a helpful comment that links to each type. This helps spread awareness of the artifacts so that anyone can easily help test the new feature or bug fix without having to set up a local developer environment themselves.

    CI pull request

    The Big Takeaway

    Bots are an exciting developer tool that can automate mundane assignments and allow engineers to focus on bigger, more engaging tasks. Resources such as GitHub also make it easy to develop bots using Go in various ways. Bots are commonly found across interfaces, with some simply reminding us of upcoming meetings, and others ensuring that important license agreements are signed.

    The use cases for bots are endless, and with the right tools, bots can help engineers focus on more significant tasks at hand. Developers can rest easy knowing their bots are automating tasks and responding to the endless alerts they don’t want to deal with. Instead, they’re able to focus on important human activities, like sleep, so they can dream up the next big thing.

  • Splunk Survey Surfaces Gains in Observability

    Splunk Survey Surfaces Gains in Observability

    A global survey of 1,250 observability practitioners, managers and other experts published today by Splunk found that sophisticated observability practitioners are able to cut downtime costs by 90%. That figure is based on an estimated cost of $23.8 million annually for comparative newcomers to $2.5 million. However, only 9% of respondents are advanced enough to be considered observability leaders compared to 59% that are still beginners.

    Those leaders reported they are seeing a 69% better mean-time-to-resolution (MTTR) for unplanned downtime or performance degradation thanks to investment in observability. The survey also noted those same organizations launched 60% more products or revenue streams from application development initiatives in the last year.

    Observability has always been a core DevOps tenet, but achieving and maintaining is a challenge. Most DevOps teams today aspire to be able to maintain some level of continuous monitoring. However, as it becomes easier and less costly to instrument applications, interest is rising in observability platforms that make it simpler to launch queries and investigate anomalies.

    Spiros Xanthos, senior vice president and general manager for observability at Splunk, said observability platforms are clearly driving down the cost of downtime. There is also a clear correlation between organizations that have embraced observability and the number of microservices-based cloud-native applications that have been deployed, he noted. In effect, increased complexity is driving organizations to turn to observability platforms to manage IT environments in the age of the cloud, said Xanthos.

    The survey found 75% of respondents have multiple cloud-native applications that run in multiple environments. Just over one-third (34%) of internally developed applications are based on microservices constructed using containers, with 28% of respondents reporting they exclusively run cloud-native applications on public cloud infrastructure.

    Overall, the survey also found that two-thirds of leaders reported their visibility into application performance is excellent compared to 44% of beginners, while 64% of leaders reported that visibility into their security posture is excellent compared to 42% for beginners.

    The survey also found 59% of leaders can push code to production on demand for most internally developed applications compared to 28% of beginners. A total of 41% of leaders said they can detect problems associated with internally developed applications within minutes compared to 20% for beginners.

    It’s still early days as far as adoption of observability platforms is concerned but, theoretically, IT should become easier to manage even as the number of platforms employed continues to expand. Advances in analytics and artificial intelligence (AI) are improving the signal-to-noise ratio so that not only are more issues being surfaced sooner but that more trusted recommendations are being made, said Xanthos.

    Observability is, of course, a journey. Most organizations are not even quite sure what type of questions they should formulate to get the most value from investment in an observability platform. Organizations should start small, with a finite project to gain an understanding of how to leverage observability more broadly as they gain more maturity, said Xanthos.

    Regardless of the approach to observability, the one thing that is certain is that traditional IT monitoring is no longer sufficient in an era where IT environments get more complex by the day.

  • Apple Allows 50% Fee Rise | @ElonMusk Fans: 70% Fake | Microsoft Salaries up by 100%?

    Apple Allows 50% Fee Rise | @ElonMusk Fans: 70% Fake | Microsoft Salaries up by 100%?

    Welcome to The Long View—where we peruse the news of the week and strip it to the essentials. Let’s work out what really matters.

    This week: Apple lets devs increase subscriptions “without consent,” Twitter has more than 19% spam accounts, and we dig into the claim that Microsoft is about to double salaries. (more…)