Category: DevOps Practice

  • Armory Aims to Turn Continuous Delivery Into a Service

    Armory Aims to Turn Continuous Delivery Into a Service

    Armory this week made generally available a continuous delivery-as-a-service (CDaaS) offering that promises to make it simpler for a much wider range of organizations to programmatically deploy applications.

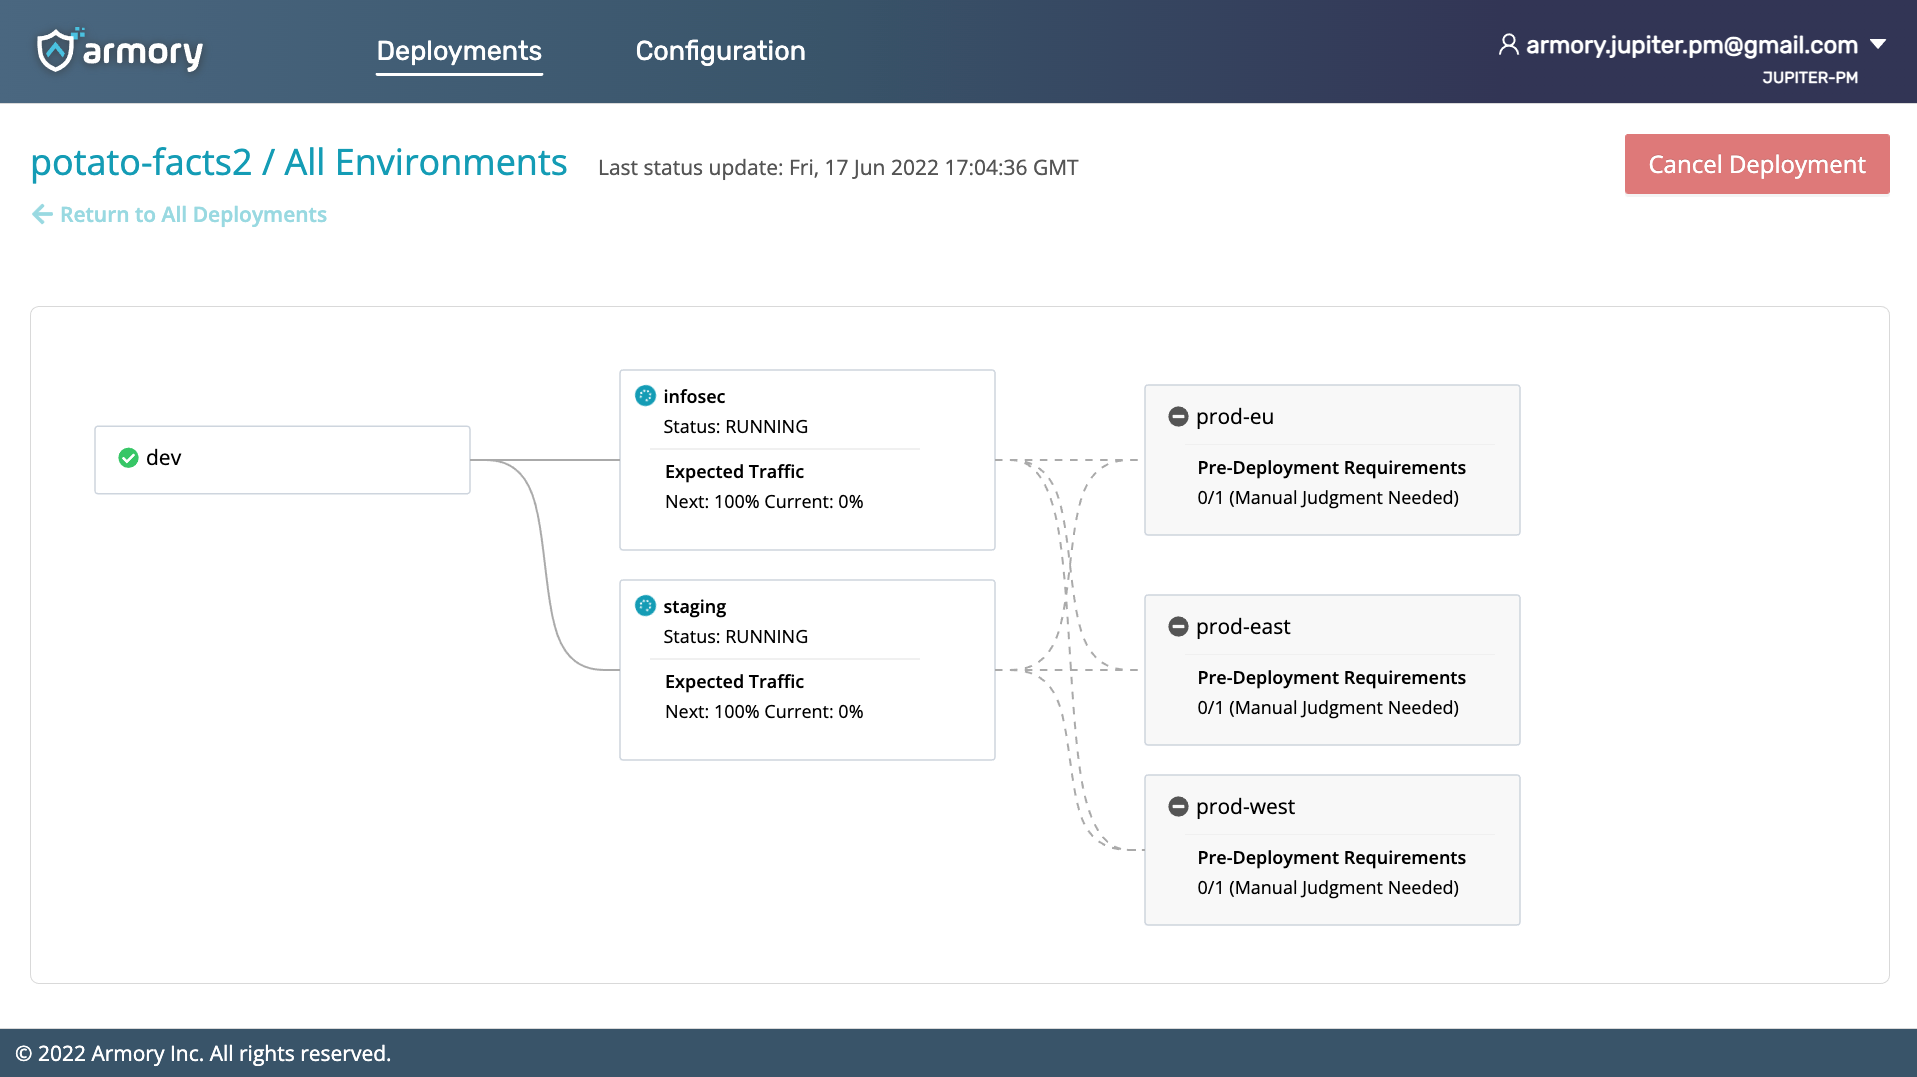
    The Armory Continuous Deployment-as-a-Service platform has been available in beta since March. It differs from Armory’s existing open source Spinnaker continuous delivery (CD) platform in that it is based on a proprietary declarative platform that is designed to integrate with third-party continuous integration platforms.

    Armory CEO Jim Douglas said the goal is to meet organizations that have invested in CI where they are versus requiring them to rip and replace their entire DevOps platform. The company is still committed to providing a curated instance of Spinnaker, but it’s become apparent there are many organizations that want to experience the benefits of a more opinionated CD platform that is more accessible via a cloud service, he added.

    The Armory Continuous Deployment-as-a-Service offering applies many of the best practices that have emerged for the Spinnaker CD platform without requiring organizations to have a dedicated team in place to just manage the CD platform, noted Douglas. IT teams can start using the service to deploy applications in less than 30 minutes, he noted.

    The first edition of Armory Continuous Deployment-as-a-Service is optimized for deploying microservices-based applications on Kubernetes clusters, but Armory will soon extend the reach of the service to platforms running monolithic applications, said Douglas. The company also plans to make available an on-premises edition, he added.

    In either scenario, IT teams will be able to engage in everything from canary testing of deployments to automatic rollbacks in the event an application fails, said Douglas.
    The number of organizations that routinely make use of a CD platform is still relatively small. Historically, each platform used to run applications has been unique, so automating delivery has been problematic. CI platforms, in some cases, have been extended using custom scripts to automate application delivery, but those efforts don’t typically scale across an extended enterprise.

    Douglas said that as more IT teams start to build and deploy microservices-based applications, it’s only a matter of time before CD becomes a more distinct IT discipline. The challenge is enabling IT organizations to achieve that goal without necessarily having to hire a small army of site reliability engineers (SREs). There will still be plenty of DevOps teams that will prefer to deploy Spinnaker, but Douglas said there will also be plenty of instances where a less complex approach to CD will suffice.

    It’s hard to say whether there might soon be varying levels of DevOps platform services that organizations might invoke depending on the complexity of the project and their own internal cultural preferences. However, as the pace of application development continues to accelerate, the need to automate CD will become a more pressing issue. There may be many ways to achieve that goal, but if history is any indication, the path of least resistance is likely to be via the cloud.


  • Improving Observability With ML-Enabled Anomaly Detection

    Improving Observability With ML-Enabled Anomaly Detection

    Nowadays, DevOps and SRE teams have many tools to access and analyze logging data. However, there are two challenges that prevent these teams from resolving issues in a timely manner: 

    • They aren’t equipped with all the data they need
    • Detecting and resolving issues is reactive and manual

    In this article, I’m going to break down why these challenges persist and propose a new approach to observability that will help you overcome them.

    Observability Obstacles

    Challenge: You’re not analyzing all your log data

    DevOps and SRE teams need to understand the behavior of their applications and services to spot anomalies as they occur and keep them up and running. However, the cost of traditional logging platforms prevents these teams from analyzing 100% of their observability data. 

    Instead, they have adopted mechanisms to reduce ingestion volumes. In some cases, this means truncating or filtering out datasets. In others, it means moving data to a less active storage tier/target where analytics are not applied. Furthermore, engineers have to predict upfront which datasets are important and meet the criteria to index. It’s these datasets that teams have the ability to analyze in real-time. The rest are ultimately neglected.

    The net impact is that teams are left with an incomplete picture of their environment, making it difficult to understand how applications and services are behaving. As a result, they cannot pinpoint every issue as it occurs.

    Challenge: Traditional platforms create reactive and manual processes

    When working with traditional observability platforms, teams must constantly define logic to detect issues in their environment. And often, they are only able to detect the issues that they are aware of and have had time to build logic for. To keep alerts firing correctly, you have to stay on top of different data structures, changing data shapes, new schemas and libraries, and fluctuating baselines. 

    However, not every team is equipped to detect issues they haven’t seen before. When teams are faced with unknown behavior, they are left conducting a post-mortem debug which is inherently a reactive process. Furthermore, it is increasingly hard to resolve the issue quickly because logging data is often unstructured and difficult to search. Teams have to manually hunt through loglines to pinpoint the activity and affected systems or components. This approach can add hours or even days to an investigation.

    Improving Incident Response

    The solution: Machine learning-enabled anomaly detection and resolution

    To catch every issue and speed up incident investigations, teams can apply machine learning at the data source to detect potential threats and equip teams with the information they need to keep their applications and services running. This kind of approach allows engineers to analyze 100% of their log data and compile it in a consumable and actionable view so that they can spot changes in behavior and resolve anomalies quicker than the traditional approach.

    As loglines are created, they can be automatically analyzed and converted into insightful metrics that inform application and service behavior. From there, federated machine learning can be used to automatically detect and alert on an issue as it occurs. It does so by baselining key metrics, understanding when they’re outside of typical ranges, and determining the likelihood of anomalous behavior—all through machine learning.

    There is no need to continually build and refine logic, effectively eliminating overly manual engineering practices.

    When an issue occurs, developers and DevOps engineers will receive a detailed report of the specific changes in activity within their systems. In this report, they’ll see the exact window of time of the incident and the affected systems or metadata. This report also includes a pinpointed capture of the relevant raw data that contributed to the anomaly, as well as systems, components, or services that were involved.

    Finally, the relevant full-fidelity logs can be dynamically streamed to a central observability platform (Splunk, Datadog, etc.) before, during and after the anomaly. This gives teams the exact data they need to resolve the issue in a timely manner.

    In all, this kind of edge observability allows system administrators to analyze all of their logs all of the time—not just ones that match the pre-defined query in a centralized setup, saving tons of time when it comes to incident response.

  • Threat Modeling as a DevSecOps Practice

    Threat Modeling as a DevSecOps Practice

    Software engineers are always under pressure to build more software, faster.  At the same time, there is increasing regulatory and market pressure for secure software that meets users’ and regulators’ requirements for data privacy.  This dynamic often puts software engineers at odds with application security or product security teams.

    In fact, 81% of developer teams at large enterprises have launched applications that feature insecure code, according to one researcher, with half doing this on a regular basis. The firm argued that developers and security architects need a better relationship, and I couldn’t agree more.

    These technical teams are working towards the same goal, so it’s in everyone’s interests—particularly senior leadership—to create a more cohesive working environment by breaking down barriers between teams. If the security of a system is designed and enforced by an external security team—disconnected from the rest of the engineering team—then this only reinforces security as a separate silo. But companies can ease tensions by embedding the responsibility for security in the engineering teams themselves: This is the thinking behind DevSecOps. Thinking about security starts when engineers think about solving the problem: At design time.

    While the shift left movement was born two decades ago with the goal of ensuring product testing happened early in the development stage, I believe we need to start left to make real change. In adopting this culture, security and privacy will be less of a bolt-on afterthought and a built-in fixture within the development process, ensuring that engineers and security teams alike are aligned and have visibility of each other’s objectives. 

    By reimagining the build, test, fix, build, test, fix cycle through building an architecturally secure design in real-time, technical teams can detect software vulnerabilities sooner rather than later, which means more efficient product deployment. This is where the process of threat modeling as a business tool can be of great benefit.

    Historically, threat modeling was a static, slow and manual process conducted on whiteboards, as part of a workshop led by a third-party security expert who lacked institutional knowledge of the inner workings of the company. However, this has evolved dramatically into an easily implemented, automated security practice that can be baked into the development and security cycle from the outset, empowering organizations to start left.

    Through automated threat modeling, the security workload burden is relieved for both security architects and engineers. Companies are, in turn, better positioned to keep pace with the cadence of ongoing software rollouts, as an automated platform suggests security improvements as an application evolves. The launch phase bottleneck that’s typically created during the testing stage is therefore removed, as security requirements are identified prior to development—which means that risk is managed before a line of code is even written. Based on this, it should quickly become apparent what a time- and cost-saving exercise threat modeling is.

    No developer or security specialist wants a flawed product to hit the market, so it makes good business sense to adopt a new approach that will lead to better outcomes. Enterprises that introduce threat modeling as part of their development and cybersecurity processes will be on course to embed a true DevSecOps system within the company, transforming the relationship between these two departments.

    In my experience, culture and growth are the key factors for enterprises that decide to adjust their cybersecurity diet to include automated threat modeling. Convincing the app dev teams to invest time into the process is, by far, the most significant cultural hurdle to overcome, because they need to witness the benefits—and up until this point they’re disconnected from the AppSec process.

    Once equipped with the tools and knowledge, delivering secure design will be second nature to developers and a new collaborative culture will be created. In essence, the more teams are given oversight of and accountability for software design flaws, the easier it is to recognize how vital these preliminary checks are.

    Likewise, there comes a stage of business growth when the ‘security first’ and ‘start left’ mindsets are essential to keep enterprise project management on track—and this ties into the culture. As the rate of scale within a company begins to increase and the pace of software deployment must quicken in line with customer demand and market competitiveness, discovering flaws at the end of the design process just isn’t an option. 

    With developers and security teams responsible for vast amounts of code, product resilience on delivery is crucial and ensuring a robust DevSecOps culture is the route to success.

  • Cloud Giants Shun Wind Power? | LaMDA not Sentient? | MS IE RIP?

    Cloud Giants Shun Wind Power? | LaMDA not Sentient? | MS IE RIP?

    Welcome to The Long View—where we peruse the news of the week and strip it to the essentials. Let’s work out what really matters.

    This week: Warren Buffett asks too much for wind energy, it’s “completely ridiculous” to say Google’s chatbot LaMDA is sentient, and Microsoft finally kills Internet Explorer. (more…)

  • Survey Surfaces Raft of Application Security Issues

    Survey Surfaces Raft of Application Security Issues

    A global survey from ReversingLabs found 87% of respondents agreed that software tampering has become a more frequently-used cybersecurity attack, but only 37% said they have any means to detect it.

    The survey, which polled 300 IT and security professionals, was conducted by Dimensional Research on behalf of ReversingLabs, a provider of a platform for analyzing any file, binary or object. Despite software tampering’s frequency, only 7% of survey respondents said they could detect software tampering at each phase of the software development life cycle.

    Just as troubling, only slightly more than half (51%) reported being able to protect their software supply chain with only a third being able to actually check for tampering once an application is final and deployed, the survey found.

    Overall, more than half of respondents (54%) said their organization knowingly released software with potential security risks. Nearly every respondent (98%) also acknowledged that reliance on third-party software use, including open source software, increases security risks.

    On the plus side, more than three-quarters of respondents (77%) said they appreciated the value of a software bill of materials (SBOM) that makes it possible to ascertain what software artifacts are being employed within an application. However, only 27% of respondents said their organization currently generates and reviews SBOMs. A full 90% said they are finding it increasingly difficult to create and review SBOMs. Nearly half of the survey respondents reported that SBOM processes today involved manual steps.

    Other SBOM hurdles respondents cited included lack of expertise (44%) and inadequate staffing to review and analyze SBOMs (44%).

    ReversingLabs CEO Mario Vuksan said that while it’s still early days as far as SBOM capabilities are concerned, a series of high-profile zero-day vulnerabilities has forced the issue into the spotlight. Organizations are now spending months looking for every possible instance of newly discovered vulnerabilities because no one is quite sure what application components are running across an extended enterprise, he noted.

    However, as DevSecOps best practices continue to evolve and mature, it’s also clear that SBOMs will play a critical role in securing software supply chains, Vuksan added. The challenge is that in the age of microservices, application environments are now much more dynamic as components are ripped and replaced with greater frequency, he added.

    SBOMs, of course, are just one element of what will be required to secure a software supply chain. Many organizations are now reviewing their software development processes and uncovering uncomfortable truths about how software is currently built and deployed. The ultimate goal is not to slow down the rate at which software is developed but to make sure there are guardrails in place that prevent insecure software from being deployed in the first place. Far too many developers today still view cybersecurity reviews as tasks to be avoided in the name of meeting an application deployment deadline.

    Hopefully, that won’t continue to be the case as more responsibility and accountability for applications security shifts left toward developers and DevOps teams. In the meantime, however, when it comes to application security, it’s apparent there’s still much room for improvement.

  • Let Me Reiterate – Don’t Rush to Iterate

    Let Me Reiterate – Don’t Rush to Iterate

    We in the DevOps world spend an inordinate amount of time talking about tools and roles—and there are always new tools and modifications of roles to talk about.

    Do you know what we don’t discuss as an industry? The day-to-day grind of being in DevOps. Oh, you can go to forums like Reddit and have those discussions with other practitioners, but pundits don’t discuss what it’s like to actually do the work. I secretly suspect this is because most of us pundits no longer develop code in general, let alone have a working DevOps environment. I certainly don’t code as much as I used to, and I develop more than many of my peers in punditry. For the record, we do have a working DevOps environment (two, but one almost never gets spun up) at my company, but I’ll be nice and won’t get sidetracked by talking about it here.

    We’ve talked about it tangentially, but I wanted to be direct with you all. The vast majority of your organizations do not need to iterate non-stop. And the mentality that you cannot iterate too much is simply false. While the guard gates and German Shepherds that protected production from rogue developers in the past were overreactions, there should be a happy medium. Every time change is introduced in production, there is some amount of risk. And we have a ton of tools to limit that risk these days—feature flags to turn new functionality on/off, auto-run testing before the move to production, etc.—but there is still measurable risk. And “we can just roll it back” only works in small, unsegmented projects. Once you get into nested dependencies (microservices are a great example), then versioning starts to make rollbacks an issue. Knowing the interconnected relationships between what is being changed is a big deal. So it is not as simple as the ::shrug:: “Just rebuild and deploy without your changes,” crowd would have you believe.

    And to a great extent, that is why this pundit doesn’t come out and blather about iteration speeds—the decision to iterate once every six months or every time Bob checks in code is very much an organizational/application one. How fast can the organization handle a full iteration, and how often does the application require it? The answer is rarely the insane number that vendors like to throw out to show you how great they are. There are a whole lot of organization/application combinations whose rate of change is slow enough that they could honestly schedule full-on iterations and plan updates around vulnerability patches in the underlying composite pieces. The majority only need to iterate over months. Very (and I stress very) few need to iterate even daily, let alone more than a hundred times a day. And they are indeed special snowflakes with super-tweaked environments.

    It is kind of stunning to me that a portion of the rise of Agile and DevOps was to free up IT time because we were overloaded. And then once that was done, we decided to crank up the rate of change so that IT was … overloaded. A release takes DevOps time, DevOps time and security time. It takes resources to build, test and deploy. Don’t overdo it.

    Build when you need to. Deploy when it is a benefit to customers. Keep rocking it. We’re out here using your apps, or your apps are grinding behind the scenes, keeping the business running. Either way, you know better than anyone what your app and your org need. Don’t follow the “10 billion deploys a day!” crowd; push for what works. And you are the SME in that department.

  • Jit Emerges to Address Cybersecurity Policy-as-Code Orchestration

    Jit Emerges to Address Cybersecurity Policy-as-Code Orchestration

    Jit today emerged from stealth with a free namesake orchestration platform beta that automatically implements security plans as code.

    Aviram Shmueli, chief product officer for Jit, said the company will both make security plans it developed available as code within GitHub. In addition, Jit will make available a service through which customers can submit documents and spreadsheets that Jit will convert into a custom security plan that can be executed as code.

    Fresh from raising $38.5 million in seed funding, Jit is aiming to advance the adoption of DevSecOps best practices by enabling cybersecurity policies to be more easily implemented as code via its orchestration platform, said Shmueli. The Jit platform enables developers and DevOps teams to take advantage of a graphical tool to automatically implement security policies within a DevOps workflow with a single click, he noted.

    The goal is to eliminate the need for separate DevOps teams to create security policies that each would need to individually manage, added Shmueli.

    In theory, DevSecOps best practices require shifting left the responsibility for security toward application development teams. The challenge is that development teams generally don’t have the expertise required to craft effective cybersecurity policies. Jit is making a case for a platform that makes it simpler to automatically implement vetted cybersecurity policies.

    Exactly how far responsibility for application security will shift left remains to be seen. Developers generally prefer to spend as much time as possible creating business logic rather than implementing cybersecurity policies. As such, it’s frequently left to a DevOps team to find a way to consistently implement cybersecurity policies across multiple applications. Each DevOps team will need to decide how much they can rely on the policies defined by Jit versus opting to implement a set of policies defined by their internal cybersecurity teams. The issue that often arises is cybersecurity teams lack programming skills; the only means available to define cybersecurity policies is some type of document or spreadsheet that, one way or another, needs to be converted into code.

    Given the ongoing chronic shortage of cybersecurity expertise, it’s apparent that more efficient methods for sharing cybersecurity best practices are required at a time when application environments continue to both rapidly expand and increase in overall complexity.

    Regardless of the DevSecOps approach, the pressure to address application security is mounting in the wake of a series of high-profile cybersecurity breaches. Organizations of all sizes are now reviewing software supply chains that are increasingly being targeted by cybercriminals. Security policy-as-code tools make it possible to ensure that applications don’t, for example, communicate with an external system without express permission.

    One way or another, the level of application security currently being attained will improve in the months ahead as more mandates are enforced. The only real issue remaining is the amount of disruption to existing processes that will be required to achieve that goal.

  • Splunk Adds Data Management Tools to Observability Platform

    Splunk Adds Data Management Tools to Observability Platform

    At its .conf22 event, Splunk today announced it is making it easier to both onboard data and then manage it across hybrid IT environments via the Splunk Cloud Platform.

    In addition, Splunk Enterprise is being extended to add support for Microsoft Azure with SmartStore for Azure to store cold data alongside existing support for Amazon Web Services (AWS) and Google Cloud Platform (GCP). There is also a developer edition of Splunk Cloud that enables developers to create and test their own applications, which is currently in preview.

    Garth Fort, senior vice president and chief product officer for Splunk, said the overall goal is to make it easier to automatically tune the parameters used to store data in the Splunk observability platform. As more organizations embrace observability as a DevOps best practice, many of them are encountering challenges managing the large volumes of data they are now collecting in the form of logs, metrics and traces.

    The Data Manager for Splunk Cloud Platform will initially be made available on AWS and Azure, with support for GCP to come later this summer. In effect, it provides IT teams with a control plane for data management that spans multiple clouds.

    Ingest Actions, meanwhile, makes it possible to apply granular controls that enable IT teams to filter, mask and route data in motion within the Splunk Platform or to external AWS S3 cloud storage services.

    Other capabilities Splunk unveiled at the conference include an expansion of Federated Search tools to enable a single pane of view across their entire Splunk ecosystem and a fully managed Splunk Assist service for Splunk Enterprise 9.0 that provides customers with deep insights into their security environment.

    Finally, the company has enhanced Splunkbase, a framework for accessing curated collections of more than 2,500 applications and integrations provided by Splunk and its third-party partners.

    As the pioneer of IT operations analytics, Splunk has a large footprint within enterprise IT environments. It is now looking to expand that base to become an observability platform provider. It’s still early days as far as the transition to observability is concerned, but the goal is to make it simpler for IT teams to query platforms and surface issues that could lead to an IT disruption before it happens.

    It’s not clear how many organizations have the skills and expertise required to formulate those queries, but over time it should become more feasible to augment an IT staff with machine learning algorithms capable of discovering those issues.

    In the meantime, IT organizations are collecting more data than ever about their IT environments. In theory, that data will provide the context needed to optimize application environments that get more complex with each passing day. The challenge, of course, then becomes finding a way to efficiently store and manage all that data both before and after it has been analyzed.

    Regardless of the approach to observability, the need to go beyond simple monitoring of IT environments has never been more apparent.

  • Grafana Labs Adds Visual Tools to Simplify Prometheus Queries

    Grafana Labs Adds Visual Tools to Simplify Prometheus Queries

    At its GrafanaCONline event, Grafana Labs today announced an update to the open source Grafana dashboard. The update adds visual query tools to make it easier for IT professionals of any skill level to launch queries against the Prometheus monitoring platform or the company’s Grafana Loki log aggregations framework.

    In addition, Grafana said the open source edition of Grafana OnCall, a scheduling and paging application, is now also available as open source software that can be used in on-premises IT environments. Previously, Grafana OnCall was only available as part of the managed Grafana Cloud service.

    Archana Kesavan, director of product marketing for Grafana Labs, said version 9.0 of the core Grafana platform makes Prometheus monitoring more accessible. Prometheus is being advanced under the auspices of the Cloud Native Computing Foundation (CNCF). It is most widely used in Kubernetes environments, but can also be used with monolithic applications. The latest version of Grafana adds support for an exemplars overlay for traces and Prometheus sparse histograms.

    Other capabilities added with this release include a dashboard preview and title search capability, support for envelope encryption by default, an expanded navigation bar and a revamped heatmap panel that renders more quickly than its predecessor.
    ‘

    Finally, the alert system that Grafana Labs first introduced as an option is now a default setting.

    Kesavan said in addition to making it easier to launch queries, the Grafana Labs approach also limits the ability of a poorly constructed query to impact clusters running Prometheus.

    In general, the adoption of Prometheus has risen alongside Kubernetes. At least initially, DevOps teams that adopt Kubernetes often employ Prometheus to monitor the platform. Less clear is the degree to which IT teams will continue to rely on Prometheus once cloud-native applications are deployed in a production environment. Many IT teams already have a monitoring platform they employ that they choose to extend to Kubernetes environments. Conversely, however, some organizations are opting to replace legacy tools with the Prometheus monitoring platform to monitor both Kubernetes environments and legacy monolithic applications.

    At the very least, Prometheus has established a de facto standard for collecting monitoring data from Kubernetes environments that can be queried by a wide variety of tools.

    One way or another there will soon be fleets of Kubernetes clusters deployed across the extended enterprise that will need to be monitored. DevOps teams will naturally need to decide for themselves how best to monitor those clusters and, ultimately, observe them in a way that enables queries to be launched and issues surfaced before they become a major problem.

    In the meantime, DevOps teams might want to consider consolidating many of the monitoring tools they use today as part of an effort to streamline operations. Rather than having to correlate events across a dozen tools to determine the root cause of an issue, the goal should be to have enough tools to ensure verification without spending hours sorting through conflicting reports.

  • 5 Tips If You’re the First SRE Hire

    5 Tips If You’re the First SRE Hire

    Site reliability engineers (SREs) have a considerable set of tasks to juggle no matter where they work or how long their company has had an SRE practice. But if you’re the very first one to join an organization—as many SREs are these days, given that the trend is trickling down into smaller and smaller companies—you face a special group of challenges.

    You may find it difficult to get buy-in for SRE from other technical teams. You may struggle to know how to convince your boss that the company’s decision to hire an SRE is paying off. You probably worry that you’ll end up being overextended because you are the only SRE. And so on.

    These five tips are for site reliability engineers who find themselves in the position of being the pioneer at their companies. Whether you’re an experienced SRE who has just been hired at a company that had none previously or you’re brand-new to SRE and your first job happens to be at a company that is also brand-new to the SRE role, the following best practices will help you make the transition as smooth as possible for all involved.

    Collect SRE Metrics Early and Often

    For starters, you’ll want to be prepared to justify the business’s investment in your new role as soon as a boss or fellow engineer asks.

    Do this by collecting metrics about the technical and business impact of SREs starting as early as you can. Your goal should be to quantify how you are benefitting the organization so that you can encourage more support for yourself and any others who may be hired after you.

    On top of this, collecting metrics is also important for establishing early feedback about which SRE strategies are succeeding and which could be improved. Since you’re building an SRE practice from scratch, getting this insight early and often is critical.

    Treat Devs and IT Engineers Equally

    As you start the role, you may find some uncertainty among existing engineers about whose ‘side’ you are on. Are you there to support developers or IT engineers?

    The answer, of course, is both. Although SREs tend to borrow from software engineers’ playbooks more than they do from those of IT Ops, an SRE’s goal should be to empower and support both of these teams. So, unless you’re given explicit instructions to interface with only one group or the other, make yourself everybody’s buddy within the IT organization.

    Introduce Yourself to Non-Technical Teams

    SREs spend most of their time doing technical things with technical tools. But ultimately, the only reason they are doing what they do, in most cases, is to support non-technical users by improving the reliability of the systems they use.

    As the first SRE at a company, it may be well worth your time to get to know these non-technical stakeholders and ask them what they see as the greatest reliability issues in the organization. Building these relationships early on will help you communicate the value of your role across the organization. It’s also likely to come in handy during incident management routines, when you may need to interface with non-technical stakeholders as well as other engineers.

    Build Your SRE Tool Set

    Deciding which tools to use is an obvious early step for any SRE who is building a practice from scratch. But we didn’t put it first on this list because it’s important to get to know the rest of the organization before committing to a particular set of tools.

    As you meet the rest of the organization, ask detailed questions about which tools they use to address needs like observability, security and incident management. Then, by factoring in feedback about which tools work well and which don’t, choose which tools you’ll deploy to support SRE. Be prepared for those tools not to match your own personal preferences perfectly. You may need to prioritize the preferences of the rest of the organizations.

    Plan to Grow the Team

    Unless you have been hired at a very small company, it’s likely that the business plans to hire more SREs over time (assuming that you prove the value of the position, of course).

    Toward that end, plan for how the team will expand. Think about things like whether to use embedded SREs or create a dedicated SRE team. Think, too, about how you’ll document your company’s SRE practice and ensure it keeps operating smoothly as individual engineers come and go.

    Conclusion

    The job of a newly hired SRE is not an easy one, especially if you’re the first person at your company to fill those shoes. But by being deliberate and strategic about how you work, which data you collect and how you introduce the company to SRE, you set yourself – and your future colleagues – up for success.