Category: DevOps in the Cloud

  • American Psychological Association Finds CI & CD Therapeutic

    American Psychological Association Finds CI & CD Therapeutic

    The American Psychological Association (APA), the largest scientific and professional organization for psychology in the U.S. publishes the PsycINFO database with 4-million records and more than 90 peer reviewed journals, books, and other publications, starts Beverly Jamison, Sr. Director, IT Architecture, The APA. “We maintain a database of psychological tests and measures and psychotherapy demonstration videos,” says Jamison. The APA publishes member information and other data as well.

    Because a broad audience including researchers, practitioners, members of other professions, students, the media, and the public use this data, the APA keeps a precise inventory of the data and its elements, checking it for quality and delivering it in a number of ways including as integrated and multimedia materials in B2B and B2C contexts.

    APA Dev and Ops Before & After CI and CD

    When Jamison joined the APA, some odd number of perl / shell-based coders like her used the VI editor as their IDE while others of the ColdFusion persuasion used Dreamweaver as their IDE. Developers deployed direct to the live system, at off hours, with the developers and perhaps one QA person testing AFTER the deployment was completed, says Jamison.

    Today, the APA uses svn for version control for legacy development projects where they are accustomed to that and Git and BitBucket for newer projects that seem to benefit from that. “We use Ant for the scripts to deploy code from version control. For unit testing, we use X-Ray for xquery, JUnit for java, and mocha for javascript,” says Jamison.

    The APA uses the Roxy community tool for deployments to MarkLogic to address MarkLogic database instances and configurations, which provides uniformity of the MarkLogic databases, explains Jamison.

    The nature and purpose of each team inside Dev and Ops determines the usage of the tools. The work of the MarkLogic team dictates one application usage while the priorities of the identity and integration services team require another. The MarkLogic team deals with data services and data models that are often complex; as such they make a great deal of use of unit testing to ensure that a single change doesn’t lead to broken software throughout, explains Jamison. Identity and integration services uses Jenkins to script their builds and to ensure that each build is current; QA analysts test to ensure that their complex scenarios are reliable, says Jamison. Likewise, the UI team has still another set of priorities and usages.

    A Panoramic View of the APA’s New Feature Development Process

    First the developer will check out a branch from subversion to a local IDE, make and then test the altered code and run unit and regression tests on existing code, and update unit tests, configuration scripts, and any script changes needed, explains Jamison. The process would then include updating and tagging any JIRA tickets with the appropriate version number for the forthcoming release.

    The code would deploy from svn to the given IDE for QA testing, which developers or engineers would run depending on the size and complexity of the system and the current system state with respect to release to the outside world, says Jamison.

    “Then the code would deploy to the integrated UAT environment for testing by the business team. Once approved there, we would schedule a production release with the systems engineers handling deployment to live public facing servers,” says Jamison.

    How CI & CD Impacts / Empowers This Development Process

    CI & CD processes hand the developers and engineers greater freedom in adding new features, relieving their fears of doing extensive damage to existing software releases. A minor feature change or bug fix could see the steps in the above process happen in close succession as CI and CD processes avoid the risks of having to revert the code. “A major new feature or change to a data model would mean taking these steps on separate days with distinct and formal signoffs on each,” says Jamison.

    Final Thoughts

    In a word to the wise, Jamison reminds that while tools matter, it is how the teams commit to using them in disciplined CI and CD practices that counts.

  • Librato Seeks to Unlock DevOps Application Monitoring

    Librato Seeks to Unlock DevOps Application Monitoring

    As wider adoption of DevOps methodologies continues to foster demand for new tooling to help streamline evolving workflows, at least one vendor is attempting to address the growing need for related monitoring capabilities.

    Librato, a San Francisco-based provider of Amazon AWS applications performance monitoring (APM) services, claims that it is finding favor among the rapidly expanding DevOps community driven by its ability to inject critical visibility into the engineering lifecycle.

    Acquired by Austin, Texas-based SolarWinds in January for a lofty $40 million and renamed Librato SolarWinds Cloud, the company is touting its recent adoption by well-known providers such as Slack for monitoring of DevOps-centric applications performance and health metrics.

    “At its core, DevOps is destroying conventional wisdom around ritualized processes and the need to perform them, mostly in the domain of scale,” said Dave Josephsen, Developer Evangelist at Librato. “By attempting to include monitoring as a key element of the development lifecycle, this has created a whole new range of challenges, and opportunities.”

    By providing a centralized Web interface and open API to help create visibility into critical applications engineering requirements, Librato maintains that it is creating the tooling necessary to empower integrated development and deployment processes, such as continuous change control.

    “There are a lot of disparate tools for monitoring individual engineering tasks, but there hasn’t been any practical way to bubble up that data for efficient monitoring,” Josephsen said. “Within the context of DevOps, change control is a ritual that we’ve abandoned as we’ve embraced test driven development and automated away the human element, so there’s a distinct need for monitoring of feedback and metrics.”

    For example, cloud-based productivity messaging specialists Slack are using the Librato “StatsD” lightweight daemon process to stream business and app-health metrics regarding PHP applications into the monitoring platform. Slack also leverages Librato to chart data regarding connect, query and fetch latencies for its server clusters, and to monitor internal metrics about overall system health.

    “Having those graphs side-by-side lets us clearly see and compare the effects of network latency on one of our new services, and that’s very cool,” Richard Crowley, director of operations at Slack, wrote in a recent testimonial posted to the Librato Solarwinds blog.

    Industry experts agree that broader adoption of DevOps strategies will continue to drive demand for relevant monitoring tools, with solutions such as Librato seeking to deliver “modern stack architecture for looking at the modern stack.”

    “I think that APM is always interesting because it’s always new,” said James Governor, industry analyst with RedMonk. “The pace with which we’re building new architectures to deliver services to end users is increasing all the time, and with every new wave of technology, we tend to get new and associated models of APM tooling.”

    Librato is taking advantage of the need for a system that brings together the elements necessary for cloud native monitoring, and in an agentless manner different from other competing tools such as New Relic, the analyst noted.

    However, whether or not the platform is able to break down traditional engineering siloes to enable more efficient DevOps management, as Librato officials claim, remains to be seen, he said.

    “Each wave of technology has promised to do this, to remove the inherent finger pointing, and each has always made the same claim to break down organizational firewalls,” Governor said. “DevOps hasn’t boiled the ocean in this manner yet, but there are some unique opportunities; unlike previous waves, where automation was intended to replace humans, this is now about augmenting people, and we are seeing that teams are choosing new tools from which developers can truly derive value.”

  • DevOps in a Hybrid Model

    DevOps in a Hybrid Model

    As enterprises have begun to demystify the value proposition around cloud adoption, several best practices, optimization techniques and delivery models have been described in the technical community around cloud enablement and large scale adoption. While the debate between choosing private cloud vs. public cloud model has been longstanding, enterprises have been looking to mitigate the level of software disruption caused by such large transformation. A Hybrid model is thus a very appealing prospect since enterprises can still technically control the security policies and governance models, while also taking advantage of capacity bursting and other benefits of the cloud.

    As with most technologies, adopting a hybrid cloud solution doesn’t buy you a free lunch either. There are several complications that are being discovered as enterprises mature into this model. One of the biggest challenges is to keep the software development lifecycle in sync across multiple target environments that are the basic backbone of a hybrid cloud model. Thus, having a robust DevOps solution is one of the key necessities for making a hybrid model work.

    The Business Case for a Hybrid Cloud Model

    In today’s complex business world, enterprises either by choice, or by circumstances, are choosing a hybrid model of IT solution. Enterprises are best served by implementing a “best of breed” solution, which means a combination of several domain specific SaaS (Software as a Service) and PaaS (Platform as a Service) solutions. This also eliminates any risks of a “vendor-lock in”.

    So by design, a hybrid model will have a combination of the following characteristics:

    • Multiple platforms within an enterprise architecture
    • Both traditional as well as virtual platforms
    • Domain specific SaaS/PaaS solutions, typically in a multi-vendor scenario
    • Lack of standardization across cloud platforms (hypervisors, hardware types supported, so on and so forth)

    Now, the challenge is to make IT delivery work seamlessly around these characteristics. This is only possible by a high degree of automation in the delivery process, operations process as well as the business planning processes. Those are the very elements a DevOps platform attempts to solve.

    The Challenges of Cloud Adoption

    Let’s take a quick look at some of the core existing IT capabilities built into a large enterprise.

    •  Security model

    One of the biggest challenges towards cloud adoption is the notion of extended or revamping existing enterprise security model for cloud (and as a consequence, into DevOps solutions). How can one make sure the same security policies for data classifications and user management are applied especially on a public cloud model? Will existing audit processes suffice in a cloud model? Can existing security policies be leveraged as-is or with minor modifications and still be able to take advantage of a cloud model? These challenges will drive enterprises into a hybrid solution.

    •  Support and Governance models

    Many enterprises have built up a history and matured best practices around IT governance and support structure (think ITIL). The cloud model in many ways disrupts those practices. One of the ways to mitigate the disruption is to adopt some form of a hybrid model so some best practices and core support capabilities can still be leveraged while taking advantage of the cloud.

    One of the emerging business models for enterprises is to avail a more “managed services” model so they can focus more on their core business capabilities rather than on IT. In a managed services model, one or more service providers will be responsible for portions of the overall cloud solution while the enterprise would retain responsibilities over centralized capabilities like security. So the “hybrid” nature is not just limited to physical environments, but also around support models.

    Implementing a DevOps strategy could help mitigate a lot of these issues.

    Hybrid DevOps Scenario

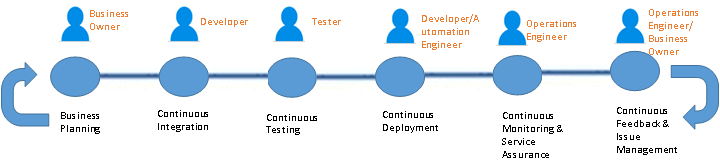
    A typical SDLC (Software Development Life cycle) DevOps looks like the following.

    Sunil's Blog 1

    Figure 1 – A Typical DevOps Pipeline

    The aforementioned actors in figure 1 may or may not actually be “people” since in a true DevOps world, those actors are replaced with some degree of automation. But it sets the context on what types of roles & responsibilities are expected in a typical pipeline.

    Now, imagine this pipeline that is multi-folds, across several application or components. This is the real nightmare of deployment and release management issues that one has to account for since in a hybrid model. Each of these applications/components may technically reside in a totally different environment developed and managed by totally separate groups with different service level agreements.

    A centralized DevOps platform, standardized across these application environment boundaries (for the most part) to provide a single pane of control over code, release and deployment management is what is required for a successful adoption of hybrid solutions.

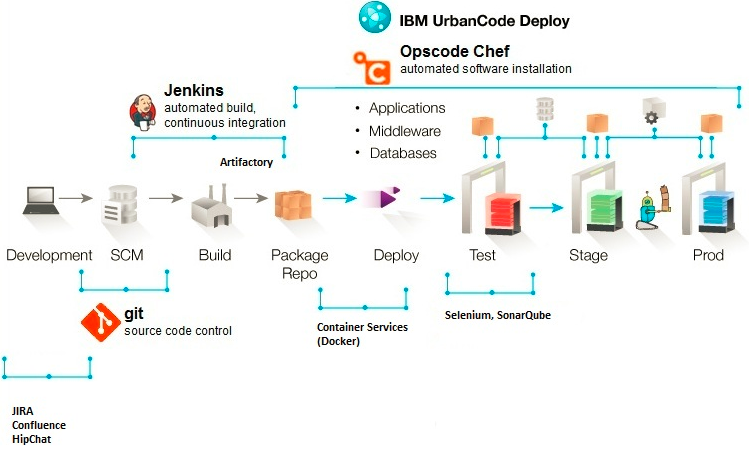
    Here is an indicative centralized architecture to solve the deployment and release management issue described above:

    Sunil's Blog 3

    Figure 2 – DevOps Platform Architecture Example

    The components listed in figure 2 is purely indicative and shouldn’t be misconstrued as any product marketing or messaging. The main challenge will be to standardize components to the extent possible (this is easier said than done) and stitch together a meaningful platform that works within an enterprise (based on existing tooling & processes, skills, funding etc.). Bear in mind I’m merely touching the surface in this article with regards to a DevOps platform, and limiting this to a tooling discussion. Bigger challenges do exist in the form of process and organizational transformation, which are also necessary to make a DevOps implementation successful. I’ll pen those topics in a separate article 🙂

    Summary

    DevOps for Hybrid cloud implementations will soon become the de facto model for process transformation in large enterprises. There is simply no other way to go about such large transformation in a purist way. There is a wide verity of use cases for a hybrid model, and most enterprise situations would fall under one or more of those categories. A robust DevOps platform is absolutely critical to making a Hybrid cloud adoption successful.


    About the Author/ Sunil Joshi

    Sunil JoshiSunil is an Executive Architect with IBM. He is currently the Application Development & Innovation (AD&I) DevOps offering owner for Global Business Services. He is IBM Senior Certified and Open group certified Distinguished Architect. His specialization are in the areas of hybrid cloud solutions, platform as a service and DevOps strategy. He’s created complex hybrid solutions on cloud and DevOps for large enterprises. Sunil has authored several IBM Redbooks, blogs and also a co-author of the IBM Cloud Computing Reference Architecture (CCRA).

    Sunil is passionate about international music, multi-cultural cuisine, active sports and mentoring school & college students on career path and technology.

    Contact Sunil on  linkedin twitter

  • How to “hear” OpenStack silent failures earlier and remediate faster

    How to “hear” OpenStack silent failures earlier and remediate faster

    Troubleshooting “silent failures” in an OpenStack cloud environment has been a tough problem to solve for many production users. eBay’s chief engineer of cloud, Subbu Allamaraju, whose team has been operating PayPal on an OpenStack-based private cloud since March 2015, has publicly defined one of his ongoing challenges as: “Too much noise, too many alerts, and still working on how to detect troubles before customers find out.”

    For enterprises and service providers in various stages of rolling out OpenStack, tackling silent failures invariably starts with two questions:

    • Why and where do silent failures occur?
    • Can my Ops team receive push notifications of warnings earlier and proactively remediate them before silent failures materialize?

    Silent failures happen because OpenStack Ops teams often don’t know which service domains to tune into for early-stage warnings. Even if they do, the warnings get drowned out by noise. For instance, your metrics and logs for the compute domain show a successful VM creation. Yet, a tenant is still not able to use her requested VM instance – a silent failure – while the warnings actually show up in metrics and logs outside compute domain, such as DHCP agent failure and identity database query timeout.

    To catch a situation like this, OpenStack Ops teams need a real-time, data-driven approach that automatically detects early warnings in DHCP agent and identity service, then correlates them with VM creation, and finally push-notifies only the relevant domain experts to collaboratively remediate “tenant can’t use requested VM.” All noise has been removed and related warning signals have been clustered and contextualized together – automatically.

    And Operators shouldn’t have to rely on writing rules to model silent failures. Writing rules will be too time consuming and are unable to cover all failure scenarios. There are too many service domains – at least 13 of them (e.g. compute, identity, dashboard and storage) – plus their service daemons and virtual switch tunnels that stitch them all together.

    Using real-time, data driven management to resolve OpenStack silent failures has been a recent success for OpenStack. For example, a large OpenStack production shop was able to proactively detect OpenStack cell failures by receiving early notifications from outside the cell domain – CEPH and JBOD I/O failures.

    By becoming data-driven and ingesting all events and status messages across the entire OpenStack into real-time, machine learning algorithms, OpenStack Ops team automatically receive cleaned and contextualized alerts, then use modern social collaboration technologies to rapidly troubleshoot issues, capturing tribal knowledge for the future. The new mantra for these teams should be “clean, contextualize and collaborate,” the 3 pillars of real-time situation management.

    But real-time situation management doesn’t just stop here. It scales across the entire ecosystem that lives in and around OpenStack. Data sources include the ever-pervasive RabbitMQ message bus across all services, metrics and logs across the diverse tenant operating systems, and metrics and logs across all technology and vendors. In essence, monitoring the entire technology and vendor independent reference architecture can be rolled up and simplified as “situation management” vs. reacting to many seemingly unrelated “domain silo alerts.”

    Real-time situation management can also sit above multiple OpenStack instances for load sharing and DR purposes, and the interactions with public cloud. For instance, Amazon CloudWatch can be quickly incorporated as a data feed, giving OpenStack Ops teams a “manager of managers” view across OpenStack hybrid clouds.

    Real-time situation management essentially provides Ops team with a single pane of glass to see and resolve failures earlier, with amplified signals and suppressed noise. Doing so without relying on extensive rules offers much needed flexibility for Ops team to keep up with so many “unknown unknowns,” as the OpenStack community continues to evolve its entire reference architecture and ecosystem.

    About the Author/Feng Meng

    Feng Meng is a Senior Director, Product Marketing at Moogsoft. His expertise lies in IT service assurance, with 15-year technical marketing background in Application Performance Management (Bytemobile, acquired by Citrix), Network Performance Management (Cisco), Infrastructure Monitoring (VSS Monitoring), and Server Management (HP). Twitter: @fengmengmoog @moogsoft  Linkedin: https://www.linkedin.com/in/fengmeng1970

  • Two paths to metal devops: cloud-like API driven & cluster building

    Two paths to metal devops: cloud-like API driven & cluster building

    I’ve been seeing a rising interest in metal DevOps fueled by containers and scale-out data center platforms (like Hadoop, Ceph & OpenStack) that run at the metal level. While I see this is a growing general trend (Packet, Internap, RackSpace, OpenStack Ironic, MaaS), I’m going to stay firmly within my wheelhouse and use OpenCrowbar as my reference here.

    Building on the API-driven metal features of OpenCrowbar, this has translated into two paths for workloads to run on metal:

    1) “Cloudify” the metal using APIs from tools like Chef Provision, SaltStack Libcloud, Docker Machine, Cloud Foundry BOSH. These tools have clients that target cloud APIs like OpenStack and Amazon. These same clients work against cloud are easily ported to Crowbar’s APIs.  Five years ago, conventional wisdom was that we’d need a universal cloud API; however, practice has shown it’s not very difficult to wrap APIs in a way that does not reduce every cloud to a least common denominator.

    2) DevOps deploy the workload using hand-offs to tools like Chef, Saltstack, Puppet or Ansible. This approach leverages the community scripts (Cookbooks, Modules, Playbooks) for the workload with the critical ability to create a tuned environment and inject the needed parameters directly into the scripts.  A critical lesson we learned going from Crowbar v1 to v2 was for our scripts to have crisp attribute input/output boundary to avoid embedding environmental knowledge into the code.

    While I’m casting this in Crowbar terms, I see this approach to metal as coming into the market by force fuels by a desire for containers-on-metal and devops-on-metal.

    Let’s look at some of the unique and shared use-cases for each approach:

    Metal API

    Both

    Metal Cluster

    • Easy Cloud to Metal Migration
    • Minimal Tool Customization
    • Portability of DevOps Scripts
    • Take advantage of power cycling
    • Enables constant refresh cycles
    • Leverage Hardware features
    • Advanced Network topologies

    In either case, you have to handle bespoke (hipster word for custom) steps in the provisioning flow that are unique to the your operational needs. Our experience is that each site (even each server!) is unique in some incremental way.  For example, one site may require teamed networks with VLANs while another requires flat networks with an SDN layer.

    These differences are not mistakes or errors: the reality of physical ops and individual operational choices mean that there are a lot of valid configurations. Rather than attempt the Sisyphean task of enforced conformity, we work to abstract differences so that they can be ignored when they are not material.

    In the end, the choices are not mutually exclusive. Metal APIs are often faster but harder to optimize. You can use them to get started quickly and then invest time to optimize a cluster for long term operations. The underlying physical orchestration can support both.

    Are you looking at getting closer to metal?  Which of the options above makes the most sense to you?  I’d love to hear about your use-cases, architecture and configuration requirements.

  • Internap’s DevOps Culture: PrivateStack + CD = ? [Read On & Draw Your Own Conclusions]

    Internap’s DevOps Culture: PrivateStack + CD = ? [Read On & Draw Your Own Conclusions]

    Engineers at Internap, a hosting company and public cloud vendor designed a new OpenStack-based cloud platform and development environment. devopsy.kinsta.cloud tells the story of Internap’s DevOps cultural evolution, which grew virally, interwoven with the company’s development of PrivateStack.

    Challenges in Internap’s Common Development Environment

    Challenges that slowed Internap’s cloud development process triggered a hunger for change and for a new / altered development scheme. “The Internap public cloud product is essentially composed of micro services that make cloud resources available to our customers,” says Mathieu Mitchell, Senior Software Developer, Internap. Internap engineering teams tested their cloud services simultaneously with each affecting the other and transferring adverse effects to production or pre-production. Internap needed to let the billing team test their services, integrated with a duplicate of the production software and environment, without affecting the virtualization team.

    These challenges were rooted in a commonly shared development environment for all the engineering teams and team members, which introduced tedium for engineers as they worked to build and deploy stable code.

    When sharing a common development environment, each engineer’s tests depended on environment consistency and reliability. When engineers / developers tested two changes at the same time, there was no way to tell which change introduced a regression. The most reasonable way to address this prior to PrivateStack was to push all changes into the environment and dedicate specific engineers to identify and fix the issues that occurred.

    The challenge with dedicating specific engineers to troubleshoot these regressions was that they had a diminished context to work with when compared to the original developer’s understanding. The team that introduced a change needed feedback from the environment and to shoulder responsibility for fixing the issue. This would result in a stable codebase and the ability to write more thorough, automated tests.

    “This is why we created PrivateStack–to allow us to independently test a single change, integrated with other services, in an environment that is the equivalent of a private production setup,” says Mitchell. PrivateStack enables development teams to innovate while ensuring that changes behave correctly in production. This in turn enables CD and speeds development.

    DevOps Culture Leads Teams to Success

    As Internap developed PrivateStack, engineering observed a DevOps belief system spreading across the project and the teams. “At first, it was only a minority among us, mostly people with an Agile background, who advocated the Continuous Delivery approach while we worked on this project. We really believe in delivering value to our customers as quickly as possible. To achieve Continuous Delivery, we needed people to understand that automating everything was the way to go,” says Mitchell.

    As more engineers realized that they were the solution, they became increasingly motivated to enhance processes, create the new development environment, and use CD to develop the Internap public cloud product.

    Results with PrivateStack

    PrivateStack enables Internap teams to share the same code and system configurations while individual developers have each their own private production environment to test their software without affecting others. “We heavily leverage virtualization to be able to recreate our environments, since buying racks and racks of hardware to make this available to all of our developers would be cost prohibitive,” says Mitchell.

    With PrivateStack, Internap isolates production issues during development, keeping R&D efficient and slashing pre-production troubleshooting time. “PrivateStack also improves our time-to-market, is much less costly, and most importantly, reduces the chance of any issues reaching the customer,” says Mitchell.

    DevOps Culture Wrap Up

    To finish the PrivateStack project and foster a DevOps culture at the same time, Internap’s internal core of CD true believers lead by example. Mitchell and his colleagues adhered to consistent principles while hearing out other team members on their concerns. This helped them to encourage the larger engineering department including billing and virtualization teams to adopt a DevOps and CD frame of mind.

    “We dedicated two people to drive this initiative, along with a few others who believed in the Continuous Delivery approach but were not involved directly,” says Mitchell. That was enough to get the job done. Now the vast majority of the engineering department is targeting CD.

    “We are eager to share our PrivateStack platform with the open source community to enable other developers to run production-like environments for development in their day-to-day operations,” says Mitchell.

  • Launching Applications to the Cloud – It’s all about Scalability and Speed

    Launching Applications to the Cloud – It’s all about Scalability and Speed

    It is not hyperbolic to state that today’s web services deal in hyperscale realms when one considers stats such as

    • The Amazon cloud can handle up to 1 million transactions per second during peak loads
    • Facebook was managing 890 million daily active users on average for December 2014
    • There are 500 million tweets sent per day and 80 percent of those are sent from mobile devices

    Ironically, the move to hyperscale web services has been made possible by applications going micro, as in microservices as commonly defined as “small, independent processes communicating with each other using language-agnostic APIs.” The emergence of microservices based application architectures is a revolutionary departure from monolithic app development, which was purpose-built around a single service, e.g. storage management, CRM, etc. In its place now are 10 or more modular, reusable services each owning a limited and specific set of functionality in what might be best illustrated as replacing a singular black box with a set of Lego blocks.

    In turn, this has led directly to key advancements in the application development process, evolving from start-to-finish programming to agile, continuous integration/continuous development (CICD). This model offers two major advantages over the waterfall development approach:

    • One, decreasing software development time to align to the “speed of business” dictated by market factors and not by IT processes.
    • Two, enabling specific modules of an application to achieve “autonomous elastic scale” where instances can be scaled up or down dynamically and on an as-needed basis.

    The software world and its professionals are intimately familiar with these application megatrends, of course. They live it every day. However, they may be less familiar with what’s happening — or to be more precise what’s not happening — with the evolution of networking, specifically in the layer that manages server load balancing or application delivery control (ADC).

    This is so because legacy ADCs were built and optimized for applications that resided in a single hardware platform and at a single location. With the advent of Microservices, the days of a cozy 1-to-1 relationship between the ADC and a monolithic application is quickly becoming a thing of the past. A useful analogy here is to equate the management of these resources with how humans treat cattle vs. pets.

    Application microservices are like cattle in that while these resources are valuable, each resource can be easily replaced. Legacy ADCs are like pets in that they’re not easily replaceable and, at times, require painstaking levels of care and attention.  Indeed, it is clear that the pace of innovation for these networking devices has not kept pace with the requirements of application microservices in their current forms as either hardware appliances or as self-contained VM appliances.

    Though legacy ADCs may be upgraded to be microservice “aware” and even provide certain levels of integration; they are not optimized to support an application architecture that’s built on microservices written in different programming languages and distributed across many different hardware platforms, clouds, and even data center locations.

    The solution requires ADCs and load balancers to evolve to take on more of the characteristics microservices possess (be more like cattle and less like pets), namely:

    • Being tightly aligned with each app microservice and not with the entire monolithic app;
    • Delivering a consistent set of network services in a location-agnostic way, whether the app location is on-premises in a data center or distributed across private and public clouds;
    • Being hardware agnostic, whether the app is on bare metal, in VMs, or even in containers – without requiring additional configuration tools; and
    • Achieving autonomous and elastic scale to support each microservice throughout its useful lifecycle.

    Further, this evolution must be true and profound and not a mere incremental advancement, which has hindered the adoption of software-defined data centers among the large enterprise segments thus far.

    Specifically, ADCs must achieve the concept of “application affinity” which is based on the app-world concept of “processor affinity” where resources are aligned/pinned for specific functions. There are two major benefits to this approach. First, having the ADC resource side-by-side, the microservice will improve the application response time. The application delivery follows the “destiny” of the microservice – it grows, shrinks and moves with the app itself.

    Second, this tight alignment (affinity) enables ADC resources to achieve automatic lifecycle management of microservices without manual intervention, which reduces management complexity significantly.

    In summary, it’s been said that best things tend to come in small packages. Such is the case with the emergence of application microservices, which has paved the way for agile, continuous application development and hyperscale web services.

    It’s time for the ADC to undergo a similar evolutionary path in order to maintain its strategic value as the gateway between the network and application layers.

    About the Author/ Dhritiman Dasgupta

    DD_Exec MugDhritiman Dasgupta  the VP of Marketing Avi Networks.Prior to joining the Avi Networks team, Dhritiman Dasgupta (aka DD) was a Vice President at Juniper Networks where he headed up the data center, security, and SDN marketing efforts.  He launched the award-winning QFabric and MetaFabric systems. Prior to Juniper, DD spent 9 years at Cisco Systems in the LAN and Data Center switching divisions heading up product management for several multi-billion dollar platforms including the Catalyst series switches.  https://twitter.com/mandhriti

  • BlazeMeter harnesses open source to deliver continuous testing for DevOps

    BlazeMeter harnesses open source to deliver continuous testing for DevOps

    DevOps is all about efficiency and automation—streamlining development and deployment. In order to deliver quality code quickly a culture of continuity is required—including continuous testing. BlazeMeter provides organizations with a platform for continuous performance testing in a DevOps environment.

    BlazeMeter claims to be a more affordable—and in some ways more powerful—performance testing platform than HP LoadRunner. The platform isn’t completely unique. It is harnesses and repackages the features and capabilities of JMeter similar to the way that the very popular code repository GitHub is built on the open source Git project.

    Open source projects are a very effective engine for creating tools and applications organizations need. The collaborative, crowd-sourced nature of open source projects leads to a solution that is more likely to appeal to a broad consensus. Where open source tools often fall short is in polish and support. Contributors are primarily focused on features and capabilities that impact the tool or platform itself. Organizations, however, also want the metrics and reporting generally provided by an independent software vendor (ISV) as well as the peace of mind of knowing where to turn for support.

    That’s where a company like BlazeMeter shifts the value proposition and makes the open source tool better…for a fee. I’m not suggesting there is anything wrong with that. As I noted above, many organizations crave or demand a solution like BlazeMeter rather than the open source tool it’s built on because they need additional features and support.

    I spoke with BlazeMeter Chief Evangelist Ophir Prusak about new features and capabilities introduced recently by BlazeMeter. Last week the company launched a new suite of features aimed specifically at test automation for a DevOps environment. The key features include KPI (Key Performance Indicators) Trends, which automatically display graphics of KPIs for easy tracking and troubleshooting; password-free Organizations and Projects folders, allowing DevOps teams to effectively collaborate and execute tests; a Single Sign-On, facilitating quick third party access and authentication; and an improved On Premise Load Generator with newer Docker-based technology, providing increased reliability and a simpler installation process.

    Prusak and I spoke about the continuous continuousness of DevOps. We also talked about the blurred line between continuous testing and continuous monitoring. While there are products and services out there that claim to fall under one heading or the other the reality is that continuous monitoring is essentially a form of continuous testing. In that same vein continuous testing—by the very nature of being continuous—also provides organizations with persistent feedback that would alert admins and developers if an issue were present.

    In a DevOps world the traditional role of QA shifts down to the DevOps engineers and developers themselves. BlazeMeter integrates with most existing development lifecycle tools and processes so it can work seamlessly.

    BlazeMeter takes the power of JMeter and packages it up with comprehensive metrics and reporting as well as enterprise-grade support. Organizations that are striving to develop and deploy code more efficiently should check out JMeter—and then take a look at what BlazeMeter brings to the table to determine if the investment makes sense.

  • 3 golden rules of microservices deployments

    3 golden rules of microservices deployments

    As a developer, you value the principles of SOA. You aspire to build applications as a set of consumable services via endpoints. Remember how Amazon used SOA to build the AWS platform and how Google is emulating AWS? However, not all is hunky-dory in the SOA world.

    Developing is one thing but running, managing, and maintaining services is a whole other beast. When it comes to the latter, many enterprises still act monolithic. They run and manage applications services as a unit on one or many servers. This approach fails to scale when the services themselves scale or when you need to update and maintain them regularly. So do you lament over the spiking costs and time spent on these efforts or fix the problem?

    Recent trends point to microservices as the answer. By definition, microservices are much smaller than services. In fact, Wikipedia says a microservice performs a small task often just one. There are many articles that go in deep about microservices architecture, but we cover an important part here, which is deployment automation. In other words, our daily job.

    The self-contained, independent, and reusable principles of microservice architecture help solve the problem of scaling and maintaining application services.

    • Self-contained. Microservices are standalone operations that run without requiring other services. That means each runs on its own. You can scale each up or down and replace a service individually instead of updating the entire monolith given the business need and load.
    • Reusable. Microservices are self-contained so you can reuse them for other applications and functions. We’re talking of reusing already deployed microservices.
    • Independent. Microservices are platform agnostic, which means you can design them independent of infrastructure needs to run anywhere, in any cloud.

    So is it easy to shift from SOA-based architecture to microservices? Adopting microservices is not without challenges. To name some, you need to modularize existing software services as self-contained units, you need to configure the microservices to communicate with each other, and you need lots of deployment and test automation.

    To address these challenges out of the box, we recommend a DevOps solution like ElasticBox. Take a look at how ElasticBox supports microservice deployments.

    1. Modularize self-contained microservices

    The box model in ElasticBox wraps each microservice as a standalone component in a service catalog that you can reuse across applications. A script box automates the lifecycle of microservices using Bash, Puppet, Chef, SaltStack, Ansible, PowerShell; a container automates Dockerfile deploys; a CloudFormation box automates AWS resource stacks.

    2. Connect microservices via bindings

    More microservices means more endpoints to manage. Such endpoints handle REST or other protocol communications over the network. With ElasticBox bindings, network references are as easy to manipulate as programming variables. Want to route database connections to another MySQL service? It’s easy to do. Just point the services to deploy with a different binding value.

    3. Deploy microservices independently

    Boxes are inherently agnostic. Put infrastructure metadata for CPU, memory, storage, additional disks, virtual networks, firewalls, load balancing, and autoscaling in deployment policies attached to a cloud service like AWS, Google cloud, and more. Policies help you deploy the microservices defined in the script boxes to any platform and cloud. The orchestration engine in ElasticBox interacts with the cloud APIs to auto-provision virtual machines based on metadata from deployment policies. So it’s easy to spin up and destroy microservices on demand without disrupting service availability.

    ElasticBox can simplify microservices deployments. For instance the Jenkins ElasticBox plugin continuously integrates ElasticBox automation with Jenkins jobs to test and deliver what the software developments teams build continuously. So the next time you think SOA, think microservices instead.  Feel free to check out how ElasticBox can help.

  • 4 Ways the Cloud Has Influenced Applications Troubleshooting

    4 Ways the Cloud Has Influenced Applications Troubleshooting

    The rise of cloud computing has ushered in an era of unprecedented productivity for developers over the past several years. For those who have embraced this new world order, gone are the days of long lead times for hardware procurement and installation, architecture defined by slow-moving hardware upgrades, hardware-constrained scalability and flexibility, and a world where only sys admins have access to the infrastructure. But, as the barriers between development and delivery disappear, new challenges have emerged that can disrupt the lives of developers and slow down delivery of new products and features, giving back some of the efficiency gains that the Software-Defined Data Center (SDDC) created.

    Whether you’re new to the cloud, or you’ve been around since before cloud was cool, you are likely to see four common challenges emerge that can make troubleshooting your applications in the cloud more difficult. Let’s take a closer look at these common pain points first to help build awareness around the challenges, and then I will offer some suggestions for how to prevent these hurdles from tripping you and your team up when it comes time to unravel an application troubleshooting mystery.

    Shifting Ownership

    If you’re adopting the cloud with limited support from an operations team, or perhaps you’re one of the growing numbers of DevOps or even no-ops teams who find themselves bridging both the operations and development worlds, you will find that the responsibility of operating and supporting both your app and your infrastructure, at some level at least, will introduce a new dynamic that you may not have contemplated.

    True, the ability to roll your own architecture without the burden of dealing with physical devices is liberating and far more efficient. But, as developer tools, deployment tools, and cloud operations tools become inextricably linked to one another, the old boundaries between who is dev and who is ops become blurred or even get removed altogether. This means the dev team is suddenly an integral part of operations, whether by design or by default, adding yet another responsibility for developers whose chief mandate is often to go faster. The more time you spend in the operations realm, especially in troubleshooting your app or the cloud resources it depends on, the less time you are able to devote to adding new value through code.

    Lack of Transparency and Burden of Proof

    While it’s true that having the full benefits of the cloud available at the press of a button is awesome, you wouldn’t be faulted for having a bit of nostalgia about the “good old days” of being able to have a conversation with a real live person down the hall about real physical hardware that’s either healthy or isn’t (along with the ability to actually lay hands on it). An old familiar refrain when something went wrong with an app in production was for the burden of proof to rest initially with the ops team – prove the hardware is working, the network is healthy, and the SAN hasn’t lost disks before making the dev team dig in. Honestly, everyone was just hoping against hope that it was something “easy” in the infrastructure, because when it was the app, that’s when things got hard. Well, that script has been reversed with the cloud: now the burden of proof is on the dev team, because what’s really hard is finding a problem that originates with someone else’s complex, abstracted, virtualized data center.

    App returning a 500 error or performing poorly? If you’re using something delivered as-a-Service, such as database, queues, cache and the like, you won’t really have any visibility into health other than the cloud provider’s status page and whatever you can directly observe. It’s either working correctly and is speedy, or it isn’t; if it isn’t, life gets a lot murkier. Likewise, servers can be monitored, but you can’t really tell why your virtual resource’s performance has trailed off if you are the victim of something environmental that’s out of your control.

    And, no matter how good the support team is at your favorite cloud provider, it’s rare that they will be as responsive to your requests for more information on an issue as your own in-house ops team could be, and they won’t be as well-versed on your architecture. To varying degrees, you’re at the mercy of the cloud provider for consistent, reliable services, and it’s also up to them to offer timely insight when issues arise with the services you depend on. Your mileage may vary, of course, as to whether your cloud provider offers this level of communication and transparency. But, if they don’t, then the burden of proof rests squarely with you to show that the issue isn’t in your app. Quite a reversal of fortunes, isn’t it?

    Easy Complexity

    Compounding the challenge of sorting through infrastructure issues vs. code issues is the simple fact that applications are becoming far more complex, and in many cases, portions of the overall architecture may be transient in nature. Combine complexity with impermanence and you have a recipe for some real Sherlock Holmes-caliber mysteries at times.

    The incredible thing about an SDDC is that you can create nearly any kind of architecture required to support your application stack’s needs, all relatively easily – if you can dream it, you can build it. Want to cobble together .NET, Java, PHP, Node.js, Ruby, Database-as-a-Service for SQL and NoSQL, Message-Queues-as-a-Service, and Search-as-a-Service? From a cloud deployment perspective, it’s been made devilishly easy to deploy and get started. But, with that ultra-polyglot approach and a heavy reliance on software-defined services comes a new set of challenges:

    • First, you have a variety of services that are black boxes to you. Each of these services comes with its own set of tricks for gaining insight into performance and availability, but each one may be different in how you monitor and troubleshoot.
    • Learning how to support a variety of different technologies creates drag on your delivery velocity. It’s hard enough learning the performance and reliability tricks for a few technologies; trying it for a wide variety can draw focus from the real goals of building new value through software and making the business more successful.
    • Not every monitoring tool can support every technology stack, and the wider you cast the technology net, the harder it can become to support your full stack from a single monitoring tool.
    • If you’re using dynamic (transient) resources, such as scale-on-demand servers, you are quite likely to lose critical data that you need when troubleshooting a problem if you haven’t given thought to how you preserve critical insights that disappear with the server when it’s de-provisioned.

    More Frequent Change

    And, finally, we come to the double-edged sword that brought this all about in the first place: going faster! The increased agility that the cloud brings, especially when coupled with dev tools that are integrated into the delivery cycle (think PaaS environments), has a way of shortening delivery cycle times and increasing the number of releases crammed into a given week, month, and year. This is especially true in organizations who have also adopted agile development practices. Code can flow to production smoothly with greater frequency, and architecture changes can be made far more swiftly and easily. Unfortunately, with more frequent code releases and architecture changes comes more frequent opportunities to break something.

    A big part of the movement toward Agile and Lean is also the notion of always moving forward – rather than rolling back a release in the event of an issue, detect problems early and patch them quickly. To enable this mandate, however, requires two things that are often missing if you are coming from a slower moving environment or from a more traditional hosting model: 1) developer visibility into a baseline of behavior telemetry to know what “good” looks like historically; and, 2) instant feedback on the health of the application post-release relative to that healthy baseline. Without this, it’s hard to know if you’ve made gains or losses with your release – your users are often your only real barometer.

    So… How Do I Code More and Support Less?

    There’s no denying that the cloud has impacted the life of many developers, mostly in a very positive way. Of course, with new technologies and capabilities always comes a new set of challenges to overcome. In the case of cloud-hosted applications, this includes challenges to effectively and efficiently supporting those applications in their new environments so that the gains in productivity aren’t given back in support of the application.

    So, what can development teams to do adapt to and overcome these challenges?

    There are 3 basic steps that every development team should take to make supporting cloud-based applications easier.

    1. Establish Access, Process, and Protocol – The first order of business for helping developers support their cloud-based apps more effectively is giving them safe access to the information and resources they need. Unfortunately, all too often in cloud environments this is an all-or-nothing proposition – full login rights to servers and even potentially full rights to the management portal, or no access at all. Make sure to establish the correct access methods to your developers so that they have the visibility and access they need, without handing over so much control that it increases the likelihood of accidents.
    2. Design Supportability Into the Application – Once your application is in production, there are several common questions that you will needto be able to answer at a moment’s notice about your application: Is it (and everything it depends on) running? Are users satisfied with the performance? Is anything silently failing and frustrating users without setting off alarms? If something failed, whowas impacted, and what caused the issue?There are also some things that simply cannot be measured and monitored from outside of the application, but which speak directly to the health and well-being of your application. To enable you to quickly answer the inevitable questions, consider incorporating the following:
      • If it moves, measure it. Report application metrics and KPIs from within your code in order to see events and data that would otherwise be locked away from you. Some events and metrics only you, the developer, have the power to expose. Knowing how your app behaves at a core level can provide levels of insight that prove invaluable when searching for troubleshooting clues. If you can configure monitoring and alerts for those metrics, even better. We’ve elaborate on this subject in this article Errors & Logs: putting the data to work
      • Log often, and log meaningfully. If you only report errors, you will lack the critical insights necessary to help point to the root cause of the error. By logging at, say, info or debug instead of just warn or error, you will have the breadcrumb trail you need to find it. It’s impossible to get the state of the system after the fact – you need to have logged it at the time of the event.
      • Centralize your insights. Remembering that life in the cloud can be both quite distributed, and quite transient, it’s always good to bring everything – logs, errors, custom metrics, and other telemetry – into a central location for normalization, correlation, and continuity. You may need the data, and what it tells you, well beyond the ephemeral life span of your cloud resource.
    3. Identify Health Baselines Early – Key information like message queue length, average request time, app pool resource utilization, custom metrics values, log and error rates, and more can all be charted for your application these days – monitoring and charting isn’t just the domain of ops tools any longer. Understand what your app looks like both when healthy and unhealthy, preferably starting with pre-production environments even, so that you can see how your application morphs from release to release as well as with different loads and as your architecture evolves. By baselining as far back as dev and QA, you can often catch problems well before they impact customers and send you and your team scrambling.

    Conclusion

    There’s no denying the cloud brings incredible capabilities to the lives of developers: speed, agility, flexibility, scalability, and more. As with any new, disruptive technology, new challenges are also par for the course. By applying some basic strategies for application management, monitoring and troubleshooting, you can have all of the advantages of the cloud without giving back the gains during those critical support engagements, and have happier team members and end users as well. At Stackify we believe we offer a solution to the issues presented in this article start your free trial today stackify.com/sign-up

    About the Author/Craig Ferril

    Craig Ferril StackifyCraig Ferril, COO at Stackify. Craig leads the operational aspects of Stackify, making sure that the business is as nimble as the development team. He brings with him a passion for applying Lean principles to software and business alike, along with 15 years of experience leading software engineering and IT operations for start-ups, SaaS companies, and large enterprises. His background included leading teams that supported production software, which is where his passion for Stackify’s mission of helping developers and DevOps teams originates from. A Renaissance man wannabe, Craig dabbles in everything from brewing beer, to photography, to driving on a race track at high speeds. Follow him on Twitter @cferril