The Operationalizing Kubernetes Virtual Summit will bring together Kubernetes and cloud-native community members for a unique learning experience focused on the tools and best practices you need in order to successfully secure and manage Kubernetes. Presented in a virtual reality environment, the event will take place on Oct. 1, at 10 a.m. EDT.
The Operationalizing Kubernetes Virtual Summit is a free, interactive virtual conference featuring a stellar lineup of Kubernetes and cloud-native experts, including keynote speakers James Strachan, Liz Rice, Priyanka Sharma and Tim Hockin.
James Strachan, distinguished engineer at CloudBees, is one of the four brilliant keynote speakers presenting at the virtual event. James is co-founder of Jenkins X, an open source project that helps developers automate their CI/CD processes for cloud native applications. James is also the creator of the Apache Groovy programming language and the Apache Camel integration framework.
In his keynote session “Using Jenkins, Jenkins X and Tekton with GitOps,” James will demonstrate how Jenkins, Jenkins X and Tekton can solve all of your cloud-native CI/CD requirements using a simple GitOps approach that is easy to set up, use and manage from Git.
AWS Container Hero, Liz Rice, will also make an appearance at the virtual conference as keynote speaker. Liz is vice president of open source engineering at Aqua Security, where she works on container-related open source projects, and she’s also chair of the CNCF’s Technical Oversight Committee.
Another CNCF member joining as keynote speaker is Priyanka Sharma, general manager at CNCF. Priyanka was previously the director of Cloud Native Alliances at GitLab, where she built the developer evangelism team that participates regularly in the cloud native community. Priyanka has contributed to several CNCF projects such as Jaeger and Vitess and was a founding team member of the OpenTracing standard.
During her talk, “What 6.5 Million Developers Have in Common: Kubernetes,” Priyanka will share some interesting findings from research done by CNCF on the cloud-native ecosystem and will also discuss Kubernetes and cloud-native trends and best practices.
Last but not least, Tim Hockin, principal software engineer at Google, will be interviewed for the keynote session “Operationalizing Kubernetes: Interview with Tim Hockin.” Tim works on the Google Kubernetes Engine (GKE) and is co-founder of the Kubernetes project. He has also worked on Google’s Borg and Omega projects as well as the Linux Kernel.
As Kubernetes keeps gaining traction in mainstream IT environments, the next big challenge IT teams will face is operationalizing the platform at scale. But, is the Kubernetes ecosystem mature enough to operationalize at scale? Attend Tim’s keynote session to find out.
Join this interactive, multi-track virtual conference and learn how thought leaders are embracing containers and microservices environments, leveraging cloud native technologies and enabling digital transformation with Kubernetes.
You can hear from these keynote speakers and more than 30 other expert speakers at Operationalizing Kubernetes Virtual Summit. To check out the agenda, the full lineup of speakers and to register (for free), visit the Operationalizing Kubernetes Virtual Summit website.
A business application that fails to operate 24/7 would be considered inefficient in the market. The idea is that applications run uninterrupted, irrespective of a technical glitch, feature update or a natural disaster. In today’s heterogeneous environment where infrastructure is intricately layered, a continuous workflow of application is possible via self-healing.
Kubernetes, which is a container orchestration tool, facilitates the smooth working of the application by abstracting machines physically. Moreover, the pods and containers in Kubernetes can self-heal.
In the Avengers movie, Captain America asked Bruce Banner to get angry so he could transform into The Hulk. Bruce replied, “That’s my secret Captain. I’m always angry.” You must have understood the analogy here. Let’s simplify: Kubernetes will self-heal organically, whenever the system is affected.
Kubernetes’s self-healing property ensures that the clusters always function at the optimal state. Kubernetes can effectively self-detect two types of objects—podstatus and container status. Kubernetes’s orchestration capabilities can monitor and replace unhealthy containers as per the desired configuration. Likewise, Kubernetes can fix pods, which are the smallest units encompassing single or multiple containers.
The Three Container States Include
Waiting: created but not running. A container, which is in a waiting stage, will still run operations such as pulling images or applying secrets, etc. To check the waiting pod status, use the following command:
Along with this state, a message and reason about the state are displayed to provide more information.
Running Pods: containers that are running without issues. The following command is executed before the pod enters the running state:
Running pods will display the time of the entrance of the container.
Terminated Pods: a container that fails or completes its execution. The following command is executed before the pod is moved to terminated:
Terminated pods will display the time of the entrance of the container.
Kubernetes’ Self-Healing Concepts – Pod’s Phase, Probes and Restart Policy
The pod phase in Kubernetes offers insight into the pod’s placement. We can have:
Failed Pods–minimum one container failed and all containers terminated.
Unknown Pods.
Kubernetes execute liveness and readiness probes for the pods to check if they function as per the desired state. The liveness probe will check a container for its running status. If a container fails the probe, Kubernetes will terminate it and create a new container in accordance with the restart policy. The readiness probe will check a container for its service request serving capabilities. If a container fails the probe, then Kubernetes will remove the IP address of the related pod.
Liveness probe example:
The probes include:
ExecAction–to execute commands in containers.
TCPSocketAction–to implement a TCP check w.r.t to the IP address of a container.
HTTPGetAction–to implement a HTTP Get check w.r.t to the IP address of a container.
Each probe gives one of three results:
Success: The container passed the diagnostic.
Failure: The container failed the diagnostic.
Unknown: The diagnostic failed, so no action should be taken.
Demo Description of Self-Healing Kubernetes
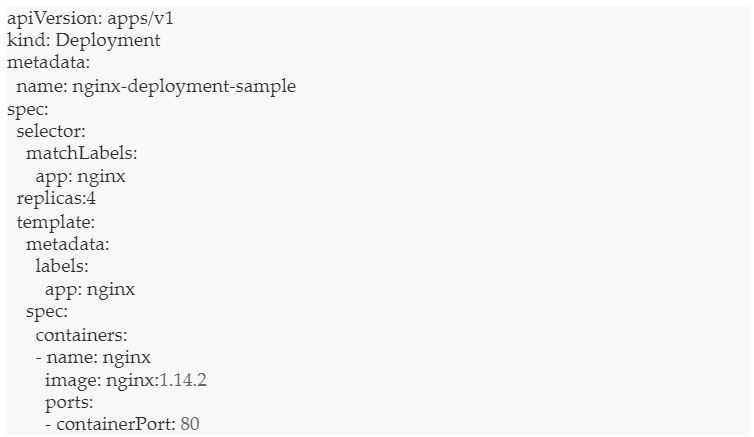
We need to set the code replication to trigger the self-healing capability of Kubernetes.
Let’s see an example of the Nginx file:
In the above code, we see that the total number of pods across the cluster must be four.
Next, let’s deploy the file.
Let’s list the pods, using:
Here is the output:
As you see above, we have created four pods.
Now, let’s delete one of the pods.
The pod is now deleted. We get the following output:
Let’s list the pods again.
We get the following output:
We have four pods again, despite deleting one. Kubernetes has self-healed to create a new node and maintain the count to four.
Conclusion
Kubernetes can self-heal applications and containers, but what about healing itself when the nodes are down? For Kubernetes to continue self-healing, it needs a dedicated set of infrastructure, with access to self-healing nodes all the time. The infrastructure must be driven by automation and powered by predictive analytics to preempt and fix issues beforehand. The bottom line is that at any given point in time, the infrastructure nodes should maintain the required count for uninterrupted services.
When a Kubernetes deployment suffers a security breach, it can be difficult for security teams to diagnose and identify the source of the intrusion and its impact. Each Kubernetes cluster may host multiple applications, and each application may be composed of dozens or even hundreds of interacting microservices deployed as pods.
The complex and dynamic communication between the applications’ components, as well as the automated Kubernetes orchestration activities, makes it difficult to understand the structure of each application and differentiate between normal behavior and malicious behavior from the observed network activity. The ephemeral nature of pods, which may exist only for moments to perform an activity before they are disposed of, makes this task even more difficult. A pod that was vulnerable may be gone by the time security teams are investigating a breach, or resume normal operation as the attacker pauses its abuse or pivots or escalates the attack to another Kubernetes resource.
K8s is by nature dynamic, flexible and scalable, and it is this same advantage for cloud native application developers that becomes a challenge for security professionals. How can one understand the source of a breach, let alone how it propagated through the system, without deep understanding of the architecture of the application?
One solution to the problem of tracing breaches is to examine the Kubernetes audit logs since they record all cluster-administration activity, even for pods that may have existed for seconds and are now gone. But K8s audit logs are complex and often convoluted, requiring deep expertise to understand. Therefore, security teams need to not only increase their proficiency with K8s audit logs, but also to apply automation and software tools to the K8s logs to detect suspicious behavior after the fact and even during their occurrence.
In fact, there are many potential threats that can be discovered when observing audit logs for suspicious behavior. They include:
Stolen or misused credentials, enabling hackers to gain access to K8s-based clusters or pods.
Misconfigured Rules Based Access Control (RBAC), enabling lateral attack propagation, privilege escalation and unauthorized data access or manipulation.
Exploitation of vulnerabilities in the Kubernetes API Server, enabling bypassing of authentication, authorization, admission control or validation of cluster administration requests. This lets users gain access to privileged and sensitive resources.
Violations of security policies diverge from compliance requirements and best practices.
Detect Breaches in Near Real Time by Watching K8s Audit Logs
There may be a vast time span between an initial breach and the detection of the compromised application or the unauthorized access of secure data and private information. Security teams must seek to close the gap between a breach attempt and its detection as much as possible, while still being able to diagnose the causes of a breach after it has been detected and assess its scope and impact.
Since K8s deployments can be vast and intricate, machine learning and artificial intelligence are preferred tools to monitor audit logs and flag suspicious behavior. An automated tool could continuously scan logs to learn what normal behavior looks like in the company’s clusters, and then flag network behavior that is unusual or suspicious for security teams to qualify, prioritize and investigate. This methodology would enable security teams to investigate possible security violations in near real time to protect and secure the applications.
In addition to detecting security risks, security tools that leverage K8s audit logs should provide reporting that is easy to understand and consume by security teams. By providing the correct user experience, companies can make their K8s logs accessible to more than the hard-core experts, effectively opening a new vista of security possibilities for more security professionals. The difficult learning curve of Kubernetes will no longer be a wall between K8s pros and newcomers with less experience, relieving pressure from understaffed security teams.
Step Up to Security and Compliance Needs
As Kubernetes moves toward the mainstream, with roughly 71% of Fortune 100 companies using Kubernetes as their main container orchestration tool, companies must also look toward compliance with standards and government regulations designed to protect financial transactions and private or personal information such as PCI, GDPR and HIPPA. The penalties for violating these standards and regulations can be severe, so companies should proactively adopt K8s audit log monitoring as a way to identify breaches earlier, to limit their impact on customers and data, and to document the behavior of the application and would-be hackers for possible legal inquiries. An effective audit log strategy will be vital in determining what happened in the case of a breach.
Leverage Audit Logs for Real-Time Security Observability in K8s
Many tools exist to secure the perimeter of the data center and to identify possible security risks during application development. The benefits of analyzing and leveraging Kubernetes audit logs at runtime have been relatively overlooked. K8s audit logs are a prime way to comprehend the behavior of any cloud-native application orchestrated by Kubernetes, as well as the best way to comprehend how the Kubernetes infrastructure itself can be abused by an attacker to compromise the applications it is hosting. As such, security teams have a responsibility to deploy tools and gain a proactive, real-time view into K8s audit logs in order to minimize the time between breach and remediation and to validate compliance conformance at runtime. Such a thoughtful approach to Kubernetes security will go a long way to protect your deployments from harm.
To learn more about containerized infrastructure and cloud native technologies, consider coming to KubeCon + CloudNativeCon EU, in Amsterdam. The CNCF has made the decision to postpone the event (originally set for March 30 to April 2, 2020) to instead be held in July or Aug. 2020.
Kubernetes and Docker are two of the most commonly heard buzzwords in modern DevOps conversations. Docker is a tool that enables you to containerize and run your applications, and Kubernetes provides you with a platform to orchestrate or manage these containers—since managing thousands of containers manually using the Docker CLI would be a practical nightmare.
However, simply running thousands of containers and managing them through Kubernetes is not enough. You have to observe and analyze them properly to ensure that your services are up and running optimally. This process is called Site Reliability Engineering (SRE), a term initiated and popularized by Google. Observability and analysis are a major element of SRE. It can be subdivided into the following three areas:
Monitoring allows you to extract numerical metrics from your applications and resources that can later be visualized and analyzed to present the current state of your resources. Once the metrics are extracted, they can be used to set up alert rules, facilitate profiling and debugging, and make better SRE decisions.
Logging enables developers to debug their containers in case of a failure. Containers are short-lived, and so are logs. Kubernetes and Docker do provide a native way of browsing container logs, but it is very limited in its functionality. As a result, a centralized log plane is a must in any container-oriented environment.
Tracing allows you to debug services running on a network and follow a request trail until the source of a problem can be determined. In a microservices architecture, when multiple services/containers send requests to each other to perform one business task, a proper tracing solution is necessary.
This article will list and describe the most effective open source tools for monitoring and analyzing services running as containers.
Prometheus
Prometheus is the first tool that comes to mind when discussing open source monitoring solutions. It is very popular in the development community, and it is a graduate of the CNCF project, which focuses on the monitoring side of SRE. Originally created and open sourced by SoundCloud, Prometheus simplifies the process of pulling numerical metrics based on a time series from a given metrics endpoint. It was built to monitor highly dynamic container environments.
Prometheus is subdivided into three elements: Prometheus server, Alertmanager and exporters. Exporters are stand-alone, independent processes/containers that can be run on your target resource to generate and export metrics via a metrics API. The Prometheus server then takes care of service discovery as well as pulling metrics from the exporters to be stored in the Prometheus DB and later used for visualization or alerting. Alertmanager is responsible for setting up alert rules, analyzing the data in the Prometheus DB and sending alert messages to multiple receivers if a certain rule is triggered. There are a huge number of exporters, listed here, which are both officially supported by Prometheus and maintained by the community.
Prometheus has become the industry standard for monitoring cloud-native architectures. While it is known for its simplicity with service discovery, its ease of use, its alerting capacity and its integration with Kubernetes, its polling architecture is not ideal. Currently, the metrics endpoint has to be reachable by the Prometheus server. However, there is a pushgateway implemented in Prometheus that enables metric pushing rather than polling. Another downside of Prometheus is that it doesn’t scale well. This problem can be fixed in the Thanos adaptation of Prometheus.
Related tools and technologies: Grafana, Cortex, Thanos, Prometheus Exporters, Alert Manager, Istio, Prometheus Operator.
Grafana is an open source metric analytics and visualization suite. It allows you to create custom dashboards using data taken from multiple sources, such as Prometheus, Elasticsearch, MySQL, Postgres and Redis. Furthermore, Grafana has its own alerting system and a role-based access control (RBAC) system for software. As a data visualization tool, Grafana is famous among Prometheus users for enabling them to effectively visualize the metrics stored in Prometheus. There’s a wide array of official and community-built custom dashboards for various data sources in Grafana, allowing users to easily set up dashboards (found at this link) and get on with monitoring. Grafana offers another associated product called Loki, which aggregates logs in Kubernetes and integrates well with the Grafana UI.
Related tools and technologies: Loki, Prometheus.
Figure 2: Kubernetes Resources Dashboard in Grafana. Source: Replex.
Elastic Stack
Elastic Stack is a group of open source products from Elastic designed to help users search, analyze, and visualize data from any type of source, in any format, in real time. This product was previously recognized as the ELK stack, where each letter of the acronym stood for one of the company’s main products: Elasticsearch, Logstash and Kibana. Elastic Stack provides both monitoring and logging solutions with the help of its big data database, Elasticsearch.
In order to aggregate logs, people tend to use Elasticsearch for storage, Logstash or Fluentd for log streaming, and Kibana for visualization. Fluentd is not part of the Elastic Stack, but it is widely used with Kubernetes to stream logs in place of Logstash, the tool provided by Elastic Stack. Similarly, Metricbeat is used to scrape metrics and set up visualizations on Kibana. The enterprise version of Elastic Stack ships with X-Pack, a set of additional tools that enables reporting, alerting and role-based access control (RBAC), among other features. By default, the Elastic Stack GUI, Kibana, does not support RBAC. You have to use the previously mentioned enterprise version of Elastic Stack to enable it.
Related tools and technologies: X-pack, Metricbeat, Logstash, Kibana.
Figure 3: Discover View in Elasticsearch. Source: XpresServers.
Sensu Go
Sensu Go is a telemetry and service health checking solution for multi-cloud monitoring at scale. It allows you to gain visibility into servers, containers, services, applications, functions and connected devices across any public or private cloud. Sensu can be run side-by-side with Prometheus to get the best out of both solutions, or it can be run natively without Prometheus. Sensu works best alongside Prometheus, since exporting application level metrics to Prometheus requires loading the Prometheus SDK to your application codebase and exposing a metrics endpoint. The endpoint is then scraped and stored in the Prometheus Server. This may sound like a lot of work—and, sometimes, it is. Sensu avoids this complexity by using a sidecar concept. A Sensu agent is deployed alongside your application. The agent constantly collects and exposes metrics to the Prometheus server without your having to change the application codebase.
Sensu works without Prometheus too. It can operate natively in Kubernetes, where it has its own server to store and visualize metric data exposed by the previously mentioned Sensu agent.
Sysdig has two open source products: Sysdig Inspect and Falco. Here, we’ll focus on Inspect, which monitors and captures the container processes running in your system and allows you to drill into those processes for post-incident forensics. This enables you to analyze your application performance, troubleshoot errors and monitor any processors that could be misbehaving. Furthermore, if your system is breached, Sysdig allows you to understand how the breach occurred and what data was taken in the process. Sysdig Inspect is a very powerful tool that focuses on the performance tuning and security investigation of your system.
Related tools and technologies: Grafana, Sysdig, Sysdig Falco.
Jaeger is an end-to-end distributed tracing solution that was open sourced by Uber Engineering. It allows you to monitor and troubleshoot transactions in complex distributed systems. In modern microservice architectures, the majority of operational problems fall under the umbrellas of networking and observability. When a service failure occurs, you have no idea how the requests have gone from service to service over the network to complete a single business transaction. This makes debugging extremely difficult. Currently incubating under CNCF, Jaeger uses tracing to enable root cause analysis, performance and latency optimization, and distributed transaction monitoring. Jaeger works out of the box with Istio, a popular service mesh implementation open sourced by Google.
Related tools and technologies: Prometheus, Jaeger, Zipkin, Istio.
These tools are widely used in the tech industry, and they all have their benefits. Most of these solutions, however, require skilled implementation and ongoing manual maintenance that can be a burden for DevOps teams and a distraction from the business. There’s no one solution that can cater to all of your requirements, since each tool focuses on one or two specific aspects of observability and analysis. By mixing these tools together, you can derive a unique solution for your individual business needs.
For ease of comparison, the chart below outlines the features offered by each of the tools discussed in this article.
Containerized microservices are taking over the software world. These services provide developers a way to quickly create and deploy cloud-native applications. However, containers aren’t perfect. Orchestrating and managing container deployments can be a serious challenge.
To help ease this challenge, service meshes were developed. In this article, you’ll learn about service meshes components and architecture options. You’ll also learn how services meshes can improve your container deployments.
What Is a Service Mesh?
A service mesh is a dedicated communication layer that sits on top of your request/response layer. It works similarly to a Container Networking Interface (CNI), which controls the connection of your services to your network. A service mesh sits on top of your CNI, adding additional functionality, such as service discovery or security. A service mesh is not a replacement for a CNI or a service orchestration platform.
Services meshes are designed for use with containerized microservices. You can use this technology with any container or container orchestration tools. However, the most active projects seem to favor developing service meshes for Kubernetes.
Service Mesh Architectures
When deploying a service mesh, there are three architectures you can choose from.
Library
The library architecture employs a library that is imported in an application’s code and runs from inside the application. Using a library eliminates the need to call out to a remote service, making it more secure.
Libraries make it easier to allocate resources since all work is contained in the microservice running the library. A library architecture works well for in-house applications that are written in one language. Third-party applications are difficult or impossible to add the library to.
Node Agent
A node agent architecture uses a node agent or daemon that serves all containers on a particular node. A node agent architecture is language-agnostic since it doesn’t run from inside your microservice. It can be used with in-house and third-party applications. However, node agents must be coordinated with infrastructure processes, making this architecture more complex to deploy.
Node agents require less memory than sidecars since information can be shared across a node. This architecture employs work resource sharing, with dynamically shared resources, making it easier to scale. The downside of sharing, however, is that it can be abused, with one service hogging all available memory.
Sidecar Proxy
A sidecar proxy architecture uses sidecars that run alongside your containers. The sidecar handles all traffic into and out of the container it is attached to. Sidecars do not require coordination with your infrastructure since one proxy is assigned to each container. This lack of coordination makes sidecars easier to set up than node agents.
Sidecars only serve one pod and are not influenced by other pods. This isolation makes this architecture better for zero-trust deployments as each container is accountable for its own actions. Sidecars can be added to containers at any time, enabling you to easily scale processes.
Use Cases For Service Meshes
Service meshes are an emerging technology, with new use cases being actively developed. The three use cases introduced here are just the ones that are currently most common.
Improving Security
Containers are isolated environments and generally considered to be more secure than traditional applications. However, containers still contain vulnerabilities, such as possible abuse of root access.
Service meshes can help address security concerns by providing:
Zero-trust security—any communication, either from inside or outside requires verification. Verification prevents compromised containers from interfering with other microservices or your broader system. It restricts a container’s actions and communications to that container alone.
Communication tracing—enables you to collect communications information and isolate errors or issues. If a container is communicating in an unexpected way or against protocol, you can identify it. Once identified, you can easily replace the container with an uncorrupted image or remedy the issue. Tracing enables you to pinpoint possible attacks, including where attackers came from and what they’re trying to accomplish.
Improving Delivery
Containers already improve on application and service delivery by making it easier to release and patch services. Service meshes expand upon these capabilities by improving application and performance monitoring functions.
Service meshes can also help improve service delivery by enabling:
A/B testing—provides advanced routing, enabling you to divide traffic between A and B versions. This routing makes it simpler to set up A/B testing. Additionally, tracing features enable you to gather and analyze user traffic and interactions.
Rapid versioning—new versions can be released with zero downtime and reduced risk. Containers can be started and verified healthy before traffic is gradually shifted between versions. If issues arise, changes can be rolled back without system-wide consequences. Easier corrections enable you to relax delivery requirements with minimal risk.
Improving Availability
Containers can provide improved availability, depending on your hosting configuration and resources. Service meshes can expand upon these abilities by improving load balancing, traffic management and health monitoring functionalities.
Service meshes can also help improve availability by enabling:
Resilience testing—enables you to test how services respond with fault injections. Service meshes enable you to test your services’ fault tolerance. Increased understanding of how faults affect resilience helps you identify and correct vulnerabilities. Greater service resilience leads to greater availability.
Deployment and request shadowing—enables you to simulate anticipated traffic flow and see how services respond. Shadowing enables you to test the traffic and workload capacities of your services. With this information, you can determine whether you need to scale resources and connections. Proper scaling ensures that your traffic needs are met and prevents traffic bottlenecking and decreased availability.
Conclusion
As microservices become standard, teams are placing an increased focus on improving container performance and security. The development of service meshes is a result of this increased focus.
Hopefully, this article helped you understand what service meshes are and how this technology can help improve your container deployments. If you’re interested in seeing how a service mesh might help you, check out this tutorial explaining how to build a service mesh.
There was a time when SUSE was considered to be the second-biggest force driving the adoption of Linux in the enterprise, after Red Hat. Then came an odyssey to rival any epic written by Homer. A few short years after moving its corporate headquarters from Germany to Oakland, California, the company was sold to Novell, which was then later acquired by Attachmate. Three years later, Attachmate was acquired by Micro Focus. Three years after that, SUSE (as an arm of Micro Focus) acquired distributions of OpenStack and the Cloud Foundry platform-as-a-service (PaaS) from Hewlett-Packard Enterprise (HPE).
That brings us to 2018, when SUSE was spun out of Micro Focus to become an independent company once again, headquartered in Germany once again. A year later Melissa Di Donato, formerly chief operating officer (COO) of SAP, was named CEO of SUSE. A few months after that, SUSE announced it would withdraw its distribution of OpenStack from the market to focus its efforts on emerging cloud-native opportunities stemming from the rise of Kubernetes.
For SUSE, those opportunities arise from a distribution of Kubernetes deployed on its Linux operating system, which also serves as the foundation for its container-as-a-service (CaaS) environment, along with a version of Cloud Foundry deployed on top of Kubernetes.
Brent Schroeder, global CTO for SUSE, said his company’s strategy is being driven by an acute need for increased flexibility. IT environments are inherently becoming hybrid as more workloads move to the public cloud, and many organizations will want to leverage a common substrate based on Kubernetes for building and deploying applications. In some instances, Kubernetes will be deployed on top of virtual machines, while in other use cases Kubernetes will be deployed on bare-metal servers. IT organizations will then decide to deploy a CaaS or PaaS depending on their requirements, said Schroeder, noting that regardless of the path chosen, IT modernization initiatives will create a significant opportunity for SUSE.
“Virtual machines, bare-metal and the cloud will be a huge catalyst,” said Schroeder.
DevOps, of course, is playing a major role in driving those transitions, which Schroeder said has become a major focus for SUSE as organizations think through how to not just build and deploy applications faster, but also secure and govern those processes. That latest version of SUSE CaaS Platform 4, for example, added support for Cilium open source project for securing network connectivity between containerized application services.
Of course, SUSE is not the only IT vendor making this journey. Red Hat was the first to deploy a PaaS environment on top of Kubernetes and since then has been on a mission to obliterate the distinction between a CaaS and a PaaS environment. As an arm of IBM, Red Hat has also significantly expanded its market research as IBM builds out a hybrid cloud computing strategy based on the Red Hat OpenShift platform.
Of course, Red Hat’s acquisition by IBM might create new opportunities for SUSE. After all, more than a few of the IT organizations that opted to embrace Red Hat OpenShift had plenty of opportunities to consider alternatives from IBM. Now that the acquisition has been finalized, some of them may be reconsidering their options.
It’s too early to say when SUSE might arrive at its ultimate destination. When venture capitalists buy a company such as SUSE the goal is to either take the company public or recoup the investment by selling it to another entity. Whatever the outcome, it’s clear SUSE intends to leave its mark in the brave new world of containerized applications.
Kubernetes is rapidly emerging as the standard for application management in the data center. Kubernetes defines applications in a container model for deployment and delivers most of the software-as-a-service features of virtualized infrastructure at a lower cost and with less performance degradation. In this article we’ll cover the intersection of Kubernetes and scale-out data-intensive applications, what problems Kubernetes solves for those applications and why composable infrastructure provides the remaining piece for a total solution.
For heavy-duty data-intensive applications, such as Spark, Kafka, Aerospike, Vertica, Cassandra and Elasticsearch, ML-model training/service with TensorFlow, Kubernetes promises a common application orchestration solution. These applications are termed scale-out because they allow additional performance and capacity to meet any use case simply by adding more nodes. The challenge introduced by these applications is managing large production deployments of each application, compounded by managing multiple applications each with their own configuration requirements. Kubernetes provides an answer here for managing these disparate data-intensive, scale-out applications with a common container orchestration platform.
Scale-out applications are distinguished from typical enterprise applications in three ways. First, scale-out applications take a divide-and-conquer approach to problem solving: if you have a bigger problem simply deploy additional capacity and performance by adding nodes. Second, since performance and data capacity are simply increased by adding building blocks, you can exploit cheap commodity-off-the-shelf (COTS) nodes, avoiding the money pit that is the case in big iron hardware purchases required by traditional scale-up applications. Third, the data-intensive applications typically integrate an optimized storage stack within the application itself that effectively uses the cheap local storage available within the COTS nodes. The last point has become a problematic area for scale-out application deployment as overprovisioning is now common to overcome the difficulty in predicting workload behavior at initial deployment time.
Composable infrastructure tackles the last problem presented by embedded local storage for data intensive applications. Looking back over various transformations in the data center, one thing the legacy enterprise storage vendors got right was separating compute and storage. Both during acquisition and throughout the application lifecycle, separating persistent storage components from compute nodes running the actual application yields opportunities for cost efficiencies and flexibility.
Composable infrastructure brings the capability of separating compute from storage for these scale-out applications, which sport their own embedded optimized storage software stack because it does not dictate a new storage architecture, it simply says “take your existing servers with embedded local storage and disaggregate them”–placing the storage on the ubiquitous high-speed low-latency fabric you’ve already deployed for your applications: Ethernet. From the application perspective in a composable infrastructure, storage still appears local and the application runs as it did before.
In this way, applications run unchanged and the infrastructure they run on can be expanded, reduced or replaced in real-time. This is true software-defined infrastructure where infrastructure is treated as code. Being able to modify the node configuration ratio of compute and storage dynamically avoids the issues of purchase time lock-in of possibly under-provisioned nodes (which has simply led to overprovisioning). Composable infrastructure eliminates the downside of purchasing static resources that define the resources available before the workload is run.
Kubernetes launched not long ago in 2015. Many of the early adopters of Kubernetes focused on stateless applications that did not depend on persistent storage to deliver useful services. It is only recently that support for persistent storage emerged (an obvious requirement for data-intensive applications). After a couple of approaches to persistent storage integration, the key players in Kubernetes (and other container orchestration platforms) settled on an orchestration-independent persistent storage API, the Container Storage Interface (CSI). The CSI provides a standard method for storage providers–and composable infrastructure providers–to define and attach persistent storage to containers.
Why should you be interested in composable infrastructure when considering how to deploy your data-intensive applications on Kubernetes? Because Kubernetes only provides application and container orchestration–it does not fundamentally change the way the application works. These data-intensive applications were defined to exploit, and are most efficiently deployed, over COTS node and commodity storage. Each application still has its own storage stack, each carefully optimized for their particular workload. It is likely that deploying storage appliances, or software-defined storage solutions that aggregate pools of HDDs or SSDs, under data-intensive applications will only result in degraded performance and unnecessary costs.
A composable infrastructure solution is only useful as an underlayment for a Kubernetes deployment if it meets several requirements.
First and foremost, the composable infrastructure must scale to 100,000s of devices in support of the applications being deployed on top of the platform.
Second, the composable infrastructure platform must not destabilize or diminish Kubernetes capabilities and scale accordingly with commodity networking in mind. The composable infrastructure solution must share a similar design philosophy with Kubernetes, allowing it to scale. Kubernetes implements a distributed desired state model where work is distributed amongst the mostly autonomous nodes to reach a desired deployment configuration. Such an approach provides scaling on the order required by hyperscalers. You must ensure the composable infrastructure solution you choose provides a similar scalable approach.
Third, Kubernetes emphasizes a configuration state that is durable in the face of any individual node failure or network partitions. Durable configuration state in the face of large, highly interconnected commodity component deployment is critical for correct automatic operation at scale of business-critical applications, and your composable infrastructure solution must similarly support this.
Fourth, Kubernetes defines a model for application deployment in terms of groups of containers called Pods. For a manageable persistent storage solution, the support for CSI and Kubernetes must provide a native Pod view of the storage bindings since the Pod (the managed set of containers) is the proxy for an application node instance and the unit of expansion and migration.
Kubernetes has ushered in an exciting new chapter in data center architecture by providing a lightweight, richly featured application software orchestration platform. Think of Kubernetes as the ideal software application orchestration platform. What is missing is the scalable hardware orchestration solution that supports the dynamic model for application orchestration that Kubernetes defines. A feature rich, well-integrated composable infrastructure platform provides the needed hardware orchestration to enable the application migration and elasticity promised by the Kubernetes solution.
Containers have been around for some time, but only recently has the technology become mature enough for large enterprises to adopt it both on-prem and in the cloud. The obvious benefits for developers include the ability to dramatically reduce the time to production and the ability to lower the operational burden. This is further supported by implementing a service mesh which provides fast, reliable and secure communication among containerized infrastructure.
The Rise of Kubernetes and its Impact on Security
Kubernetes (k8s), introduced late 2014, bring container orchestration at large scale to both cloud and on-prem environments. The benefits of using k8s is clear and stipulated mainly due to the ability to become agnostic to the infrastructure. An application based on k8s can easily scale out from your datacenter into multiple cloud providers, and back. However, the challenge with Kubernetes is it creates a huge problem for security operations. Trying to enforce micro-segmentation on a large k8s cluster using traditional firewall models is not feasible.
As the move to containers rise, so will container-based cybersecurity attacks. Criminal hackers will always be on the hunt for new ways to exploit this area. As container operations are inherently dependent on the development pipeline (CI/CD) so should be their security attributes. Any other interaction point will be an afterthought resulting in slower operations or reduced security. Organizations moving to containers and k8s should act preemptively due to on-going and increasing complexity driven by scale.
Enter Service-Mesh
Implementing a service mesh layer ensures that communication among containerized infrastructure services is fast, reliable and secure. It is a configurable, low‑latency infrastructure layer that handles service-to-service communication. It is responsible for the reliable delivery of requests through the complex topology of services that make up a modern, cloud-native application. In practice, a service mesh is typically implemented as an array of lightweight network proxies called sidecars, that are deployed alongside application code without the application being aware. The mesh provides critical capabilities, including service discovery, load balancing, encryption, observability, traceability, authentication and authorization, and support for the circuit breaker pattern.
Criteria and Security Best Practices
Pre-scanning of images isn’t enough. Enforcing runtime micro-segmentation for container services should be addressed at runtime as they introduce an easier, more prominent attack vector.
Easy integration with development pipeline. As noted, the alternative will impact business agility or security quality.
Micro-segmentation should be decoupled from the infra and network as otherwise, it will require some kind of application to IP/PORT/protocol mapping.
Implementing security built for k8s environments and running both on-prem and in the public cloud that uses Istio, a well-known open-source service mesh developed by Google, is recommended. Vet solutions connect directly to the code pipeline with enhanced security capabilities, such as the signing of artifacts that will be deployed to the k8s cluster in the code stage with the ability to generate signed identities. Instead of looking at machines and IPs when workloads boot up, the administrator will see that services will be able to control where they run.
This will also enable you to intuitively create identity-based micro-segmentation. This is an advantage since micro-segmentation was always a complicated task to achieve, requiring administrators to map an application to the network while keeping track of what is running in the environment.
With identities and a service mesh layer, it is only necessary to focus on your business logic. The fact that identities were generated during the CI/CD pipeline, provides the ability to control the application without the need for service discovery. Identities are represented by their business-context names, originating in the CI/CD pipeline, so the operator can easily group them together and assign policies at different layers of granularity.
K8s is a great technology that enables the harvesting of containerized environments. Adopting it can accelerate your organization’s digital transformation dramatically, but it can also require you to adopt new methods of application security. Contracting with a k8s-focused security organization will allow the business to accelerate its migration to cloud-native applications on-prem and in the cloud, in a most automated fashion.
By providing the needed security and operational capabilities, k8s clusters admins are afforded an enterprise-level micro-segmentation solution with policy orchestration, single pane of glass to your clusters in a multi/hybrid cloud deployment and the ability to connect between containerized clusters and legacy applications, as well as other resources that are external to the cluster.
Containers hold new promise for business and digital transformation. Yet many differences exist between monitoring containers and monitoring other elements of infrastructure, such as VMs, storage, memory and compute. Understanding those differences is vital for ITOps managers as they navigate their businesses’ digital transformation.
Interestingly, the differences are as much technical as they are organizational. Companies need to explore these differences and consider questions such as, how to ensure that a container-based project performs when it goes into production, and what changes you must make to infrastructure to ensure you have enough compute and storage power to support the containerized applications your development team is going to launch.
The essence of container management is to be prepared for the changes coming from application development, which means understanding resource and infrastructure as it is today to estimate the effect of those changes tomorrow.
Here are four differences ITOps managers need to consider with container management as they move their digital transformation journeys forward.
Containers Versus VMs
The signature feature of containers is they can hold and run an entire application all in isolation. VMs offer operating system level isolation, but at the cost of a much larger footprint; to begin with, each one has its own copy of the entire operating system. VMs are also far less portable than containers, especially when moving among private and public clouds and data centers. As a step toward digital business transformation, most companies are looking for DevOps tools and for ways to deploy their applications to the cloud, whether for QA or production. Organizations rolling out new applications are also gravitating to a container-based architecture from the start.
Advantages of adopting containers include:
Agility: Instantiating a new container goes as much as 20 times faster than instantiating a new VM. Startup is measured in seconds rather than minutes and once deployed, containers scale up and down rapidly in response to load.
Density: Most containers are megabytes in size rather than gigabytes. With their smaller footprint, containers allow for as much as five times greater density than VMs.
Cloud-readiness: Containers can be deployed to any cloud (private, public, virtual or physical) which opens up the possibility of using the same containerized application in hybrid and multi-cloud environments.
Blast radius: As software developers incorporate and release changes more quickly, they look for ways to control potential damage from bugs. A problem in a container is less likely to cause widespread damage and is easier to isolate and repair than a problem in an entire VM or physical server.
Cost savings: Every VM requires a hypervisor and an operating system (OS), which can involve licensing and fees. Containers run side by side, sharing the OS kernel of a single physical machine while holding isolated copies of specific library versions they depend on. Architecturally, VMs tend to contain more components and require greater allocation of resources. Containers, on the other hand, tend to hold a specific component or a single micro-service, minimizing resource overhead.
Containers, DevOps and Real-time Monitoring
A company adopting DevOps to speed up deployment of its software products automates as many development processes as possible and relies heavily on automation scripts to move code along, from continuous integration through continuous deployment and continuous delivery (CI/CD/CD) to production. Along the way, multiple developers must check in on new changes. Automated processes, such as health checks and unit testing, take place and then the build is deployed to the next environment, such as integration or QA. With each set of changes, ITOps needs the answers to several questions:
How will this affect performance?
What will be the impact of the changes when we deploy?
Do we have enough compute, storage, memory and networking to support the changes?
In a traditional environment, developers have plenty of time to answer those questions. But if they’re deploying modern, containerized, cloud-based applications, that window tends to be much smaller which can lead to the kind of guesswork that makes ITOps uneasy. That’s where container monitoring comes in. When ITOps can see real-time and historical analytics of containers and their hosts, across physical, virtual and cloud environments, they can create performance benchmarks to help them make informed choices about infrastructure.
Microservices Get Added into the Mix
Microservices are loosely coupled and independent services, each with their own release schedule and lifecycle. Developers are able to make small changes to elements of these applications which allows them to mitigate the risk of negative business impact by reducing the blast radius around those changes. In case of failure in a single change, there’s less to repair and less impact on surrounding, dependent services. We’re seeing developers move away from packaging a single application per container to packaging a single service of an application per container. This allows them to make changes more frequently and keep up with business demands.
Multiple Silos
The goal of DevOps is to bring application development and traditional ITOps closer together. However, container monitoring and management changes things. Traditionally, areas such as storage, network bandwidth, VMs and physical hosts that require monitoring have all been in the ITOps silo, an area that developers don’t typically own. Developers write code and build software in the application development silo and then hand the software off to the ITOps silo to run. However, things have changed and now developers aren’t only writing code, but also owning and using containers in the application development silo. Once the software and containers leave this silo, their consumption of resources like compute, storage, network bandwidth and memory will also affect the ITOps silo. That’s why monitoring and management is as necessary for containers as it is in areas like storage, VMs and physical hosts.
While container technology may be new for the traditional enterprise, the impact it will have on business transformation cannot be ignored. Containerization brings increased simplicity, consistency and portability to production environments, enabling faster IT delivery and increased performance, arming businesses with a new agility and allowing them to rapidly respond to changing customer needs. In fact, according to 451 Research, application containers will be a $2.7bn market by 2020.
The businesses that embrace this opportunity will be taking a vital step towards transforming into bustling digital enterprises that can deliver innovative products and top-notch customer experiences. To learn more about containerized infrastructure and cloud native technologies, consider coming to KubeCon + CloudNativeCon NA, November 18-21 in San Diego.
When it comes to managing IT, most DevOps teams are locked in an eternal struggle to balance innovation with reliability. There’s always a keen interest in being able to take advantage of the latest and greatest IT platform. However, new IT platforms don’t achieve the level of maturity required to build and deploy mission-critical applications overnight. Enterprise IT organizations often build an application on one platform and deploy it on another platform that is perceived to be more reliable.
But a global survey of 505 IT and other executives published by the Cloud Foundry Foundation (CFF) suggests that, at a time when adoption of microservices based on containers and serverless computing frameworks is rising, the need to strike a balance between innovation and reliability has never been more acute.
Conducted by ClearPath Strategies on behalf of the CFF, the survey finds serverless usage and container usage are now at 14% and 37% respectively. At the same time, adoption of platform-as-a-service (PaaS) environments such as Cloud Foundry has increased to 47% from 41% in the last six months.
The study also suggests the rate at which organizations are adopting serverless computing and containers is starting to plateau. However, organizations that have adopted serverless computing frameworks and containers are making greater use of these capabilities as they continue to mature, according to the survey results.
CFF CTO Chip Childers said it’s not uncommon for organizations now to deploy a PaaS and Kubernetes platforms alongside each other. In some cases, applications built using containers on a Cloud Foundry PaaS will be deployed on a Kubernetes run-time at the network edge. In other cases, applications built using development frameworks running on Kubernetes will be deployed on a Cloud Foundry PaaS that is perceived to be more reliable.
Of course, the percentage of organizations that are employing a PaaS environment is not nearly as high as those using a less opinionated framework for building applications. However, whatever the path chosen, Childers said multiple types of abstractions that simplify IT complexity will live alongside one another for many years to come. At the same time, the underlying technologies that enable those abstractions increasingly will converge. For example, the Cloud Foundry PaaS was built before Kubernetes existed. Now the CFF is moving toward replacing much of the Cloud Foundry substrate with Kubernetes.
According to the survey results, 65% of respondents place the most value on a platform that delivers a consistent experience. However, 59% also said a platform that integrates innovations is of the greatest value to their ability to develop software applications. In addition, almost two-thirds (63%) said a technology’s ability to integrate with their environment is the “touchstone” that makes technology better.
As is often the case, what constitutes a touchstone is in the eye of the beholder. However, DevOps teams are not likely to sacrifice reliability no matter how cool that next big thing in IT may or may not be.