Category: Containers

  • No-Nonsense Guide to Distributed Databases

    No-Nonsense Guide to Distributed Databases

    I got my first DBA job 15 years ago, and quite a few things have changed since then. The amount of data exploded, we saw the rise of NoSQL, and business logic moved away from being stored in relational databases to applications.

    To this day, the three pillars of reliability, scalability, and maintainability are the banes of a DBA’s existence. To spice things up, your monthly cloud bill for managed databases just made your CTO lose the will to live.

    So, now you have two extra things to worry about in addition to these three pillars: cost efficiency and vendor-agnosticism.

    In this article, I’ll (try to) run an open source, new-generation database, benchmark it and touch on some of the challenges of being cloud-neutral.

    TL;DR

    • Solving the SQL vs. NoSQL dilemma in the Kubernetes world
    • How to leverage a distributed SQL database in a multi-cloud world
    • Taming performance – single cloud versus multi-cloud
    • Running TPC-C as a transactional benchmark
    • Taming the costs – the question of egress costs

    New Packaging For a New Age

    Just five years ago, people were like, “Containerizing stateless microservices? Sure! No problem.”

    But when you actually containerize a database, your persistence layer is asking for trouble.

    Over time, containers grew on us. Now, it’s the default way of packaging and shipping software. Heck, even AWS Lambda caved and started running container images. Databases just couldn’t resist.

    Once a database is containerized – say, a PostgreSQL database – Kubernetes takes over dealing with some of the more painful aspects of reliability and maintainability (with the help of middleware-specific operators).

    Containers decouple data from the runtime, so upgrades and configuration are easier through infrastructure-as-code (YAML). Hardware failure and maintenance windows are covered by Kubernetes’ built-in capability to reschedule pending pods on surviving nodes. Full scheduled backups or point-in-time recovery are in the hands of the operator’s automation.

    But what about scalability?

    Kubernetes’ vertical pod autoscaler can adjust container resources, deleting and recreating pods with new resource settings. As a traditional relational database, PostgreSQL can have only one primary replica that writes data. This means that you’ll be facing a  short downtime while the new pod comes online. The majority of workloads are about five times oversized, so while sizing is painful, it’s better than no sizing at all (please, have mercy on your CTO’s budget).

    NoSQL has none of these limitations. Databases like Cassandra were built for scaling horizontally without downtime.

    Enter Distributed SQL

    What if we could blend Google Spanner’s ability to operate at distances with strong ACID consistency, Cassandra’s scaling and PostgreSQL compatibility?

    This is where YugabyteDB helps.

    YugabyteDB is an open source, relational, distributed SQL database management system. It was designed to handle large amounts of data across multiple availability zones and geographic regions, all the while delivering single-digit latency, high availability and no single point of failure.

    I hate when the new kid on the block brings their own syntax language because, you know, their case is so very special – just like everybody else’s.

    Yugabyte doesn’t do that. They have a wicked-smart storage layer (inspired by Google Spanner) that reuses the PostgreSQL query engine. This means no mental strain on the development team – you get to use the time-tested, marketable and incredibly powerful PostgreSQL language-level features that many are already comfortable with.

    If Google Spanner is so inspiring, why is it not taking over the world of distributed SQL? Well, it’s available only as SaaS, and heavily depends on the specifics of Google Cloud hardware like atomic clocks (trueTime) and Google’s backbone network. If your private data center or favorite cloud provider is not GCP – well, no Spanner for you, my friend. Personally, I’d be hesitant to marry into the ultimate vendor lock-in. Yugabyte doesn’t have any dependencies and would happily run on any cloud, private data center, VM or bare metal – and if your coffee machine runs Docker containers, you can run Yugabyte there, as well.

    If Yugabyte is robust, scalable and easily maintainable, you have the top three pillars covered. But what about the other two pillars your CTO is nagging you about (cost efficiency and a vendor-agnostic approach)?

    How to Make Your Database Vendor-Agnostic

    Being vendor-agnostic means being able to switch between major cloud providers at any point without depending on prohibitively expensive services like DynamoDB. This approach also allows you to leverage inefficiencies in cloud pricing so you can look for new opportunities to reduce cost and dynamically shift resources between cloud providers online.

    This is something CAST AI can do.

    The CAST AI platform acts as a cloud abstraction and makes the whole multi-cloud, vendor-agnostic requirement quite trivial.

    Developers just interact with standard Kubernetes (no CRDs), and the complexity of several clouds is abstracted. A Kubernetes cluster in CAST AI can span across several cloud providers at the same time, bringing some unique cost optimization opportunities.

    What if spot/preemptible instance interruption wasn’t totally random anymore, but something you could actually predict? You could be proactive and—by operating in several compute bidding markets at the same time—reduce the risk of running out of capacity.

    Why not slash your monthly cloud bill radically by running some of the database containers on spot/preemptible nodes?

    Highly Available Stateful Application on Multi-Cloud

    Yugabyte on a multi-cloud CAST AI Kubernetes cluster is a robust design without a single point of failure.

    Active/Passive solutions are so ’90s—failovers cause brief downtime, and DBAs tend to leave the failover to be manually initiated due to occasional short-lived network blips. Active/Passive solutions constantly require testing and validation. Will your disaster recovery work on darker days? Because these tests cause downtime, nobody does them regularly.

    The best highly available solutions are active-active, don’t require user failover, and don’t rot if not tested regularly.

    CAST AI has a tutorial in place that takes you through every step of building the above solution in about 10 minutes, from scratch.

    Go ahead, open your cloud provider’s console and release your inner chaos monkey by killing Yugabyte, business app pods or whole Kubernetes nodes.

    CAST AI, Yugabyte, and Kubernetes were built with a core tenet that nothing is guaranteed; nothing should be shared. But keep in mind, consensus algorithms work when there’s still a majority left to vote N/2 + 1.

    You may be asking, what’s the performance impact of increasing resiliency when going multi-cloud with a distributed database?

    Let’s find out.

    Let’s benchmark a distributed Yugabyte database on top of CAST AI Kubernetes spanning AWS and GCP. These cloud providers are arbitrary choices here; Azure or DigitalOcean can be used in the mix, as well. We picked GCP and AWS because their VMs boot up a bit faster.

    Mono-Cloud Vs. Dual-Cloud Network Benchmark Results

    Let’s compare a Yugabyte containerized database on Kubernetes in a single-cloud scenario versus a distributed database working in two different clouds.

    Setup

    We took the OSS Yugabyte HELM chart with the image version “2.5.1.0” with the replication factor of 3.

    Role

    YB-Master

    YB-Tserver

    Description

    Control plane, consensus

    Serves data

    CPU

    3 CPUs

    7 CPUs

    RAM

    3 GiB

    14 GiB

    Storage

    50 GiB

    300 GiB

    Remote Network Block storage:

    • EBS gp2 (300 IOPs)
    • Standard persistent disk (R225/W450 IOps)

    Nine pods, each on a separate VM to ensure plenty of resources:

    Mono Cloud

    Regional GKE k8s cluster with 9x GCE N2d-standard-8 distributed in three availability zones. Casual VPC network in Google’s US-East4 region.

    Dual Cloud

    AWS EC2 3x c5a.2xlarge

    GCP GCE 6x n2d-standard-8

    A network between cloud providers set up with a Wireguard-based full mesh VPN that encrypts traffic end-to-end (also inside the same VPC).

    To minimize noise from compute and local storage efficiency, we didn’t optimize for cost but wanted to isolate and better understand how distributed databases would work in situations where database nodes are distributed single-digit milliseconds away (in this example, less than 9 ms).

    Nine milliseconds of network round trip latency means a lot of flexibility in choosing between data center providers distributed within a few hundred miles.

    The majority of cloud provider regions lack imagination and are clustered in the geographic vicinity of a densely populated metropolis. California, northern Virginia, Montreal, São Paulo, London, Frankfurt, Amsterdam, Mumbai, Tokyo, Singapore, Sydney, etc.

    So, what are your options in, say, Frankfurt? AWS, Azure, GCP, DigitalOcean, Oracle, Alibaba, IBM Cloud, Hetzner, Linode—not to mention the white-label providers.

    We carried out tests on U.S. East (Ashburn) and Europe Central (Frankfurt) with similar results.

    How We Measured It

    If we want to test relational database performance – the gold standard ruler to date is a synthetic TPC-C benchmark.

    Why did we choose that? Because it’s the most mature OLTP benchmarking test suite that has stood the test of time. As stated here:

    “While the benchmark portrays the activity of a wholesale supplier, TPC-C is not limited to the activity of any particular business segment, but, rather represents any industry that must manage, sell, or distribute a product or service.”

    We loaded an identical Yugabyte configuration in both scenarios with 300 warehouses worth of data and then ran benchmarks several times.

    Each test took half an hour, and the output was the single most important metric: transactions per minute. The test also provided different outputs per type of transaction, average and 99th percentile duration in milliseconds.

    Results

    This table shows a comparison of TPC-C results with the average duration for a single cloud on Google and AWS + Google in the same region, US-East.

    300 warehouses

    Mono Cloud

    Dual Cloud

    Num New Order transactions per 1800 s

    113,071

    113,247

    TPM-C

    3,769

    3,774

    Efficiency

    97.6%

    97.8%

    NewOrder Latency avg msec

    580.2

    498.8

    Payment Latency avg msec

    30.8

    46.7

    OrderStatus Latency avg msec

    33.8

    32.4

    Delivery Latency avg msec

    123.1

    174.9

    StockLevel Latency avg msec

    239.4

    465

    And comparing the 99th percentile:

    300 warehouses

    Mono Cloud

    Dual Cloud

    NewOrder Latency  p99 msec

    6985.6

    5498.7

    Payment Latency p99 msec

    110.5

    157.5

    OrderStatus Latency p99 msec

    146.3

    185.1

    Delivery Latency p99 msec

    331.5

    696.8

    StockLevel Latency p99 msec

    712.3

    1083.3

    As you can see, the difference between the mono cloud and dual cloud scenarios is quite small.

    Some operations, like OrderStatus, are plain read operations. The nearest server can quickly respond with data to the client—usually, a microservice running on the same K8s cluster.

    Yugabyte’s lowest isolation level is a snapshot. This means that those reads are protected from the undesirable effect of the “dirty read.”

    What about writes?

    Writes are a bit more expensive. Raft consensus, hybrid logical clocks and lockless multi-version concurrency control (MVCC) algorithm magic—all of this means a lot more chatter and replication between nodes to get write committed.

    We see that, in payment and delivery operations duration (30ms vs. 46ms and 123ms vs. 174ms, respectively) the geographic distances start to be noticeable.

    The actual network latency between nodes in different availability zones in the mono cloud scenario without network overlay and encryption is, on average, about 0.6ms. Network latency between two clouds with overlay (VXLAN) and encryption (Wireguard) is about 5ms.

    The laws of physics aren’t going away anytime soon. But as we can see, the results are much better than expected.

    YMMV, but industry accepted norm is that the majority of IO operations will be reads, at 70%; only remaining 30% writes, reducing the impact of speed of light even further.

    Having said that, the gold standard for measuring OLTP database performance for the last two decades says that performance results are identical (TPM-C 3’769 vs. 3’774).

    Data Gravity and Egress Costs

    Data gravity refers to a scenario where compute gravitates closer to data.

    For example, if you have a hybrid cloud or multi-cloud strategy but your data stays in a single location like an on-premises data center. Most of the compute with stateless services will tend to stay in the same data center, closer to data.

    The whole point of multi-cloud and a high-performing distributed database was to get rid of data gravity. If we have the same data on two or more clouds, then the data gravity effect disappears.

    If all your data is replicated to several locations, what about network traffic costs?

    All cloud providers allow unlimited incoming (ingress) data. It doesn’t matter where data is coming from—if it’s your on-premises data center, a different cloud provider, the dark web or most cloud-native services. All the incoming data is free.

    “You can bring as much data as you want to us. But if you want to take your data back – sorry, you need to pay.” This is universal between all cloud providers. All the outgoing (egress) traffic from your availability zone is paid! Some cloud providers, like Oracle Cloud, are very generous with egress costs, and companies like Zoom saved a ton of money when they moved some of Zoom’s infrastructure to Oracle Cloud.

    DigitalOcean gives a generous egress monthly allowance per Droplet (VM), depending on size and how long you run it. But, at a minimum, it starts at Terabyte per smallest Droplet. The monthly egress allowance is aggregated in your account, and you pay only for the combined extra.

    All clouds have some minimal free tier—but in general, egress costs start at around 10 cents per GB of data sent outside VPC, and, on average, 2 cents for data between availability zones in the same VPC (I bet you didn’t know that you pay 1cnt/GB in AWS and Azure for incoming traffic coming from same VPC/Vnet from another AZ).

    If you send more traffic, your cost per GB falls. The first drop is at 10TB and generally flattens at around 5 cents at ~150TB.

    How does it make you feel when cloud providers charge an eye-watering 97% margin on that egress traffic? It’s like we’re back in 1995 with dial-up modems, right?

    There is a more cost-effective alternative. But first, let’s answer the ‘Will it Blend?’ question. Let’s add Direct Connect, Express Route, Cloud Interconnect and Layer 2 or Layer 3 providers like Equinix or Megaport. Yes, you get a Dedicated Fiber Link smoothie out of the blender.

    Dedicated fiber link slashes costs to a mere 2 cents per GB. And if you have more egress traffic than 7TB, it’s more cost-effective than relying on the weird discount models from cloud providers.

    You might be thinking, “2 cents for every GB?! That’s way too much! I’m using RDS—yes, I have vendor lock-in and data gravity—but at least I have none of the problems with egress cost, resilience, scalability and overall affordability of the service, right?”

    That’s just the result of an opaque billing design.

    https://twitter.com/QuinnyPig/status/1372598432095891458

    All the traffic between Availability Zones in all clouds is paid at 2 cents per GB of egress+ingress. The only place where you pay for ingress is between Availability Zones in the same region (AWS/Azure). Some managed services offer free replication, but they charge double on compute costs, etc.

    Through the ServiceTopology feature, Kubernetes can keep your application pod’s traffic inside the same cloud service provider Availability Zone and cloud, to avoid round robin, random calls between clouds. This means that you get the best latency and pay no traffic premium.

    Most of the database activity is reads (70/30, YMMV) and are effectively free, egress-wise (coming from the local AZ due to the Kubernetes topology awareness). So, the only thing you replicate and subject to egress costs is your database change delta rate per month.

    Now you can see that the issue of egress costs is an incredibly overstated problem.

    The overwhelming push to the public cloud over the last decade brought on new challenges like vendor lock-in, data gravity and eye-watering monthly infrastructure bills.

    During that time, innovation in non-traditional RDBMS, containerization and workload scheduling removed some of the old barriers.

    Running a hands-free, strongly consistent, highly available and scalable database in heterogeneous data centers on a budget was a monumental task a decade ago. Today, it has become an affordable best practice for running our business applications.

  • Gitpod Revamps Dev Automation Tool

    Gitpod Revamps Dev Automation Tool

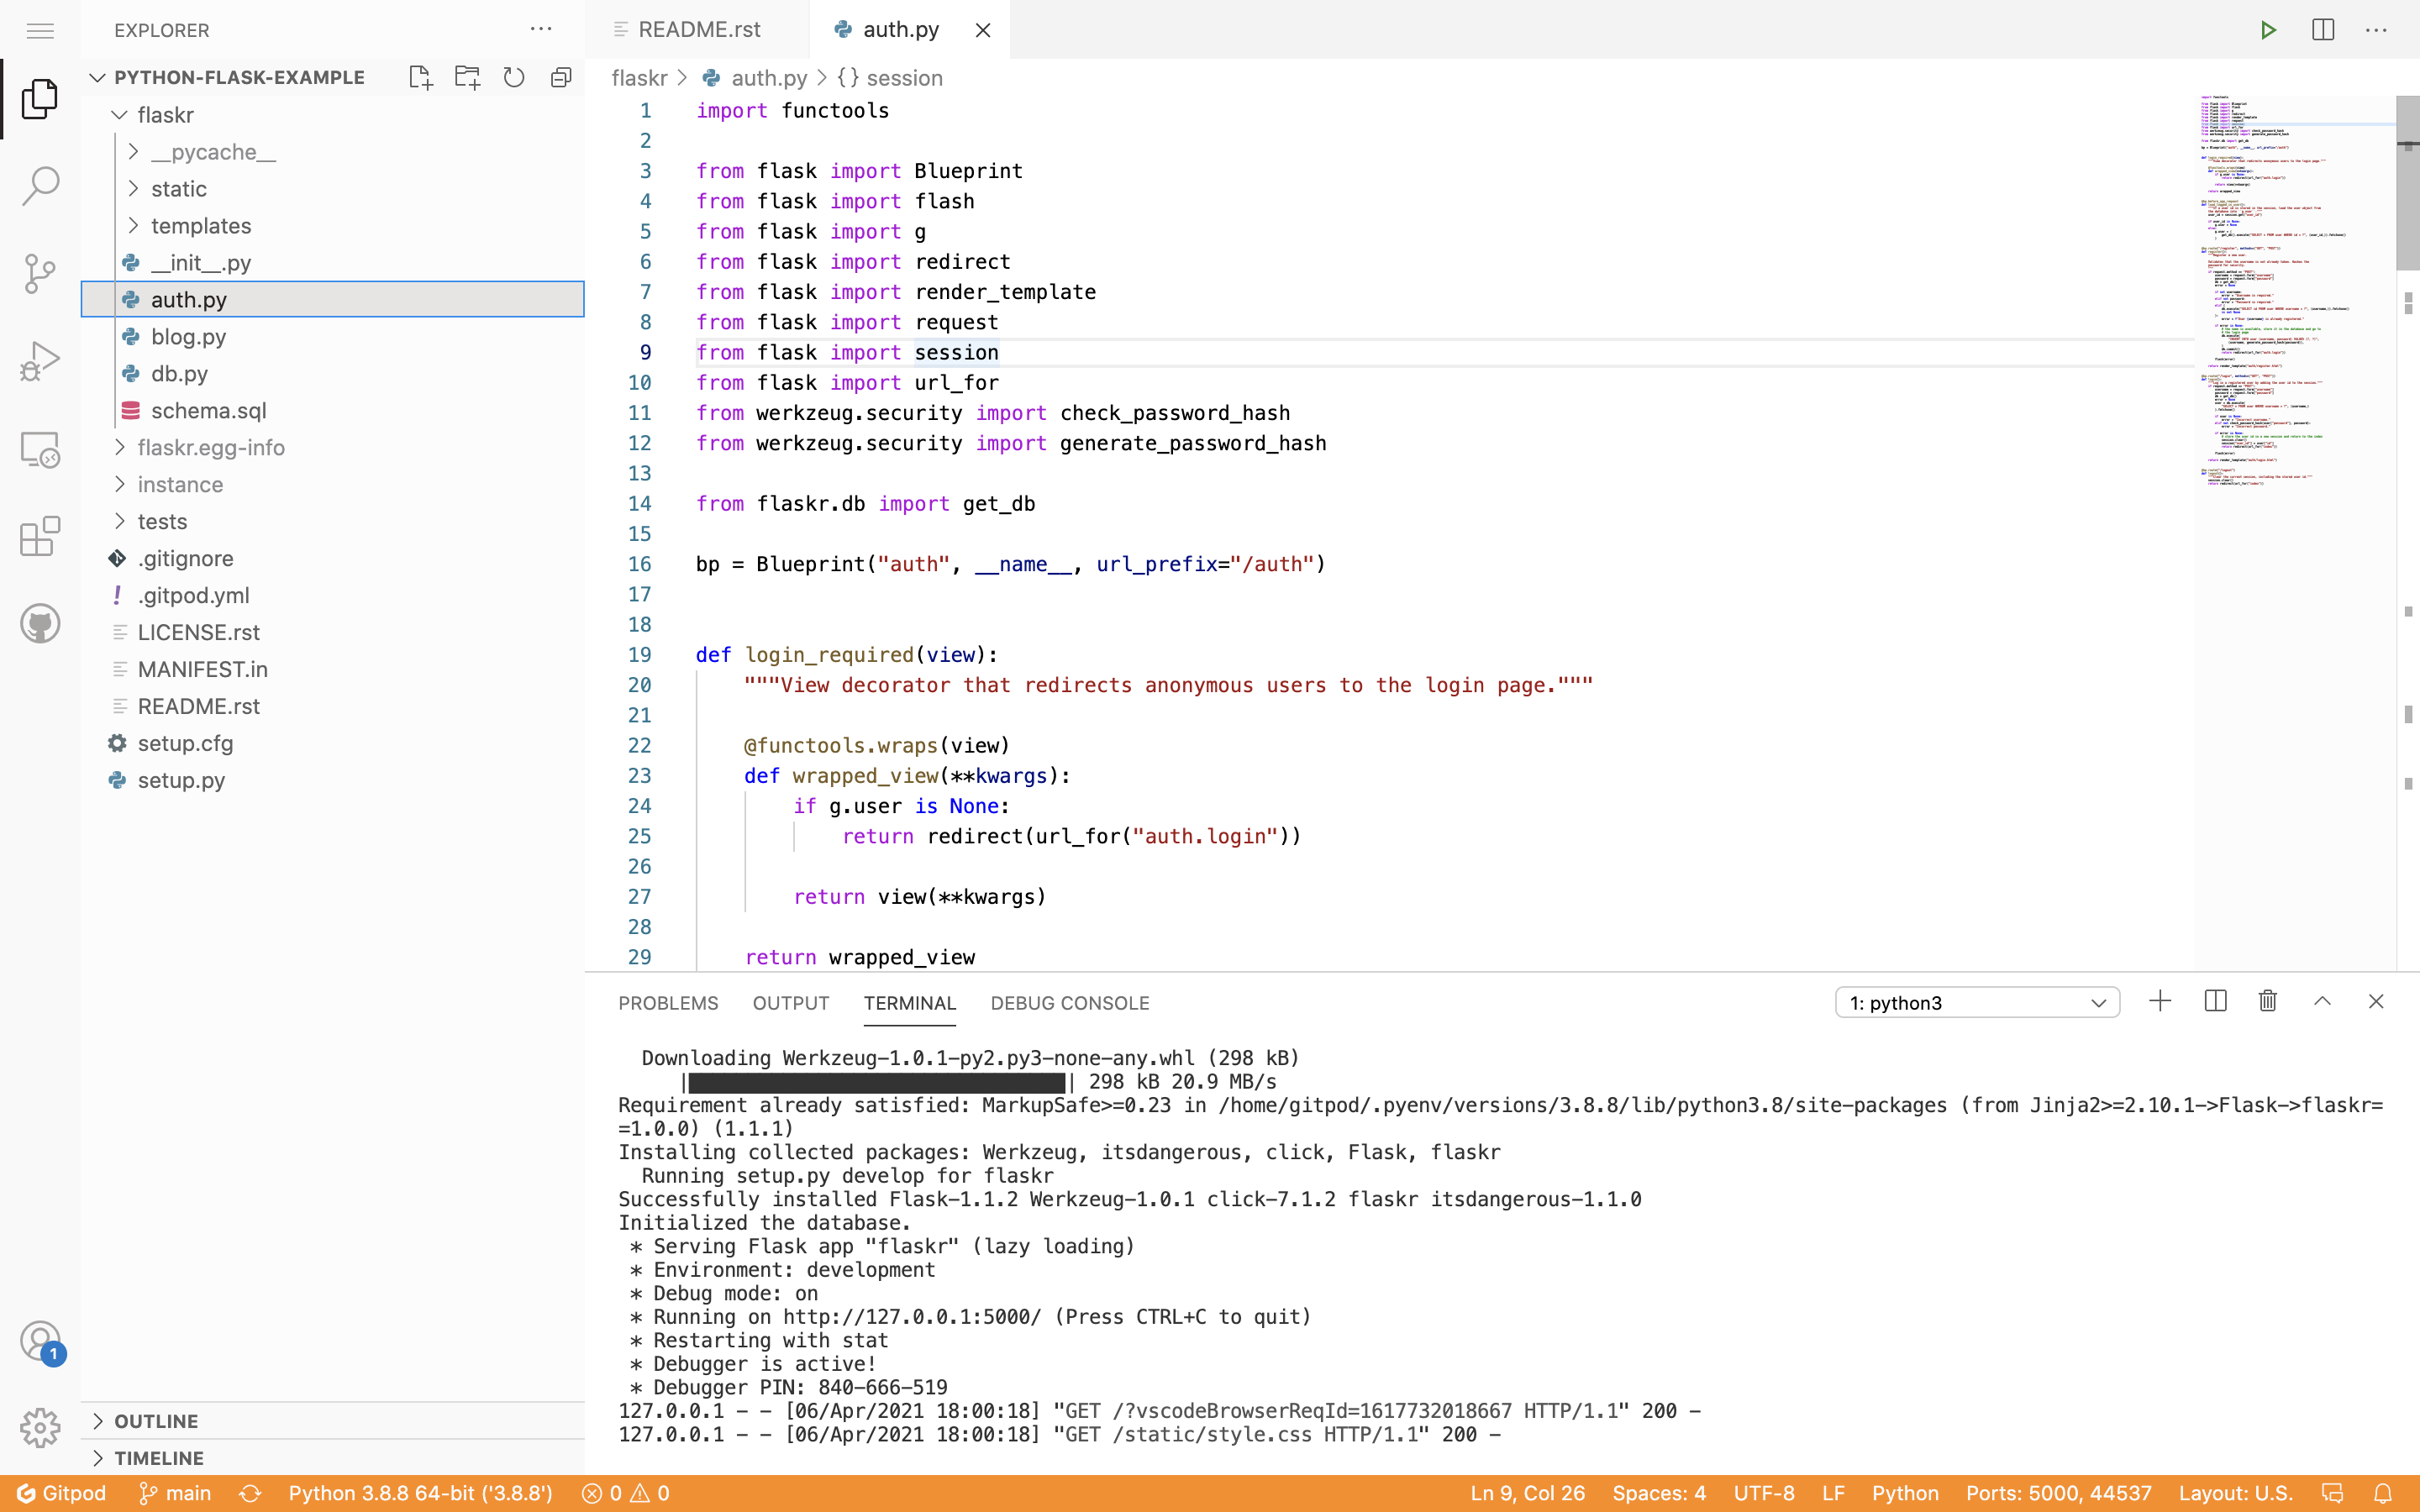
    Gitpod announced today it refreshed the dashboard for its namesake open source tool for automating the deployment of development environments, in addition to making Microsoft VS Code its default tool for editing code.

    In addition, Gitpod has included support for sudo privileges and Docker images using an advanced user namespace to map and limit access to workloads using a built-in Supervisor capability.

    Fresh off raising an additional $13 million in funding, Gitpod CEO Sven Efftinge said now that it’s clear developers will be working from anywhere for the foreseeable future, the need for a tool to automate setting up a developer environment on a local machine outside of an office has become more apparent.

    Gitpod claims there are now more than 350,000 developers using its tool that creates a Kubernetes pod on each developer machine to deploy a complete application development environment, including the integrated development environment (IDE), plugins, compilers, build tools, code generators, databases and application servers. Gitpod makes use of the version control systems provided within, for example, a continuous integration/continuous delivery (CI/CD) platform as the single source of truth for configuring an application development environment.

    The overall goal is to eliminate the time developers waste setting up application development environments so they can write code on their own machines. That approach also makes it simpler for developers to collaborate around the same application development environment regardless of where they happen to be physically located.

    Efftinge said Gitpod provides DevOps teams with a tool to automate setting up development environments across any Git repository that is the equivalent of the Codespaces tool that GitHub recently made available. Rather than having that capability for only one repository, Efftinge noted that most developers work on projects that span multiple types of repositories.

    Automating that process also makes it simpler to align development environments with production environments. One of the reasons why code doesn’t work in a production environment when it is first deployed is because the local development environment has been manually configured in a way that doesn’t accurately reflect the production environment. That issue can become even more problematic when developers are working on multiple projects involving, for example, separate microservices constructed using different repositories.

    In the wake of the COVID-19 pandemic and the acceleration of multiple digital business transformation initiatives there’s naturally a lot more focus on automation and developer productivity. Most developers will be working outside the office for the foreseeable future. Of course, most developers have been writing code outside the office for years. The challenge now is enabling teams of developers to develop applications as efficiently as possible, no matter where they are in the world. In fact, now that development teams have become more distributed, organizations are becoming more comfortable hiring developers wherever they find them.

    Eliminating inefficient manual tasks, such as maintaining development environments, is, of course, going to be a prerequisite for making it possible for those developers to, over time, navigate multiple application development projects without ever having met their colleagues in person.

  • Grafana Labs Aligns with Elastic on Observability

    Grafana Labs Aligns with Elastic on Observability

    Elastic and Grafana Labs have allied to create a plugin through which DevOps teams that are employing Elasticsearch within a DevOps workflow will be able to invoke a monitoring platform, based on Prometheus, that is managed by Grafana Labs.

    Raj Dutt, Grafana Labs CEO, said both companies are dedicating engineering resources to building and maintaining a plug-in for a service, based on open source Prometheus software, that is rapidly becoming a de facto standard for observability in DevOps environments. One of the primary reasons for that expanded usage is that Grafana Labs doesn’t require DevOps teams to move data into a central repository to analyze it, Dutt said.

    The overall goal is to eliminate the “tunnel vision” that results when relying on tools that only visualizes a narrow set of metrics, Dutt added.

    The cloud platform provided by Grafana Labs is based on open source Grafana visualization tools. The primary tool for visualizing Elasticsearch data is based on open source Kibana tools. Grafana, however, is based on a fork of Kibana, so the plug-in represents an effort to bring those two open source communities closer together. The two companies plan to collaborate on including more aggregations, broader query language support and support for space-saving constructs like rollups as the partnership evolves.

    Grafana Labs provides a cloud service that aggregates data, pulled from multiple instances of Prometheus, deployed on clusters and servers. Prometheus, especially, gained a lot of traction as organizations began to deploy Kubernetes clusters that are also based on open source software. Both Kubernetes and Prometheus are being developed under the auspices of the Cloud Native Computing Foundation (CNCF).

    Once DevOps team initially employ Prometheus to monitor Kubernetes, they frequently expand deployments to monitor additional platforms. That shift has resulted in many providers of proprietary monitoring tools to extend the data they consume to include the metrics captured locally by Prometheus. Grafana Labs claims it has more 1,000 customers, including Bloomberg, JP Morgan Chase, eBay, PayPal and Sony, for a total of more 650,000 active installations of Grafana around the globe. Existing customers of Elastic that are paying for Elasticsearch support include Cisco, eBay, Goldman Sachs, Microsoft, The Mayo Clinic, NASA, The New York Times, Wikipedia and Verizon.

    It’s not clear to what degree Grafana and Kibana might ultimately re-converge one day, but it’s clear there will be a fair amount of ongoing cross-pollination across the two projects. In the meantime, DevOps teams should be able to opt for whichever open source visualization framework they prefer alongside Elasticsearch.

    In the longer term, it’s clear greater appreciation for observability platforms that provide more context will drive a wave of consolidation among all the monitoring tools that enterprise IT teams rely on today. As part of the transition, enterprise IT teams might even standardize on a set of visualization tools that would eliminate the need to master different user interfaces. After all, the only way to actually achieve observability is through a set of tools that makes surfacing the context required easier to consume.

  • Grafana Labs Adds On-Premises Observability Platform

    Grafana Labs Adds On-Premises Observability Platform

    Grafana Labs announced today the availability of a unified Grafana Enterprise Stack that enables IT teams to deploy a curated observability platform, based on open source tools such as Prometheus, in their own on-premises IT environment.

    Tom Wilkie, vice president of product for Grafana Labs, said Grafana Enterprise Stack, in addition to providing a version of Prometheus optimized for distributed computing environments, includes curated instances of open source Grafana dashboards, Loki log aggregation tools and the Cortex query engine.

    Grafana Enterprise Stack also includes plugins for visualizing data from other commercial tools in Grafana, such as Splunk, New Relic, MongoDB, ServiceNow, Oracle and Snowflake. In addition, it includes reporting tools and enhanced authentication and security controls.

    Grafana Labs

    Developed under the auspices of the Cloud Native Computing Foundation (CNCF), Prometheus has gained traction as a monitoring platform used primarily in Kubernetes environments. However, Wilkie said it’s only a matter of time before IT organizations expand their use of Prometheus to include a wider range of platforms. The Grafana Enterprise Stack facilitates that transition by making it easier for organizations to deploy a complete observability platform based on open source software, said Wilkie.

    While open source software has a key role to play in enabling observability, most IT organizations today rely on a range of proprietary tools to monitor IT environments. Many of those tools will be replaced, in the months ahead, by observability platforms that provide more context than individual monitoring tools currently do. However, it’s not clear yet if IT teams will prefer open source or proprietary platforms that, in most cases, incorporate open source components.

    As IT environments become more complex, the tools most organizations rely on today don’t surface enough actionable insights. Most IT teams today still waste a fair amount of time navigating amongst multiple tools in an effort to discover the root cause of a problem. It’s not uncommon for IT teams to take days to discover the source of a problem that is then fixed in a few minutes. The expectation is that observability platforms will sharply reduce the amount of time and effort required to investigate, for example, a performance issue.

    Of course, to achieve that goal, applications themselves will need to become more instrumented. A mix of open source and proprietary agent software will make it easier to collect traces, logs and other metrics at a reduced cost. In many cases, IT teams have been reluctant to fully instrument an IT environment, because of both the cost of proprietary agent software and the inherent challenges associated with deploying and managing it across an extended enterprise. However, as the deployment process for agent software becomes more automated, organizations are finding it easier to instrument their applications.

    It may be awhile before IT environments are fully instrumented. However, as it becomes easier to collect traces, logs and metrics, the level of observability that can be achieved across an enterprise will undoubtedly increase. The challenge and the opportunity then becomes employing the greater visibility provided by these platforms to manage the sprawl of applications and platforms across IT more proactively.

  • HashiCorp Expands Managed Services Offerings

    HashiCorp Expands Managed Services Offerings

    HashiCorp today announced the general availability of its Consul service mesh as a managed service on the HashiCorp Cloud Platform (HCP) along with a beta release of a managed instance of HCP Vault, a secrets management platform, on HCP.

    HCP is currently hosted on the Amazon Web Services (AWS) platform, on which the company is making available its complete portfolio as a managed service. In the longer term, HashiCorp plans to make its managed services available on all the major cloud platforms.

    Chris Kent, director of product marketing for HashiCorp, said despite the growing number of open source service mesh alternatives, many organizations would prefer to employ a service mesh provided by a single vendor that they didn’t have to provision and maintain. HashiCorp’s Consul service mesh provides a lightweight alternative that enables service-to-service networking and security via connection authorization and encryption and spans both Kubernetes clusters and virtual machine platforms using the mutual Transport Layer Security (mTLS) protocol.

    Applications can then employ sidecar proxies in a service mesh configuration to establish TLS connections for inbound and outbound connections without ever having to directly interface with Consul itself.

    HashiCorp is making the case for Consul at a time when internecine warfare is raging between proponents of open source service mesh platforms such as Istio, Linkerd and Kuma. The Consul service mesh provides an alternative that is simpler for developers to incorporate across both microservices-based applications running on a Kubernetes cluster and legacy monolithic applications running on virtual machines, Kent said. In contrast, Istio and Linkerd are designed solely for use in Kubernetes environments.

    It’s still the early days of service mesh adoption. In addition to simplifying application traffic routing between services, one of the other benefits of service mesh is that it provides a layer of abstraction above lower-level network application programming interfaces (APIs) and protocols that is more accessible to developers. As developers become more familiar with service meshes, the ability to programmatically include network and security operations within a DevOps workflow will grow. HashiCorp is collectively positioning Consul and Vault as foundational components for creating a zero-trust architecture.

    In the meantime, each IT organization will need to determine which type of service mesh makes the most sense for their environment. In many cases, organizations may find themselves employing multiple service meshes to address different use cases. Regardless of which they choose, service meshes will soon become a permanent fixture in the proverbial solar system around which IT services revolve.

    HashiCorp claims that more than 2,000 organizations signed up to participate in the HCP Consul and HCP Vault beta programs. That level of interest suggests interest is growing in consuming IT as a service rather than as a platform that requires deployment by an internal IT team. It remains to be seen the degree to which organizations will prefer to consume those services directly from a vendor, versus a cloud service provider or third-party IT services provider.

  • ARMO Aims to Simplify Microservices Security

    ARMO Aims to Simplify Microservices Security

    ARMO this week emerged from stealth to launch a platform to secure cloud-native workloads and improve visibility. The ARMO Workload Fabric technology attaches code within the memory invoked by a microservice to enable cybersecurity policies to be applied via a cloud service.

    Company CEO Shauli Rozen said the ARMO Workload Fabric is designed to enable IT organizations to implement a zero-trust architecture more easily within the context of a DevSecOps workflow.

    Fresh from raising $4.5 million in seed funding, Rozen said ARMO’s approach eliminates the need to deploy and manage agent software, container sidecars or runtime application self-protection (RASP) software to enforce security policies across what inevitably will become thousands of microservices distributed across an enterprise IT environment.

    That leaner approach then allows for a centralized management platform that can be deployed on a cloud or on-premises IT environment to apply policies that restrict which microservices can communicate with one another, Rozen said. The approach would ensure that only microservices developed using a continuous integration/continuous delivery (CI/CD) platform are allowed to communicate with other microservices, Rozen said.

    Integration with multiple CI/CD platforms is already provided, added Rozen.

    That approach allows policies to be applied to microservices regardless of how they are constructed, Rozen said. That capability is critical, because developers are building microservices using everything from Python and Java to containers, he said. Many of those microservices are also frequently replaced, Rozen said, which can make updating any associated agent software a significant DevOps challenge. Given all the existing dependencies between microservices, overall application environment security is only as strong as the proverbial weakest link. The ARMO Workload Fabric enables developers to add a small amount of code to implement security policies each time a microservice is rolled out into a production environment.

    As part of an effort to make it simpler for IT organizations to apply those policies, ARMO provides a pre-built set of policies that organizations can immediately apply, in addition to creating their own polices over time, Rozen said. In many cases, IT teams simply don’t have the time or expertise required to build those policies, Rozen added.

    Microservices are being built and deployed at such a breakneck pace that it’s nearly impossible for cybersecurity teams to keep up. The ARMO Workload Fabric provides cybersecurity teams a means to centrally manage security policies that would otherwise be implemented as code by developers. It provides a level of observability for how those cybersecurity policies are being implemented across microservices that typically have a lot of dependencies on one another, Rozen said.

    Most organizations today recognize there is a clear need to shift responsibility for application security further left toward developers. The challenge is finding a practical way to achieve that goal, and in a way that doesn’t adversely impact the rate at which applications are being developed. The key to achieving that goal is finding a way to apply microservice security polices that causes the least amount of friction possible to existing DevOps workflows.

  • A Security Vulnerability Management Guide

    A Security Vulnerability Management Guide

    Living in a container-native world is not easy. Containers have a reputation for being a point of entry for security vulnerabilities for many organizations. In 2015, according to a research paper, over 40% of Docker images distributed through Docker Hub had high-risk vulnerabilities; at that time there were more than 95,000 container images hosted on Docker Hub. Today, there are over 3.5 million container images on Docker, and container security is of even greater concern. In a more recent 2020 study by a team of researchers at the Norwegian University of Science and Technology found container image vulnerabilities in certified and popular packages.

    This is just one example of one kind of security vulnerability. This article will share an introduction to security vulnerabilities and the role of vulnerability management for containers and other artifacts in a continuous integration and continuous delivery (CI/CD) pipeline.

    What is a Security Vulnerability?

    A vulnerability is a weakness or flaw present in software. Security vulnerabilities can be present in application dependencies or operating system (OS) packages. Common vulnerabilities include missing data encryption, buffer overflows, missing authentication for critical functions and insecure interactions between software components.

    There are different risks associated with different types of vulnerabilities. With critical or high-risk vulnerabilities, an attacker who exploits your software has the potential to seriously impact your organization. Risks associated with data breaches impact not only an organization, but also its end users and customers.

    Vulnerability Management Techniques

    Vulnerability assessment practices and tools exist to make detecting vulnerabilities simple, accurate and fast. Some of these practices include:

    • Penetration testing – Penetration testing, or pen testing, allows you to identify security vulnerabilities by attempting to break into your own systems to identify weaknesses.
    • Configuration management – Configuration management involves managing infrastructure configurations and identifying missing patches that leave your software service vulnerable to errors and risks. There are tools that provide infrastructure scanning as-a-service to help detect outdated or misconfigured instances.
    • Container and application Scanning – Allows you to detect vulnerabilities in deployable artifacts and running applications. Some available tools for container scanning include Twistlock, Clair and Trivy.

    These practices help build solid, repeatable vulnerability management techniques across your security and delivery teams. One way to scale these security practices is through security automation. Security automation is the use of technology that performs tasks with reduced manual assistance. It ultimately enables users to apply security decisions automatically and secure processes to deliver more robust applications and infrastructure.

    Security Practices in your CI/CD process

    Security automation is a core tenant of DevSecOps. DevSecOps is short for development security and operations, and it describes how organizations deliver and make security decisions and actions within the development life cycle of their valued deliverables.

    DevSecOps is a way of continuously integrating security in the software development life cycle. It’s a way of working and thinking so that security is at the forefront of how security teams deliver business value.

    One way to enable DevSecOps is through your CI/CD pipeline. Today’s enterprises can use CI/CD to accelerate better software delivery, but with that speed it becomes even more important to enable robust security. Vulnerability scanning improves software security while giving individuals across engineering and product teams accountability for each of the processes these teams own.

    Don’t let Security Vulnerabilities Ruin your DevSecOps

    This is a simple, basic introduction to security vulnerabilities and the risks they pose for your organization. There are practices and tools for detecting and reducing security vulnerabilities, and finding ways to incorporate those processes into a CI/CD pipeline is a great way to accelerate your DevSecOps.

  • Windows Sandbox and Hypervisor-Based Isolation

    Windows Sandbox and Hypervisor-Based Isolation

    Completely securing the endpoint is hard. Securing it without sacrificing user productivity is even harder. Think of a modern laptop running a Windows 10 OS, for example. The OS consists of millions of potentially vulnerable lines of code. It has many legacy components written with old security standards in mind. The kernel is probably executing several third-party drivers that might also be vulnerable. Finally, there are dozens of daily-use applications. Some are provided, managed and patched by the enterprise, while others are installed on demand by users; the latter are not always from legitimate sources, making it harder to track and assess security. Timely detection and prevention of threats is a cat-and-mouse game, where a single win for the attackers is game over for the user.

    Consider, too, the rate at which organizations are moving to the cloud. For those using the endpoint purely as a browser, web isolation products can significantly enhance security by isolating browser access to risky websites and, sometimes, to risky email attachments, too. Using ChromeOS, an operating system built for the cloud with security in mind, can provide additional security benefits.

    But using only a browser is not yet practical for most organizations. Many legacy line-of-business applications are still being used daily. Workers install video conferencing applications to meet with business partners. Developers install and update software for their daily work. Almost every popular, modern cloud application (Slack, Teams, Office, etc.) comes with a full desktop client that offers superior features. For organizations looking to adopt these tools, web isolation solves only part of the problem.

    VDI or Desktop-as-a-Service (DaaS) solutions allow companies to shift corporate application workloads to the data center or the cloud. By limiting endpoint operations to that of a thin client, and only connecting them to this infrastructure, the list of potential attack vectors narrows and becomes very secure.

    But using VDI/DaaS for the entire organization becomes very expensive if massive numbers of users need remote access simultaneously. Further, the user experience and latency are far from ideal, and offline work is impossible. In terms of security, while the endpoint is now more secure, the threat still exists – it just moves to the data center or the cloud, where, in essence, a fat Windows desktop is running. With DaaS, security might be even more challenging when multiple users share the same virtual OS; a single threat can potentially compromise multiple user sessions at once.

    Hypervisor-Based Isolation

    The world trusts modern hypervisors to securely run servers, containers and other workloads in the cloud. Sometimes, multiple hypervisors run side-by-side on the same physical server, though they’re completely separated and isolated from each other. Unlike modern OS kernels, hypervisors are designed to perform a very specific task. Their code base is usually very small, well-reviewed and thoroughly tested, making it very hard to exploit. Empirically, it’s very rare to see a hypervisor-related vulnerability discovered or published.

    Is it possible to secure the endpoint with hypervisor-grade isolation? Imagine a “productivity environment” where workers can browse any website; open any email attachment or install and execute software, all without endangering the corporate environment or the organization’s crown jewels. Even better, malware or attackers who compromise this environment are trapped inside by strong, hypervisor-based isolation boundaries.

    Windows Sandbox

    Microsoft has been investing a lot in virtualization-based security (VBS) in recent years. Hypervisor-based isolation is a key element, whether it’s used to isolate LSA secrets with Credential Guard or to isolate critical Device Guard code. With the release of Windows 1903, Microsoft has introduced Windows Sandbox, describing it as a “lightweight desktop environment tailored for safely running applications in isolation.” Windows Sandbox enables users to spin up, almost immediately, a second, isolated instance of Windows with a click of a button.

    Windows Sandbox is based on the new “Krypton VM Containers” – Hyper-V-backed lightweight containers. The lightness is reflected in:

    • Reduced disk space: The container reuses the host’s binaries, reducing its disk footprint and making it easier to manage. This also means it remains as patched and secure as the host.
    • Optimized memory and CPU usage: The host’s kernel is aware of the container, and manages it as yet another application. That means improved CPU and memory allocation based on actual demand and usage.
    • Paravirtualized GPU: By enabling GPU acceleration inside the container, the CPU has less work to do.

    Unlike web isolation products, Windows Sandbox can isolate almost any application. With the Krypton optimizations, it’s fast and doesn’t place too many demands on hardware (any three-year-old laptop should suffice), making it dramatically more affordable than VDI. The virtualization layer is barely noticeable, making the performance superior to VDI/DaaS.

    The Missing Pieces

    Can Windows Sandbox enable organizations to provide an isolated “productivity environment” while further hardening and securing the host OS? In theory, it could, but in practice, unfortunately, it lacks certain capabilities necessary for enterprise environments:

    • Manageability: It’s hard to deploy and impossible to manage (policies, applications) Windows Sandbox with MDM systems such as Microsoft Intune.
    • Usability: Windows Sandbox is non-persistent. Applications installed by users or administrators are going to be wiped on reboot. User settings, cookies, and browsing history will not be saved.
    • OS integration: While users can install risky software inside the container rather than on the host, they are not forced to do so.
    • Security: While fully isolated in terms of code execution, Windows Sandbox doesn’t provide network isolation. Malware can access and attack other devices accessible by the host, even if behind a Network Access Control (NAC).
    • Software Compatibility: Some applications fail to run or to be installed inside Windows Sandbox.

    Hypervisor-based isolation has clear benefits over traditional security methods. By avoiding the cat-and-mouse game, and moving to “mitigation by isolation”, organizations can increase security and productivity, and reduce costs. Once some of the aforementioned gaps are filled, hypervisor-based isolation could become the future of endpoint security.

  • 7 Trends Influencing DevOps and DevSecOps Adoption

    7 Trends Influencing DevOps and DevSecOps Adoption

    Enterprise technology adoption trends can be broadly categorized under three pillars: infrastructure, architecture and technology. Let’s explore what these trends are and how they influence DevOps and DevSecOps adoption in tech corporations worldwide.

    Trends in Architecture

    In computing, architecture is the collection of protocols encompassing the utility, structure and execution of software applications. Architecture defines how an application works and determines the function of each component, such as data storage and computing capability, for example. Architecture trends directly influence how technology is developed, which also makes it influential on the field of DevOps.

    Trend #1: Monolithic to Microservice Architecture

    The shift from massive, inflexible systems that limit compatibility to lightweight, nimble software has increased DevOps and DevSecOps adoption. As architectures such as containers become mainstream, it is easier than ever for teams to code, debug and deploy software quickly, and work collaboratively. Microservice architecture offers the benefit of quickly being able to install, run and maintain systems, and is a catalyst to greater DevOps adoption, while containers spur DevSecOps adoption.

    Trend #2: Cloud-First Trend

    Mobile-first, cloud-first development has revolutionized data transportation, security and collaboration, and made development efficient, safe and transparent. This approach leads many organizations to adopt DevOps/DevSecOps.

    Trends in Infrastructure

    In IT, infrastructure refers to software, hardware, networking resources, systems and tools that allow companies to operate and manage their production processes.

    Infrastructure trends also heavily influence both the hardware and software tools companies use for tracking and manufacturing their products, and therefore directly impact their willingness to adopt DevOps and DevSecOps.

    Trend #3: Kubernetes Plus/Minus DevOps

    A significant infrastructure trend that affects DevOps is the increasing adoption of Kubernetes by global technology companies. Kubernetes is open-source software designed to orchestrate the management, deployment and scaling of containers, and  has seen widespread adoption in the tech industry. Kubernetes empowers organizations to be more productive, with an emphasis on security and collaboration. Containers in Kubernetes seamlessly allow multiple teams to develop a project simultaneously. Resource management and transparency are significantly enhanced, bugs can be fixed more quickly and work cycles can be shortened.

    Kubernetes and container management systems also reduce the need for human interaction and facilitate a fully automated, ‘NoOps’ scenario. Kubernetes uses a pipeline architecture approach that makes it easier for developers to use AI and ML tools to analyze, predict, and automate data and work processes.

    Furthermore, Kubernetes sets an infrastructure backed on logging, continuous detection, consistency, and self-healing, making it extremely easy and considerably faster for computers to make sense of the data, potentially eliminating human interaction. The infrastructure established by the trendy Kubernetes technology is both advancing and restraining DevOps adoption in companies worldwide, depending on how the companies implement Kubernetes into their work cycle.

    Trend #4: The Agile Infrastructure Trend

    Agile infrastructure for software development has become the standard for software development, and is perhaps the most influential trend impacting DevOps adoption. Agile, like DevOps, focuses on collaboration, organization, diversifying skill sets to achieve resilience, rapid iteration and self-improving work processes. Adapting to an Agile methodology means each team has members skilled in various disciplines that work in concert. Each product delivered is followed by a feedback cycle. Agile teams in an enterprise are transparent, collaborative and resilient to internal and external conditions.

    Trends in Technology

    Advancements in technology enable new ways of thinking and new best practices. As tech trends change, the work cycles, processes and mindsets also evolve.

    Trend #5: Release & Deployment Automation

    Manually moving software between testing and production environments is an inefficient, painful task that must be repeated every time updates are added, new versions are released or new features are built. But with the rise of release and deployment automation, software companies can entirely automate this process, saving time while boosting reliability. With the click of a button, test code can be automatically converted to production-ready work and deployed to version controls or hosting services. With this use of automation, DevOps adoption skyrockets.

    Trend #6: Site Reliability Engineers

    Site Reliability Engineers (SREs) are in huge demand as organizations strive to create highly scalable and secure software. SREs build robust, reliable software that leverages automation, create self-healing systems that focus on operations and align closely with business imperatives.

    Trend #7: Shift Toward AI/ML

    The evolution of artificial intelligence and machine learning is changing our entire perspective on the development and use of technology. With increasing automation, ML systems can process large amounts of data, make reliable predictions and provide extremely accurate analyses. AI can make use of this data and these predictions to determine what to do next, and create truly intelligent machines that can function with minimal human interaction.

    While this makes systems faster, more autonomous and reliable—which aligns with what DevOps promotes—it can eventually create a NoOps cycle that doesn’t require human intervention. In the short-term, this trend does influence DevOps adoption, but, in the long term, AI/ML could ultimately eliminate DevOps altogether.

  • Runtime Security and Incident Response with Loris Degioanni

    Runtime Security and Incident Response with Loris Degioanni

    By adopting DevOps, Kubernetes and containers you can accelerate innovation and deliver a better experience for customers and employees. While Kubernetes adoption simplifies application deployment, security needs to adapt and be cloud-first, open and frictionless as a new set of complexities may surface.

    Check out this interview with Sysdig Founder and CTO Loris Degioanni to find out how you can manage the health of your applications and learn more about runtime security and incident response.

    Loris is a security expert and an open source veteran, and he’s also one of the keynote speakers presenting at this year’s DevOps Experience Virtual Summit. During his presentation, Loris will share his perspective on where security is going and practical advice for managing security risk in a Kubernetes and DevOps world.

    For more insights and tips on Kubernetes security, attend Loris’s keynote session at DevOps Experience 2020 on Oct. 22. To check out the full agenda or to register for free, visit the DevOps Experience website.