Author: Mike Vizard

  • Cortex Expands Microservices Catalog to Improve Collaboration

    Cortex Expands Microservices Catalog to Improve Collaboration

    Cortex, a provider of a catalog for tracking the ownership of microservices, today announced it has added a service creation capability that enables developers to use templates to scaffold new services in five minutes.

    In addition, the company has added a Cortex Teams offering that improves collaboration across teams of developers working on interdependent microservices.

    Fresh from raising an additional $2.5 million in funding, Cortex claimed it has increased its customer base by a factor of 10 since initially launching last May. Those customers include Rappi, Grammarly and 8×8.

    Cortex CTO Ganesh Datta said the company’s microservices catalog makes it simpler for teams of developers, DevOps engineers and security professionals to collaborate at a time when software development is becoming more complex. While microservices-based applications are easier to update and generally more resilient than monolithic applications, composing an application based on interdependent microservices created by different development teams can be more challenging to build and maintain.

    In some cases, organizations can even discover that different teams within their organization have built redundant microservices. Part of the reason that occurs is many IT teams still rely on spreadsheets to keep track of what microservices are being built and which ones are already deployed in a production environment.

    Cortex, in contrast, automatically imports data residing in developer tools to surface who within an organization is responsible for maintaining which microservices. A Cortex dashboard also enables DevOps teams to see which developers are on-call in the event of an unexpected incident as well as monitor and track the latency rate microservices are experiencing and which vulnerabilities have yet to be remediated.

    At the core of the platform is Cortex Query Language (CQL), a domain-specific language that allows DevOps teams to define granular rules that can be applied to, for example, on-call rotations, security vulnerabilities, package versions, service level objectives (SLOs) and the overall health of the microservice. Engineers can employ code in the form of YAML files to set reliability standards across teams and types of services.
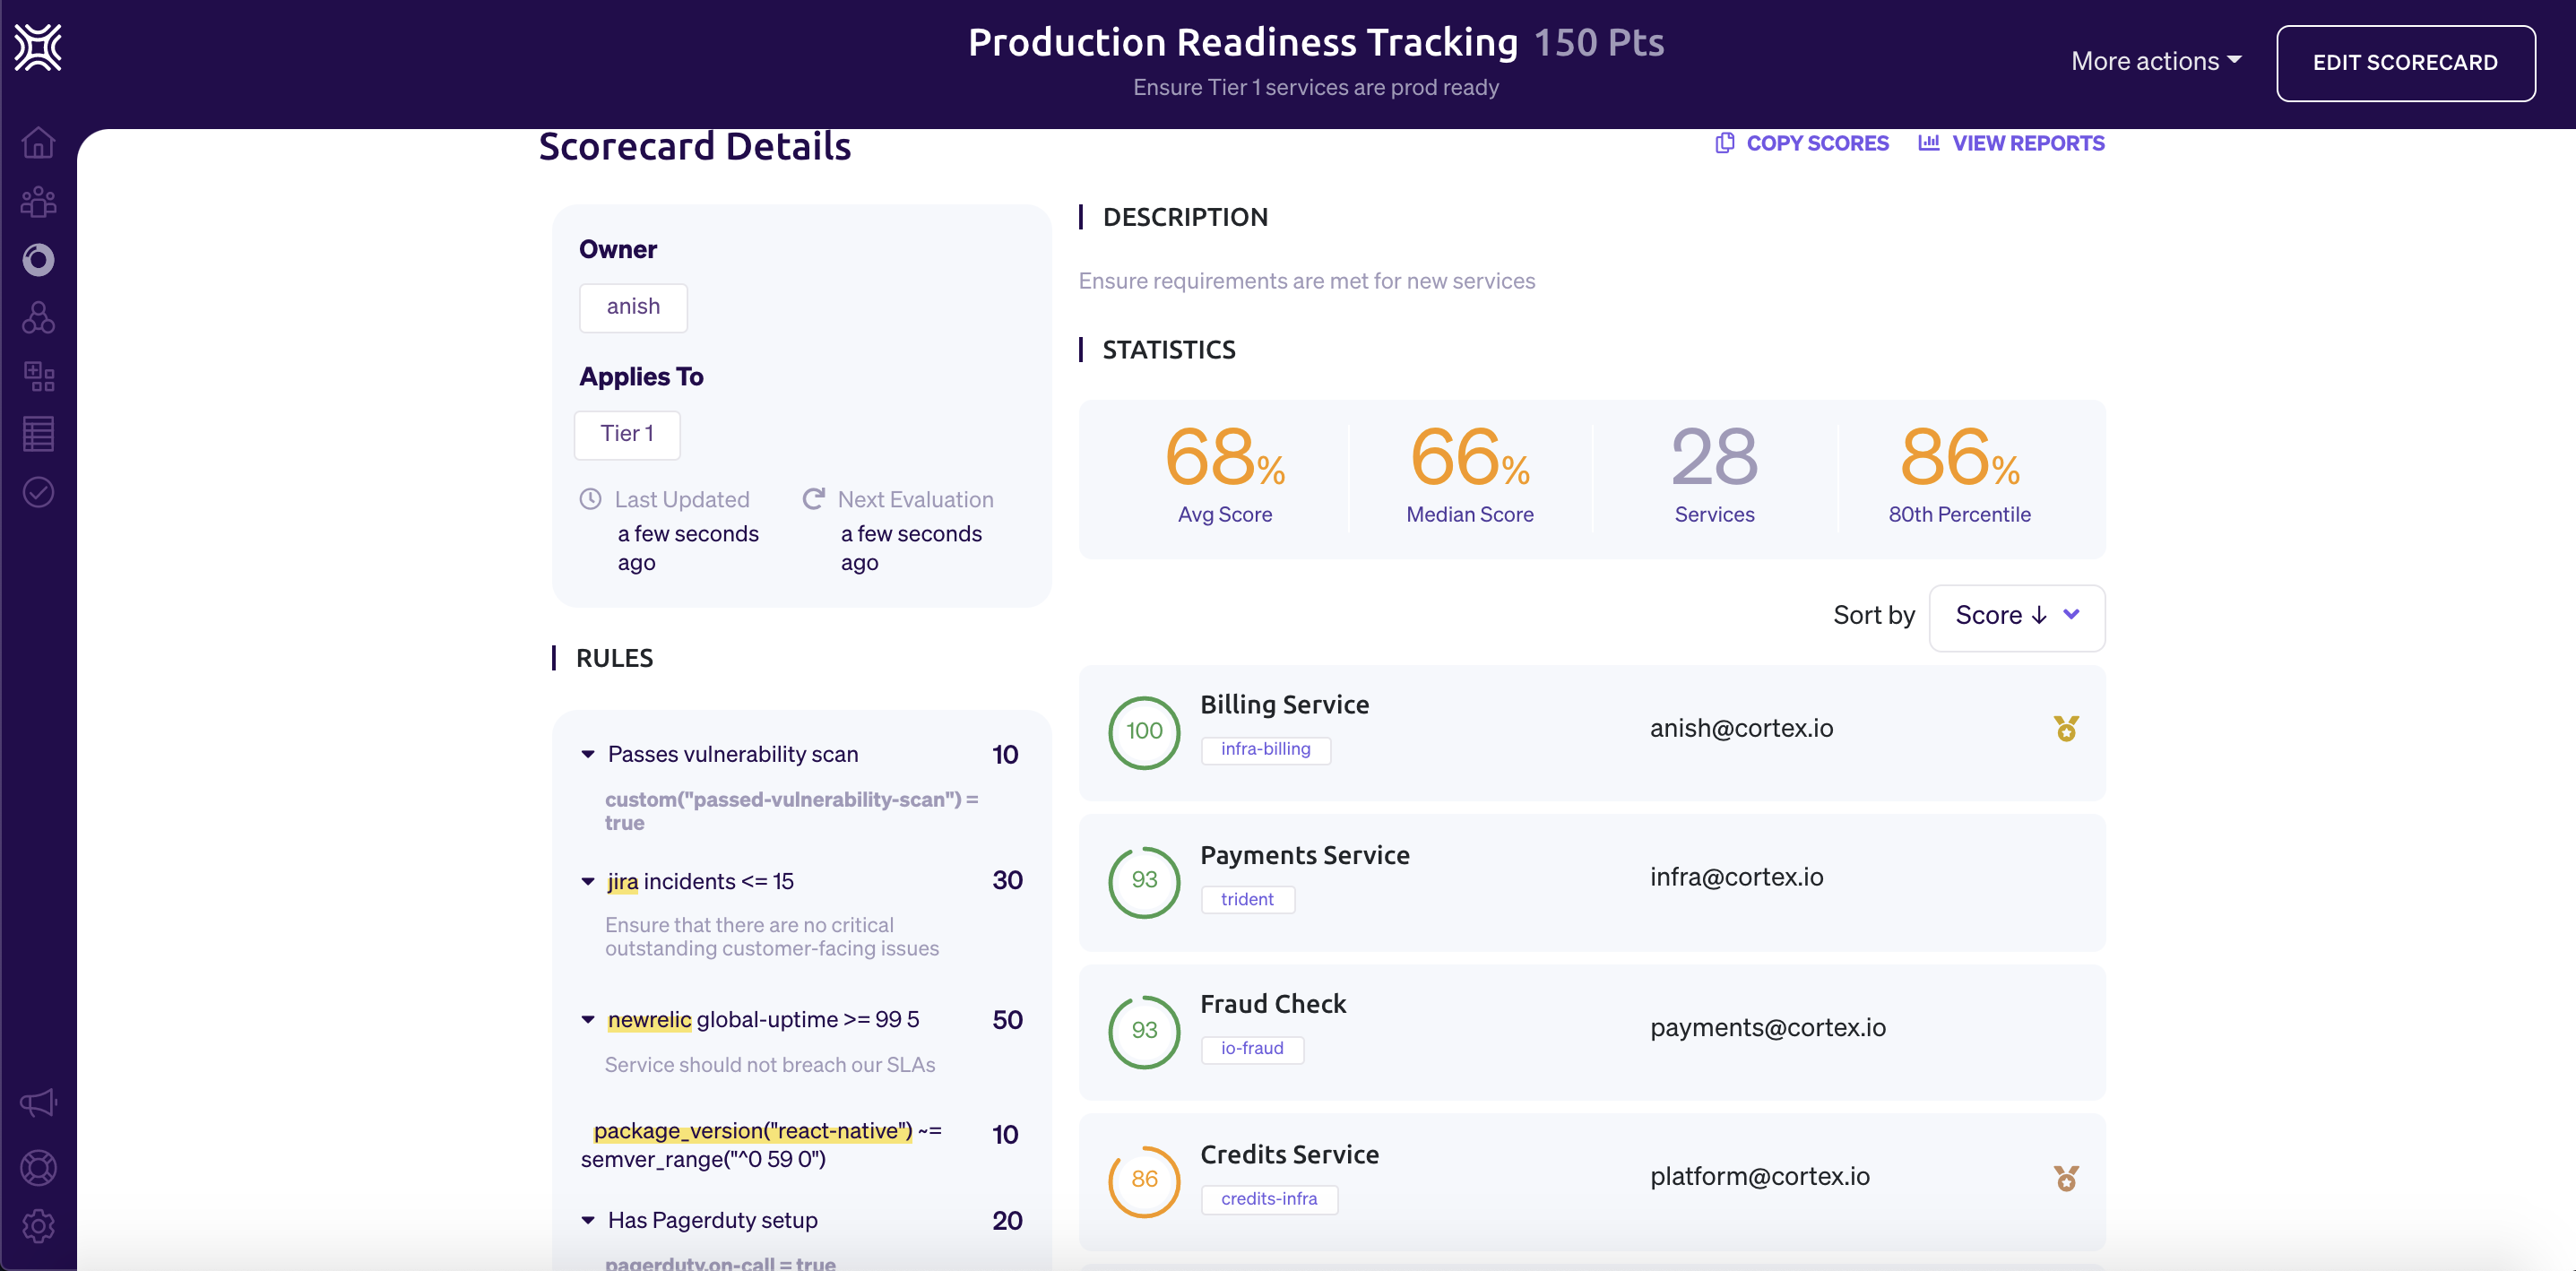
    Grades can also be assigned to specific microservices based on associated metrics. That approach allows DevOps teams to apply gamification techniques using a scorecard to encourage developers to continuously improve their microservices. That capability makes it apparent to other developers which microservices can be most reliably employed.

    It may be a while before microservices-based applications dominate the enterprise landscape. Monolithic applications will be running in production environments well into the next decade. However, many of those monolithic applications are essentially being converted into a larger microservice that other applications can invoke via application programming interfaces (APIs) before being eventually being re-engineered into a set of logically connected microservices.

    The one thing that is clear, however, is that as the number of microservices expands, it becomes more difficult to determine precisely what capabilities are already available to highly distributed application development teams.

  • LogicMonitor Introduces Unlimited Log Data Retention

    LogicMonitor Introduces Unlimited Log Data Retention

    LogicMonitor today announced it will provide an option that allows IT organizations to retain an unlimited amount of log data on its software-as-a-service (SaaS) platform.

    Tej Redkar, chief product officer at LogicMonitor, said one of the issues that is holding back advances in observability is the cost of storing log data. LogicMonitor has decided to remove that issue by allowing IT teams to store log data on its LM Logs service for as long as they require, Redkar said.

    That data will also always be readily available as hot storage with no need to wait for data that has been stored offline to be rehydrated, he noted. Instead, that data is readily accessible alongside the metrics and distributed tracing data that LogicMonitor also collects, said Redkar.

    In general, LogicMonitor is making a case for centralizing observability for the entire IT organization via a SaaS platform infused with machine learning algorithms that automatically surface anomalies in real-time based on millions of events captured via log data. The issue many organizations encounter today is silos of decentralized observability data that are more complex to maintain while providing less visibility at a higher total cost, said Redkar.

    The LogicMonitor platform, in contrast, is designed to be equally accessible to, for example, a network operations team as it is to a DevOps team, he noted.

    Not every organization needs to store log data forever, but Redkar said as IT management continues to evolve, more organizations are moving toward storing metrics, traces and logs for longer periods of time. The rise of open source agent software is also making it less costly for organizations to capture that data in the first place.

    It’s not clear to what degree other providers of observability platforms will provide unlimited retention of data, but as the cost of storing data in the cloud continues to drop it’s apparent that billing IT organizations for storage costs is becoming untenable. There is always going to be some cost associated with storage, but it’s not enough to charge extra beyond the core cost of the service. The only thing accomplished by billing separately for storage is discouraging IT teams from storing the data required to both attain observability and better train the machine learning algorithms that surface anomalies.

    Observability, in one form or another, has been a core tenet of DevOps best practices for years. Initially, DevOps teams focused on continuous monitoring as the most effective way to proactively manage application environments. Observability platforms infused with machine learning algorithms make it possible to correlate events so that analytics tools can more easily identify anomalous behavior in real-time. Armed with those insights, it becomes a lot simpler for IT teams to resolve issues faster.

    In fact, there may even come a day when the so-called “war room” meetings that are convened to identify the cause of an IT issue via a painstaking process of elimination are no longer required. In the meantime, however, the total number of IT incidents that actually lead to disruption should steadily decline, even as IT environments become more complex.

  • Plutora Enhances VSM Platform with Release Insights

    Plutora Enhances VSM Platform with Release Insights

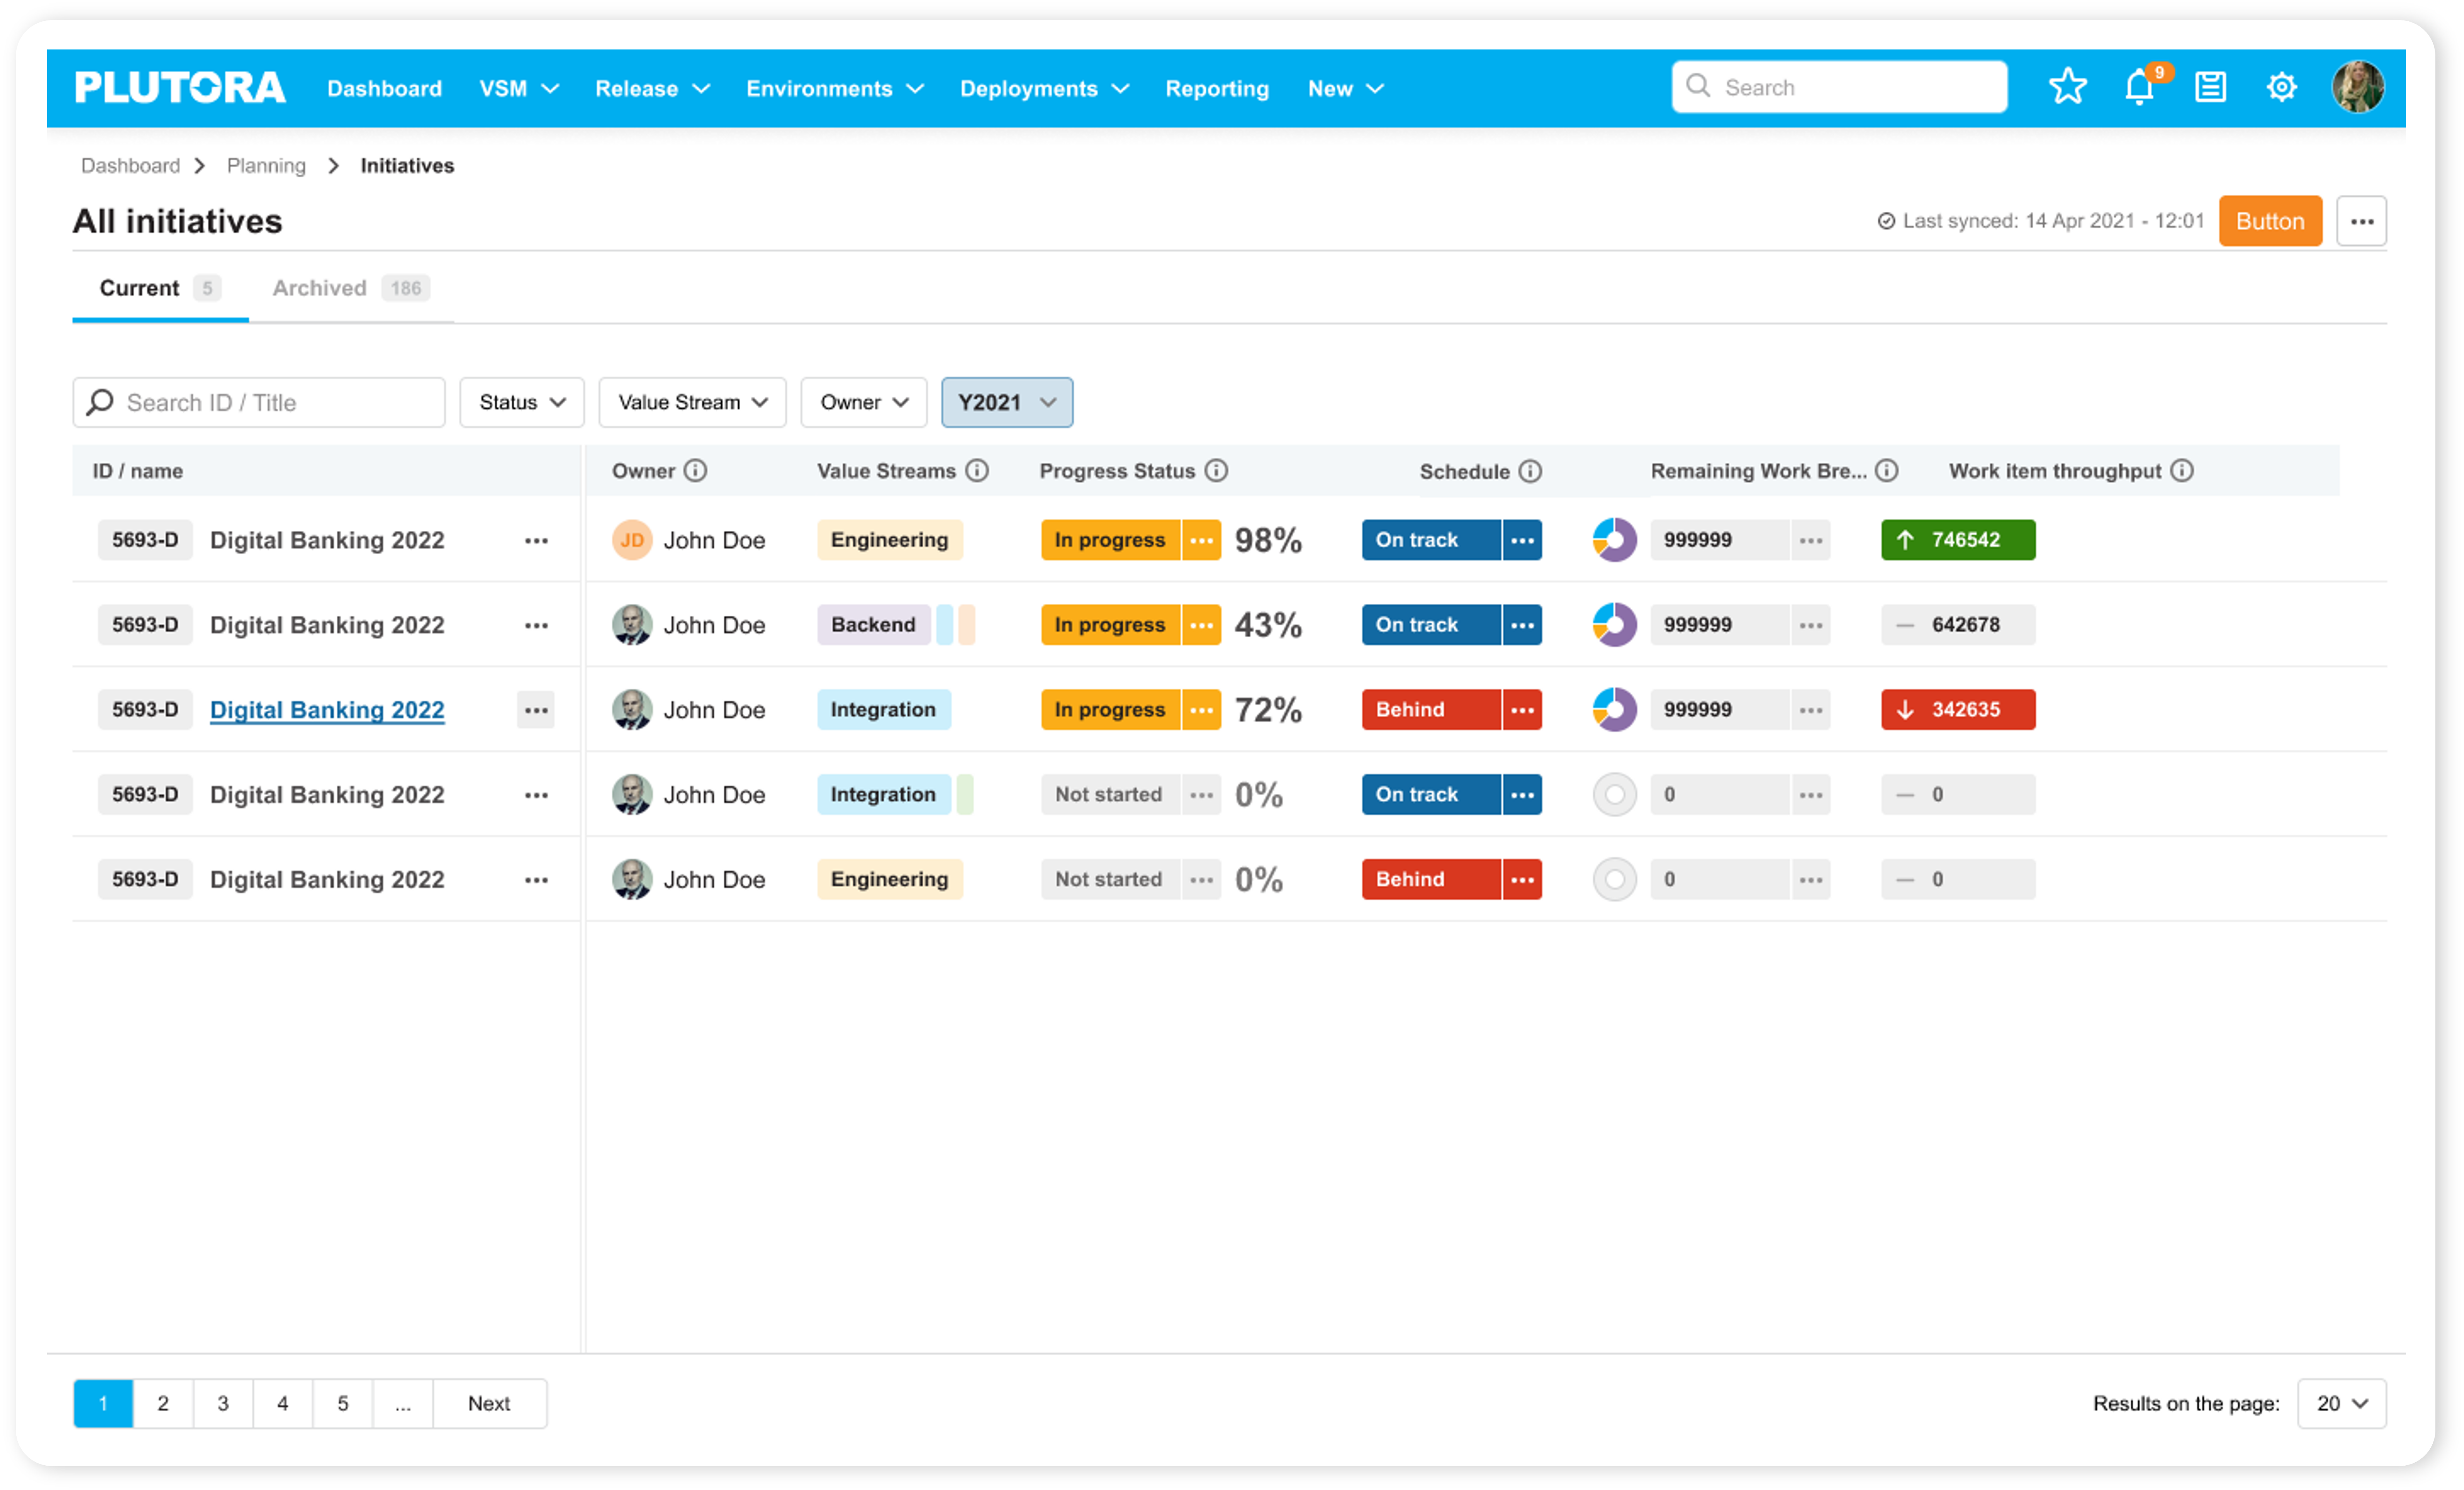
    Plutora has enhanced its value stream management (VSM) platform to provide dashboards that enable DevOps teams to better optimize application delivery.

    Jeff Keyes, vice president of product marketing and strategy for Plutora, said dashboards added to the platform will make it possible for application release managers to leverage predictive analytics to manage application delivery in a more progressive way rather than always having to react to an unexpected event.

    To enable that approach, Plutora has revamped its release insights dashboard that surfaces problem areas and hot spots in addition to adding analytics that track both software builds and larger project initiatives.

    That latter capability is especially critical for executives that currently find it challenging to keep track of multiple software development initiatives, especially those that may have fallen behind schedule without senior leaders being aware of the implications, said Keyes.

    While VSM platforms are typically used by senior IT and business leaders to keep track of how software deadlines are impacting key performance indicators (KPIs) for the business, Keyes said it’s become apparent that application release managers need access to more advanced analytics to optimize application deployment schedules. The Progressive Release Management capability surfaces insights via dashboards in the Plutora platform; that makes it simpler for application delivery managers to optimally orchestrate allocation of resources.

    Release managers, of course, already have access to a wide range of platforms for automating the application delivery process. However, Keyes said, those platforms don’t provide enough insights into how to optimize application delivery across a DevOps workflow made up of disparate tools and platforms. Plutora enables release managers to employ value stream flow metrics and more traditional DevOps metrics to reduce cycle times and improve overall DevOps throughput.

    Keyes said once organizations are provided with that insight, they should also be able to reduce the overall fatigue level many DevOps teams currently experience by removing friction within those workflows. In fact, that fatigue level is a major reason why there is so much turnover in many DevOps teams, he noted.

    It’s not clear how many organizations have a dedicated application release team, but optimizing the software delivery process is a major challenge for almost every DevOps team. While many organizations routinely make use of continuous integration (CI) tools to build applications faster, continuous delivery of applications has proven to be a more elusive goal. This is largely because each platform on which applications are deployed tends to be unique. As a result, many DevOps teams still rely on spreadsheets to manually manage application deployments.

    However, as the pace at which applications are being built continues to accelerate, it’s clear that application delivery is becoming a bottleneck. VSM platforms provide a means of applying analytics to optimize a process that can then be used to make better-informed decisions that might convince more organizations to automate application delivery. That assumes, of course, that the organization had the foresight to invest in a VSM platform capable of surfacing those insights in the first place.

  • Nobl9 Adds Hydrogen Platform to Surface Technical Debt Issues

    Nobl9 Adds Hydrogen Platform to Surface Technical Debt Issues

    Nobl9 today unveiled a Hydrogen platform that makes it simpler for DevOps teams to identify technical debt issues as they manage service level objectives (SLOs) as code.

    Hydrogen enables DevOps teams to define SLOs using a simple wizard or by embedding code within their application as part of a DevOps workflow. That code is then used to automatically collect data from platforms such as Datadog, New Relic, Prometheus, Splunk and others with requiring any additional instrumentation.

    Nobl9 COO Kit Merker said that approach also makes it possible to surface technical debt that inhibits achieving those goals via the Hydrogen platform. Armed with those insights, it then becomes easier for DevOps teams to focus on reducing or eliminating that technical debt because Hydrogen automatically generates a ticket in the Jira project management application—widely used by DevOps teams—to make sure the issue is addressed. Otherwise, in the heat of a DevOps sprint, the issue is likely to be forgotten as the application development project continues to move forward, noted Merker.

    The ability to identify that technical debt is an outgrowth of the ability to manage SLOs as code that is enabled by the core Nobl9 software-as-a-service (SaaS) platform. Hydrogen extends that capability by automating workflows whenever a specific service shows indications that it cannot meet objectives because of a dependency on a legacy platform that needs to be upgraded, added Merker.

    There is also a service health dashboard that organizes SLOs into logical groups that are mapped to features via labels, which Merker noted makes it possible for multiple stakeholders to easily identify which issues affect a particular service most. Hydrogen can also trigger a variety of automated workflows to prompt additional investigations that escalate as services worsen.

    Overall, Hydrogen is designed to provide engineering teams with more accurate context that can be used to prioritize which issues should be addressed first during any technical debt planning cycle, said Merker. Hydrogen can enforce code release policies based on technical debt budgets that are enforced via integrations with continuous integration/continuous delivery (CI/CD) platforms.

    Technical debt generally refers to any code change that is required to optimize a service that is not immediately addressed. The more legacy platforms there are in an IT environment, the higher that technical debt tends to become. At a time when more organizations are building and deploying microservices-based applications, that technical debt, over time, tends to adversely affect applications that are much more dependent on external services than a traditional monolithic application. A single technical debt issue can have a cascading impact on multiple microservices-based applications that would, otherwise, would be difficult to detect.

    The challenge, of course, is that technical debt doesn’t always get the attention it deserves when most of the IT team is focused on rolling out the next great application. However, as application environments become more complex it may only be a matter of time before all the technical debt that is being accumulated becomes unsustainable.

  • Era Software Adds SaaS Edition of Log Management Platform

    Era Software Adds SaaS Edition of Log Management Platform

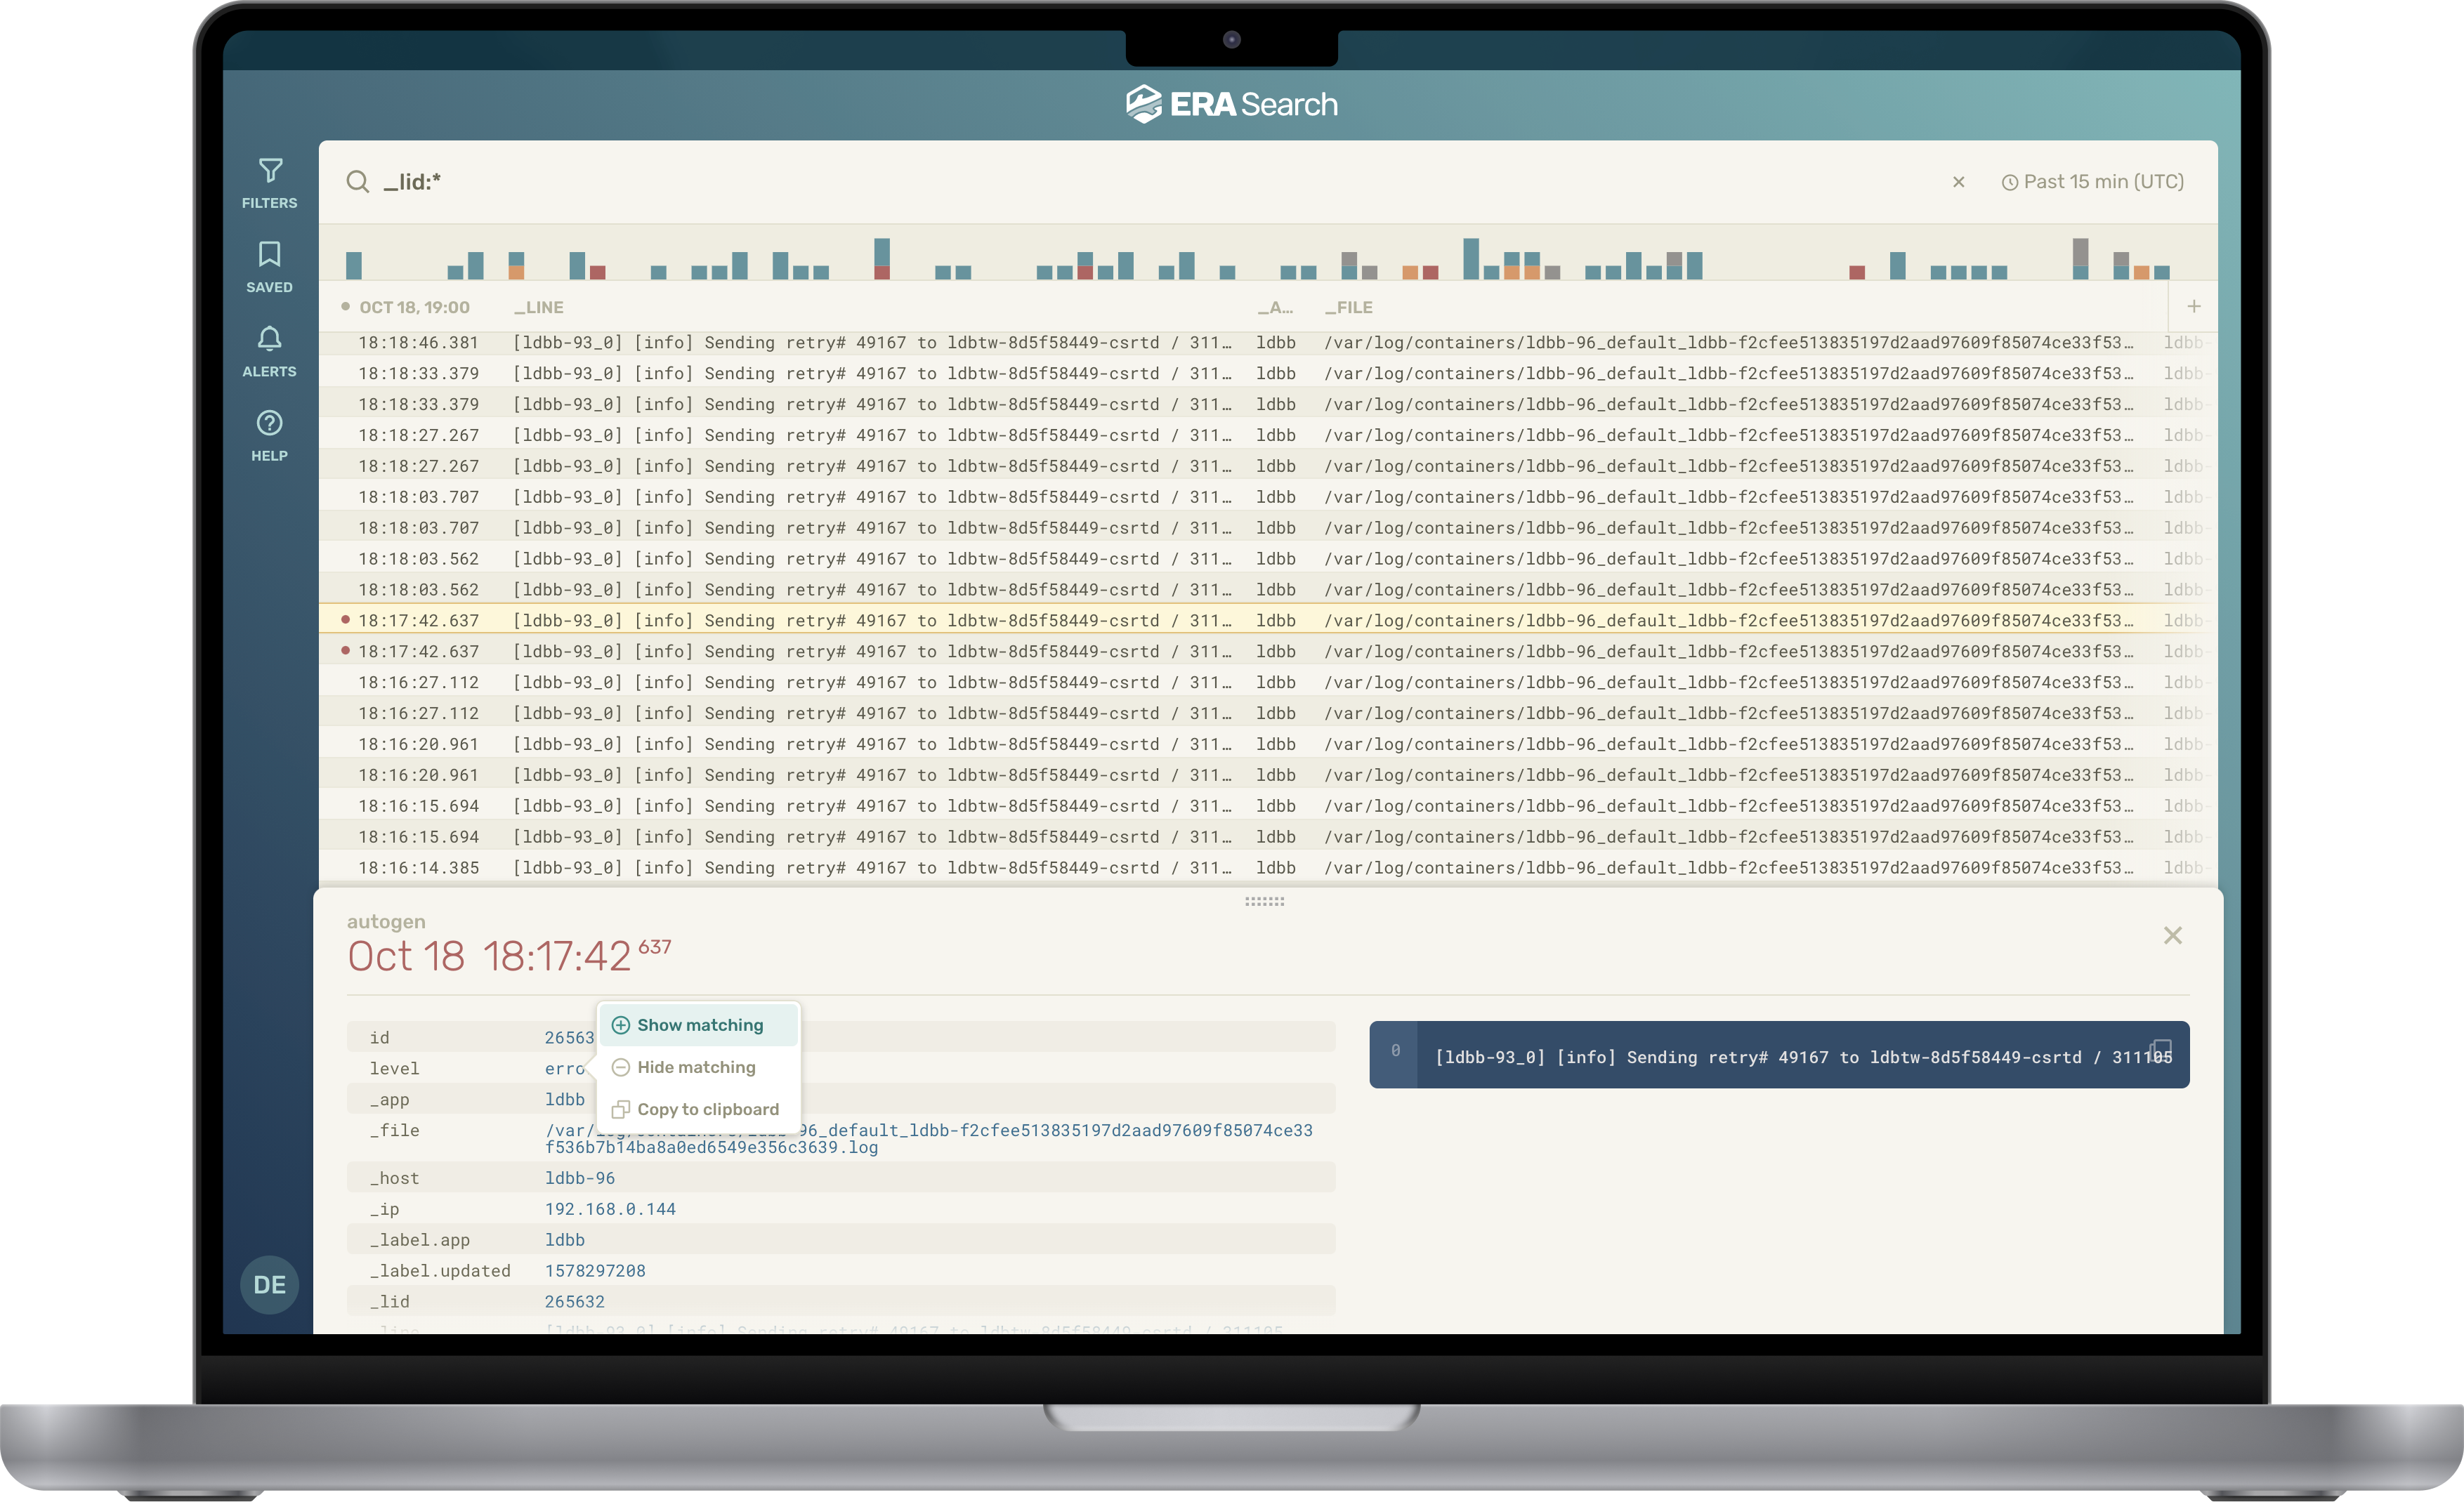
    Era Software has unfurled a software-as-a-service (SaaS) edition of its platform for collecting and managing log data that is based on a time-series database it built.

    At the same time, the company has revamped the user interface of the underlying EraSearch log management platform that IT teams can deploy themselves to make it simpler to troubleshoot IT issues.

    Stela Udovicic, senior vice president of marketing for Era Software, said the EraCloud edition of the log management platform provides a more accessible way to access a log management platform based on an object storage system that can handle any type of log data.

    There’s also an indexing engine based on machine learning algorithms that enables the platform to scale better than rival platforms, she noted.

    Available via the Amazon Web Services (AWS) marketplace, EraCloud collects, indexes and analyzes log data from cloud applications, Kubernetes and IT infrastructure platforms to provide a centralized means of collecting data at a lower cost. In addition to being able to continuously monitor billing costs, an EraSearch cluster can now be provisioned in minutes.

    Era Software, previously known as EraDB, earlier this year raised an additional $15.25 million in financing to drive development of a log management platform that provides an alternative to open source platforms, such as Elasticsearch, that don’t scale as well. The result is a higher total cost as the volume of log data that is less efficiently managed via Elasticsearch steadily compounds. As part of that effort, the company also supports a subset of the Elasticsearch application programming interface (API) to facilitate transitioning from Elasticsearch.

    Many organizations today already have terabytes of log data they are trying to manage and store, noted Udovicic.

    It’s not quite clear how many IT organizations are considering alternatives to log management platforms. However, as the amount of log data that IT teams want to be able to store over a longer amount of time increases—in part to facilitate greater observability—the pressure to contain the cost of retaining all the data is also rising.

    Observability, in general, requires combing logs, metrics and traces—a specialized form of logging—in a way that makes it easier to identify the root cause of an issue by querying data. It differs from monitoring in that observability is achieved using a predefined set of metrics that track whether a platform or application is performing within expectations.

    It may be a while before most IT teams generally achieve observability, but the journey typically starts with finding a more efficient way to collect log data in both proprietary and open source formats. Rather than having to normalize all that data, Era Software is making a case for analyzing that data in whatever format it happens to be available.

    One way or another, a much larger percentage of the applications deployed by IT teams in production environments will have to be instrumented to achieve observability. The issue now is determining how best to make all the data collected from those applications available to DevOps teams at a reasonable cost.

  • Google Makes Fuzz Testing Integration Tool Available

    Google Makes Fuzz Testing Integration Tool Available

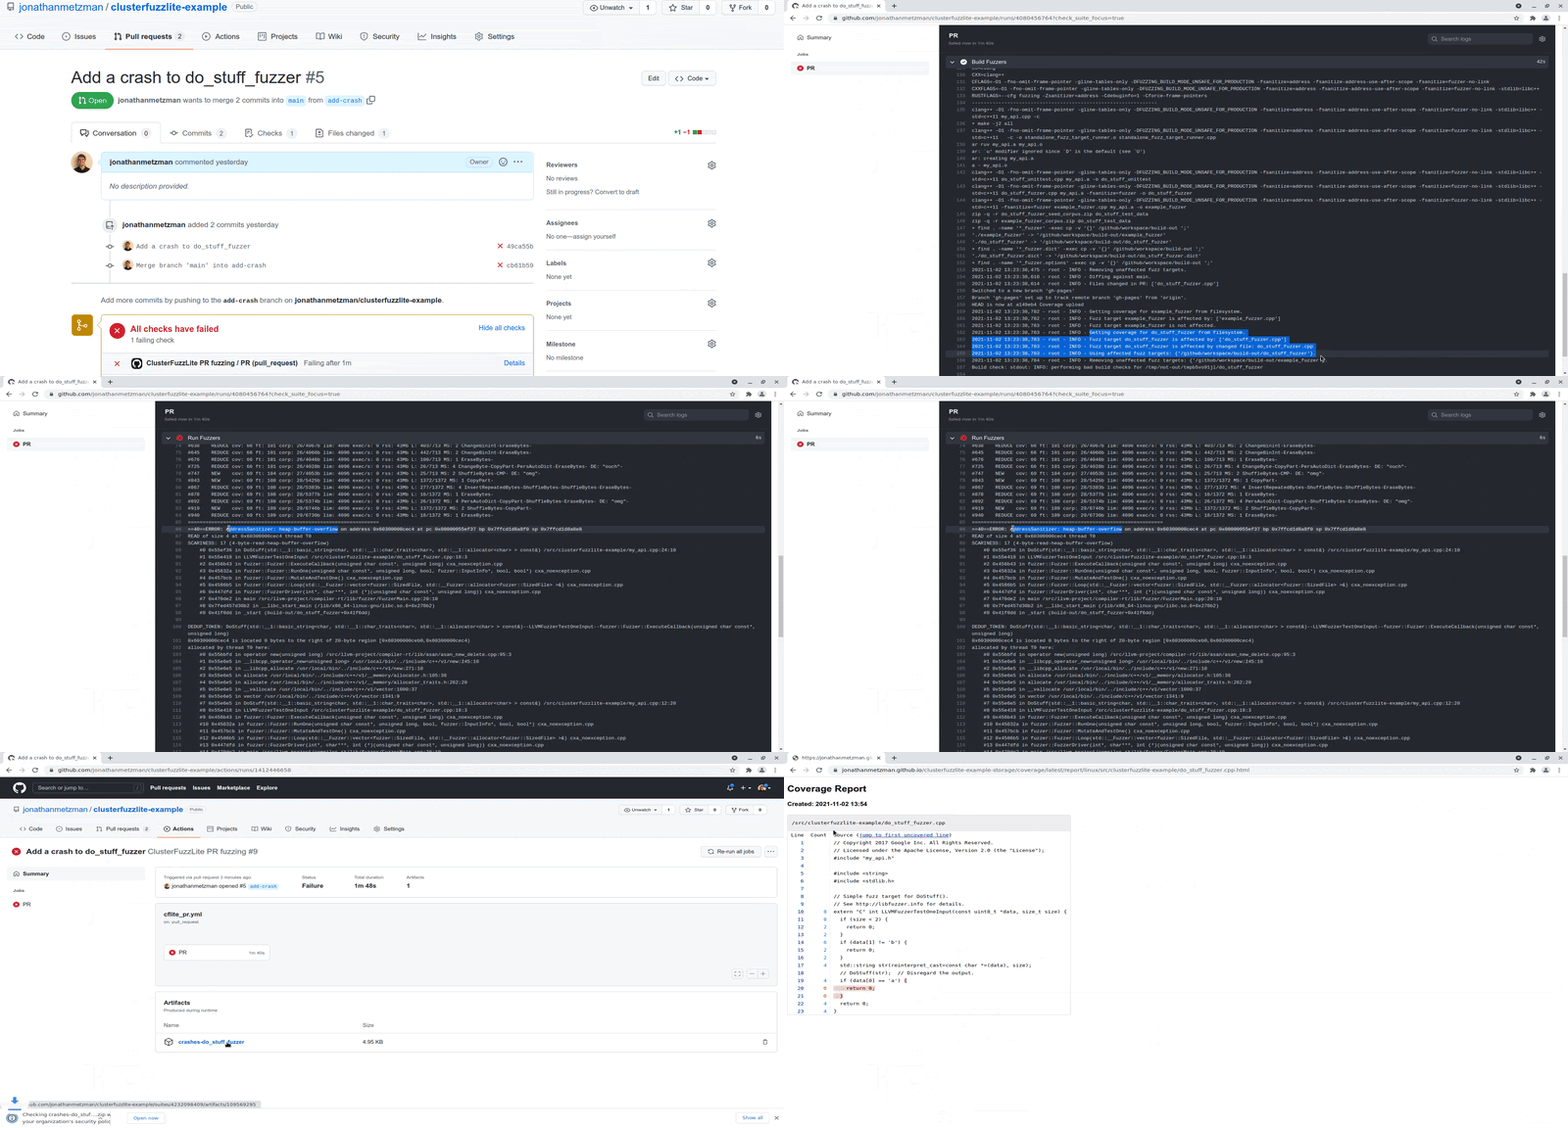
    Google today made available a ClusterFuzzLite tool that makes it simpler to incorporate fuzz testing into a DevOps workflow.

    Fuzz testing refers to an automated software testing technique that involves providing invalid, unexpected or random data as inputs to an application to discover issues such as potential memory leaks.

    Jonathan Metzman, a senior software engineer for Google, said ClusterFuzzLite is a lighter-weight version of a tool that Google makes available to its internal development teams. It is not a fuzz testing tool itself, but rather a tool that makes it easier to surface the results of a fuzz test within a DevOps workflow. Once those results are surfaced, it then becomes easier for developers to address issues before an application is deployed in a production environment.

    Core capabilities enabled by ClusterFuzzLite include continuous fuzzing, sanitizer support, corpus management and report generation tools. The goal is to make fuzz testing more accessible to a broader range of developers as part of an overall effort to embrace DevSecOps best practices, noted Metzman.

    ClusterFuzzLite currently supports GitHub Actions and Google Cloud Build, but Metzman said it is easily extensible to other DevOps platforms. It is designed to run as part of a DevOps workflow by adding a few lines of code to a continuous integration/continuous delivery (CI/CD) workflow.

    Google has already made ClusterFuzzLite available to open source projects, but is now providing additional access for commercial developers. Since its release in 2016, over 500 critical open source projects have integrated into the Google fuzz testing program for open source software, resulting in over 6,500 vulnerabilities and 21,000 functional bugs being fixed.

    In the wake of recent guidelines issued by the U.S. National Institute of Standards and Technology (NIST) that were themselves in response to an executive order issued by president Biden, the number of organizations using fuzz testing is expected to increase now that NIST has determined that fuzz testing is a minimum standard requirement for code verification.

    For several years, Google has been making a concerted effort to improve the security of open source software. The challenge for all developers is finding a way to build more secure applications without slowing down the rate at which they are deployed. Fuzz testing makes it possible to identify issues much earlier in the application development life cycle versus just before an application is deployed.

    Less clear, of course, is whether developers are starting to use these tools on their own or if the increased adoption is because of a concerted effort by their organization to embrace DevSecOps best practices. Regardless of the motivation, however, the overall state of application security should continue to improve as it becomes simpler for developers to invoke more advanced testing tools.

    In the meantime, organizations of all sizes are reviewing how they construct software in the wake of a series of high-profile security breaches. In theory, at least, increased focus on software supply chains should prevent issues from arising after deployment when they become much more costly to remediate.

  • Akamai Brings Web Application and API Security Together

    Akamai Brings Web Application and API Security Together

    Akamai Technologies, Inc. this week launched a service that consolidates the process of securing both web applications and application programming interfaces (APIs).

    Amol Mathur, vice president of product management and strategy for Akamai, said with the launch of App & API Protector the managed security services provider is making it easier for IT teams to embrace DevSecOps best practices via a converged web application and API (WAAP) service rather than using separate tools and services to secure them individually.

    The service is also designed to continuously discover API requests that are then automatically inspected for malicious code. Optional API security controls can be enforced based on policies defined by internal IT teams.

    In addition, the company provides access to a multidimensional threat scoring model, dubbed Adaptive, that combines data collected by Akamai with data and metadata from each web and API request to help organizations better understand which threats require immediate attention. Security events are also continuously analyzed using machine learning algorithms to deliver highly accurate policy-by-policy tuning recommendations that can be implemented via a single click.

    Akamai security researchers also make use of machine learning and data mining techniques to continuously analyze over 303TB of daily attack data that is used to automatically update protections. Alternatively, organizations can opt to manually evaluate that data themselves to minimize any unexpected impacts those updates might have on their applications.

    Other capabilities include built-in bot mitigation tools that are informed by a directory of more than 1,500 known bots, integrations with the Akamai command-line interface (CLI), Terraform or scripts used to drive automated pipelines spanning a continuous integration/continuous delivery (CI/CD) platform.

    Akamai

    A recent report published by Akamai found that between January 2020 and June 2021 there were more than 11 billion total attempted attacks made over an 18-month period. The most common attack vector was SQL injection (SQLi) at 6 billion attacks, followed by local file inclusion (LFI) with 3.3 billion attacks and cross-site scripting (XSS) with 1.019 billion attacks.

    The report also found credential stuffing attacks reached more than one billion attacks and peaked between January 2021 and May 2021. Distributed denial-of-service (DDoS) attacks reached a peak of 90 in January of 2021.

    Akamai has been making a case for outsourcing the management of web application and API security via the content delivery network (CDN) it created. Its CDN provides a layer of isolation between web-facing applications and the rest of the enterprise. The challenge organizations now routinely face is that, as they move to deploy cloud-native applications based on microservices, responsibility for security has become more decentralized. The security services provided by Akamai create an opportunity to better manage application security via a single pane of glass at a time when there is more focus than ever on securing software supply chains, said Mathur.

    It’s not clear to what degree organizations are going to rely more on managed security services as part of a larger effort to embrace DevSecOps best practices. However, at a time when application security expertise is hard to come by, it’s becoming apparent that, in many instances, relying on an external service provider to secure application environments is the simplest way to quickly improve the overall security posture of any organization.

  • Data Theorem Adds Runtime Protection Enabled by Observability

    Data Theorem Adds Runtime Protection Enabled by Observability

    Data Theorem, Inc. this week added an Active Protection offering to its portfolio of application security services that makes it possible for DevOps teams to embed observability and runtime defenses in their applications via a software development kit (SDK).

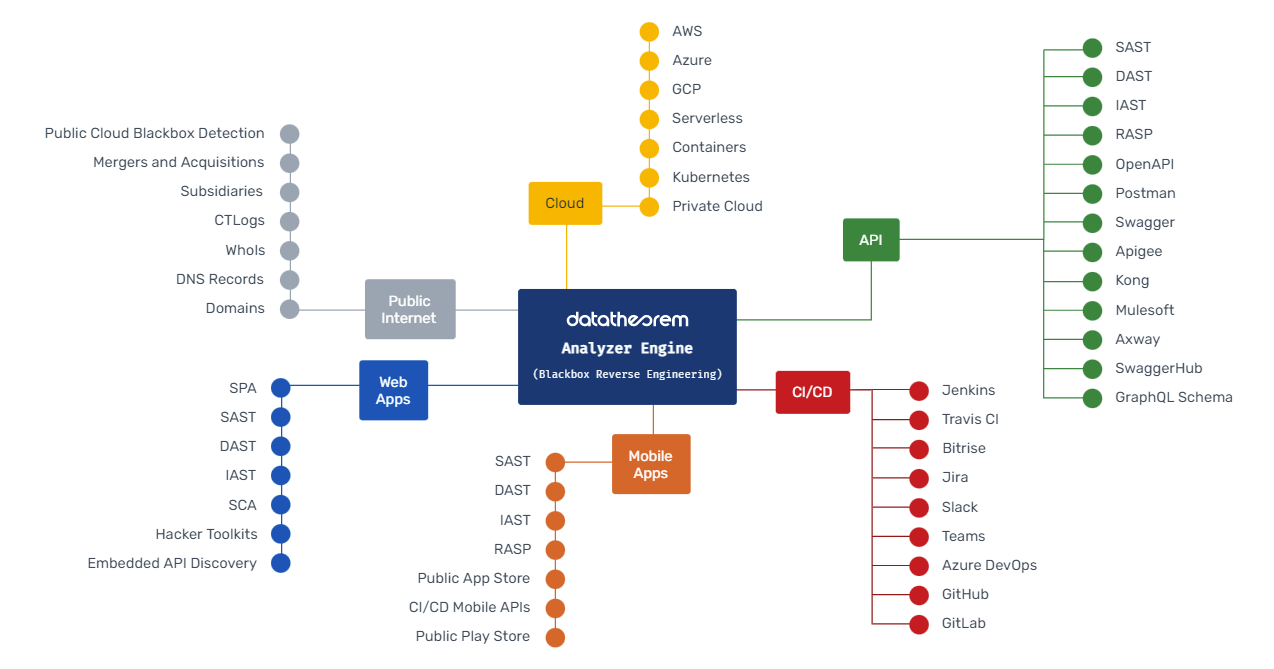
    The Data Theorem cloud services are based on Trustkit, an open source framework the company created to make it easier to employ secure socket layer (SSL) to encrypt connections and Analyzer Engine, its runtime analytics engine.

    The company is now extending its services to make it possible to embed observability capabilities by collecting logs and traces. Those logs and traces are then used to enforce runtime security policies that protect applications from known attacks from malicious sources and other common attack vectors as defined by the Open Web Application Security Project (OWASP) Foundation. It also prevents violations of encryption levels, authentication types and authorization rules along with a variety of custom rule checks, including preventing broken object-level authorization (BOLA) attacks.

    Doug Dooley, Data Theorem COO, said Active Protection can be applied across any application stack, including microservices applications based on cloud-native frameworks. In contrast, existing approaches to securing application runtimes based on web application firewalls (WAFs), runtime application self-protection (RASPs) or endpoint detection and response (EDR) agents cannot be applied to cloud-native applications based on containers and serverless computing frameworks.

    Active Protection solves that issue because it is designed to be applied via the Data Theorem software development kit (SDK) or using application extensions made available via a serverless computing framework or as a container sidecar.

    Dooley noted that the Active Protection service is also designed to be fully integrated with DevSecOps workflows that are increasingly being driven via continuous integration/continuous delivery (CI/CD) platforms to enable continuous, automated security inspection and remediation. The company claims to have detected more than one billion application incidents and is currently used by more than 8,000 applications.

    Developers don’t generally set out to build and deploy insecure applications. The issue is most developers don’t have a lot of security expertise, so it’s easy for mistakes to be made. Organizations looking to embrace DevSecOps best practices need to find a way to achieve that goal in a way that developers can easily embrace. The more automated the checks for security issues become during the application development process, the more likely it is developers will make additional efforts to remediate vulnerabilities long before an application is ever deployed in a production environment. In effect, DevSecOps is easier to achieve when addressed from the bottom up rather than via an edict from above without any real implementation plan in place.

    It’s still early days as far as DevSecOps is concerned, but as best practices for DevOps continue to evolve, there may come a day when security is just another gate that needs to be passed within the context of a larger DevOps workflow. In the meantime, DevOps teams and cybersecurity teams should put aside their differences and work together as the number of attacks launched against applications increases.

  • Dynatrace Adds Security Gates to Advance DevSecOps Adoption

    Dynatrace Adds Security Gates to Advance DevSecOps Adoption

    Dynatrace today added a security gates capability to its observability platform to make it easier to automatically embrace DevSecOps best practices within an application delivery pipeline.

    Steve Tack, senior vice president for product management at Dynatrace, said the security gates function much the same as the quality gates that Dynatrace previously added to that platform in that each release is now also automatically assessed to ensure only secure code is being deployed.

    The Dynatrace platform now uses a Davis artificial intelligence (AI) engine to scan for vulnerabilities in application workloads in real-time and then prioritizes them based on the risk they pose, noted Tack. The goal is to make it simpler for organizations to incorporate security reviews in application development processes in a way that doesn’t necessarily require developers to become security experts, he added.

    Instead, the core DevOps platforms should be capable of identifying issues that can be remediated before an application is ever deployed in a production environment, said Tack.

    Dynatrace earlier added an ability to automatically identify the software libraries and open source packages that present the greatest security risk. The security gates capability now extends the scope of that effort to include applications as they are constructed using custom code.

    In general, most organizations are looking for ways to embrace DevSecOps best practices. The challenge is achieving that goal without unduly slowing down the rate at which applications are developed. In fact, a recent survey commissioned by Dynatrace found, on average, organizations expect to increase the frequency of their software releases by 58% over the next two years. However, nearly a quarter (22%) of respondents admit they’re often under so much pressure to meet the demand for application deployments that they must sacrifice code quality, which broadly includes security issues.

    It’s not clear to what degree security reviews will automatically be included within a quality assurance process, but Tack said the goal should be to limit human involvement in the application deployment process as much as possible. The issue many development teams encounter today is that applications are being rejected by cybersecurity teams that are reviewing applications just before they are deployed, noted Tack. As a result, developers are racing to build applications faster only to see them rejected and returned to them at the last possible moment, he added.

    In the wake of a series of high-profile software supply chain breaches, the focus on DevSecOps has increased substantially within most organizations. It’s often not precisely clear who is responsible for application security, but as DevOps platforms continue to evolve, there may come a day when security issues are routinely addressed within every DevOps workflow.

    In the meantime, there needs to be a lot more focus on bridging the divide between DevOps and security teams. Given the chronic shortage of security professionals, there’s no doubt DevOps teams need to assume more responsibility for application security. The challenge and the opportunity is finding a way to achieve that goal with the least amount of friction possible.

  • Allstacks Adds Free Dashboard to Track Software Dev Benchmarks

    Allstacks Adds Free Dashboard to Track Software Dev Benchmarks

    Value stream intelligence platform provider Allstacks today added a free live dashboard populated with anonymized data that DevOps teams can use to benchmark their own progress.

    Hersh Tapadia, Allstacks co-founder and CEO, said the company is making this data available to make it easier for DevOps teams to uncover bottlenecks in their software development processes.

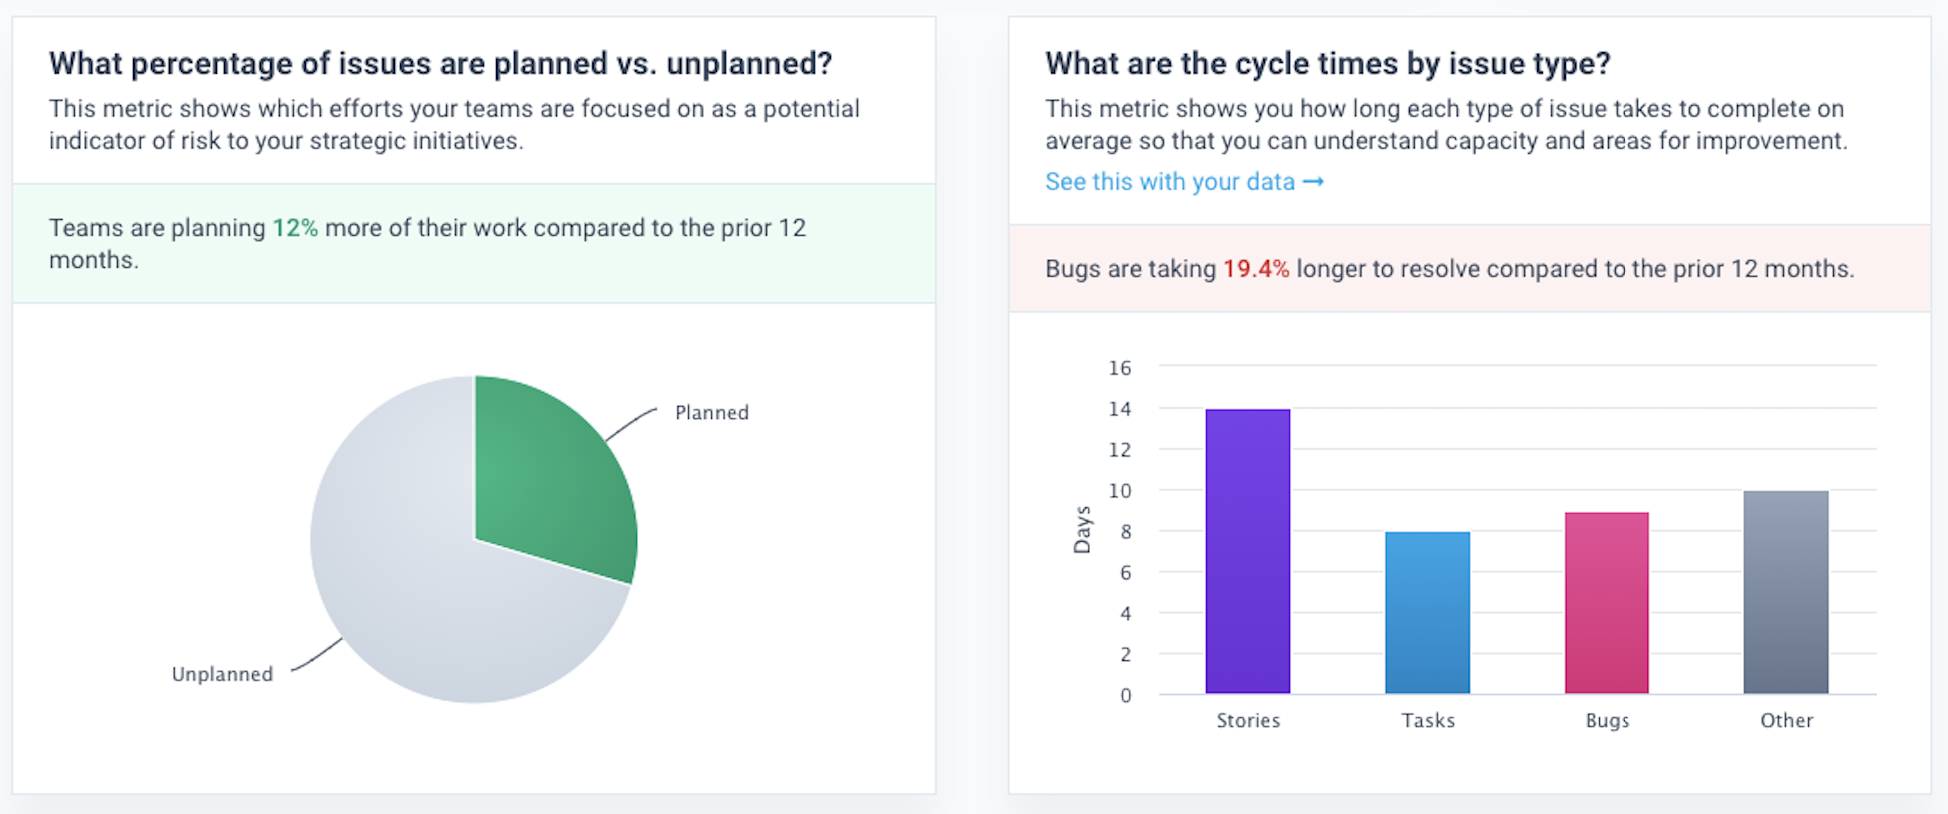
    As part of that effort, the dashboard includes pre-configured benchmarks for the following:

    How many days per week do benchmark teams write code?
    What percentage of issues are planned versus unplanned for benchmark teams?
    What are the cycle times per issue type for benchmark teams?
    What types of code do benchmark companies produce?
    What is the average commit size for benchmark customers?

    Allstacks

    Allstacks has committed to making 12 months of data publicly available on the dashboard and said it will update that data on an ongoing basis. Allstacks customers, however, can also access five years of data to compare historical trends.

    Tapadia said Allstacks plans to add additional benchmarks to a dashboard that can collect data via the various application programming interfaces (APIs) that most DevOps tools now routinely provide. The overall goal is to increase transparency into software development processes, he said.

    Allstacks’ value stream intelligence platform uses machine learning algorithms and artificial intelligence (AI) models to identify projects that are at risk of not meeting delivery goals. That data is then used to analyze the impact those missed deadlines are likely to have on various business objectives.

    Value stream management platforms automatically take technical metrics, gathered via a DevOps process, and match them to a set of key performance indicators (KPIs) defined by business leaders. The challenge many organizations still face is making sure they have the tools in place to collect the appropriate technical metrics and then define the KPIs that truly matter to the business. Once those metrics are gathered and KPIs established, organizations are then able to apply advanced analytics to the massive amounts of DevOps data they collect.

    The concept of value stream management traces its lineage back to lean manufacturing methods, which called for each step of a manufacturing process to be continuously measured. As software development has evolved from being a craft to a process that is highly automated using DevOps best practices, an appreciation for the value of monitoring the impact of missed software development deadlines on the business has grown as organizations realize how dependent they are on software.

    As a result, more organizations realize there is a clear disconnect between their business goals and development processes, noted Tapadia. Business leaders are especially anxious to understand how a software development project delay might impact future revenue projections. Rather than being a set of tools employed mainly by IT leaders to track software development projects, value stream management platforms make it possible for other stakeholders to track KPIs spanning multiple software development projects. It then becomes easier to make informed decisions about how to reassign resources across various projects as different bottlenecks are encountered.

    It may be a while before organizations achieve that level of transparency into their software development processes, but as software continues to ‘eat the world,’ it’s only a matter of time before value stream management becomes a required set of DevOps tools for every organization.