Author: contributor

  • Advancing DevOps with Diagrams

    Advancing DevOps with Diagrams

    The Application model can be incredibly useful to map out application features, planned changes and current flaws, and even for roadmapping. The model takes organizational time and effort, and can only be created and maintained when a universal language has been developed by a modeling team. The effort is well worth the cost, however, since it can lay the foundation for a better DevOps environment.

    The modeling team will represent various organizational backgrounds and must bridge gaps of understanding that are common between technical and non-technical personnel. The team also will include operations and development professionals so that collaborations produce not just deeper understandings, but also lay framework that meets, corporate, Dev and Ops needs from the beginning.

    Diagrams can be used by the modeling team to foster the understanding and creation of a universal language by adding more context to ideas and processes. Diagrams serve as a drill-down exercise and can be drawn on a whiteboard, sketched on a notepad or formalized with a UML tool.

    Diagrams become more technically correct as they are iterated on, and can be easily retained for future discussions. Further, the base of some diagrams often enable other types of diagrams that can be helpful to the development team (such as Class or ERD) and provide a level of technical documentation. They also provide a base of discussion for the modeling team to relay discussions back to their organizational units for feedback and improvement.

    Last, and perhaps most importantly, diagrams help to remove ambiguity that is inherent to narrative descriptions and discussions. Removing ambiguity is at the heart of the universal language and enables clear communication, a key tenant of DevOps.

    We can show this drill-down in diagramming by focusing on a small and simple operation: describing what happens when a new customer enters a banking system for a business loan.

    UseCase Diagram

    A common place to start is a UseCase Diagram like the one below.
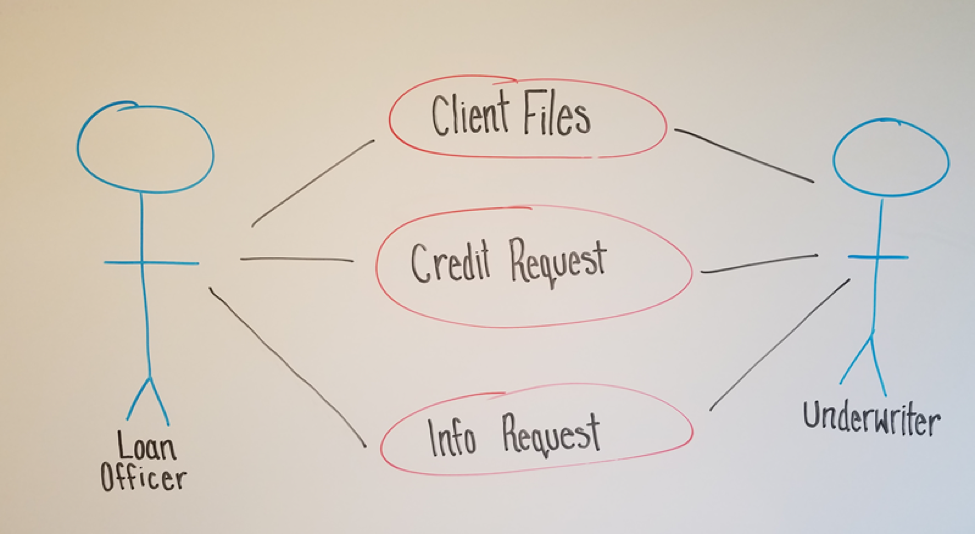
    The diagram shows a few key points of data:

    • There are two types of employees (actors) that are involved: a Loan Officer and an Underwriter
    • The Loan Officer and the Underwriter interact with three business elements: Client Files, Credit Requests, Requested Information

    This diagram might not seem very useful to those outside of the discussion, but it is the first step to creating more in-depth and useful diagrams.

    Activity Diagram

    A logical and easy step from a UseCase Diagram is an Activity Diagram. It takes many of the same concepts and expands them to a step-by-step order of procedures, which are established by discussion of current procedures as well as compliance and regulatory needs.
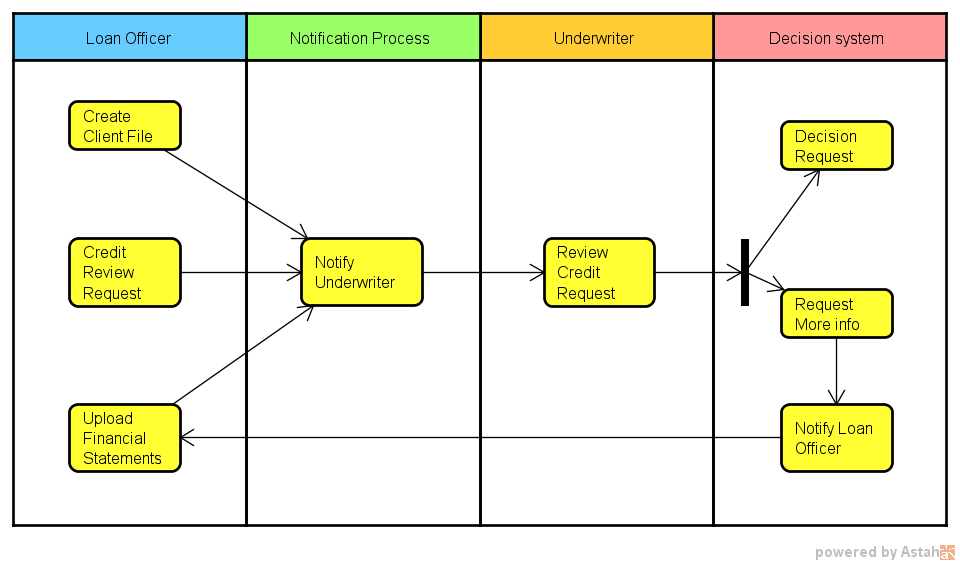
    By partitioning procedures into vertical “swim lanes” we now have an order to the processes as well as who or what is responsible for it.

    The first partition, labeled Loan Officer, shows three processes (Create a Client File, Create a Credit Request, and Upload Financial Statements) that they are responsible for before the system can do anything. All three pieces must be present before moving beyond this first position.

    Once those items are taken care of, the system then notifies the second Actor, the Underwriter, that there is a credit review for him or her to perform as well as where to locate the needed data.

    The Underwriter then decides whether the loan is approved. Whether this is a semi-automated process or done entirely by humans is beyond the scope of this diagram; all we need to know is that a decision happens next. What we can see is that the Underwriter has two options. He or she can:

    1. Decide on the loan (approve or deny—again, beyond the scope), at which case the system takes over from there.
    2. Request more information from the Loan Officer (perhaps the wrong files were uploaded or more data from the client is needed). The system would then notify the Loan Officer and the process starts over.

    Activity Diagrams are useful for documentation because they start to add structure to the overall business process. They also start to define which processes are:

    • Managed by humans
    • Managed by the application being developed
    • Represent a system that the application will interact with, and operations will need to secure

    Even if not 100 percent technically correct (as our sample isn’t entirely correct), they still represent information in a meaningful way that anyone with little or no guidance can understand.

    Data Flow Diagram

    With Data Flow Diagrams (DFD) the diagrams start to map out the system and procedures that happen and the flow of data. DFDs, which are more involved than the other diagrams so far, become keenly useful in showing how different processes interact. Even though DFDs become more detailed as more layers are added, they are still understandable and explainable to any member of the modeling team no matter the background.

    Operations teams often find them helpful since they map out when sensitive data may be accessed or stored. In our example, things such as corporate tax returns will be stored and accessed; there obviously would need to be some security measures implemented to ensure only those with clearance can see them.

    Discussions are key when creating Data Flow Diagrams because it would be very rare for an individual to have all of the knowledge needed to create one without questions and answers. Based on our current diagrams and a few questions such as:

    • Are Client IDs manually created, or is it part of a system?
    • Do requests go to specific people or are they delivered via queue?
    • Is the credit decision part of the original application or saved as a separate file?

    A DFD can be drawn up:
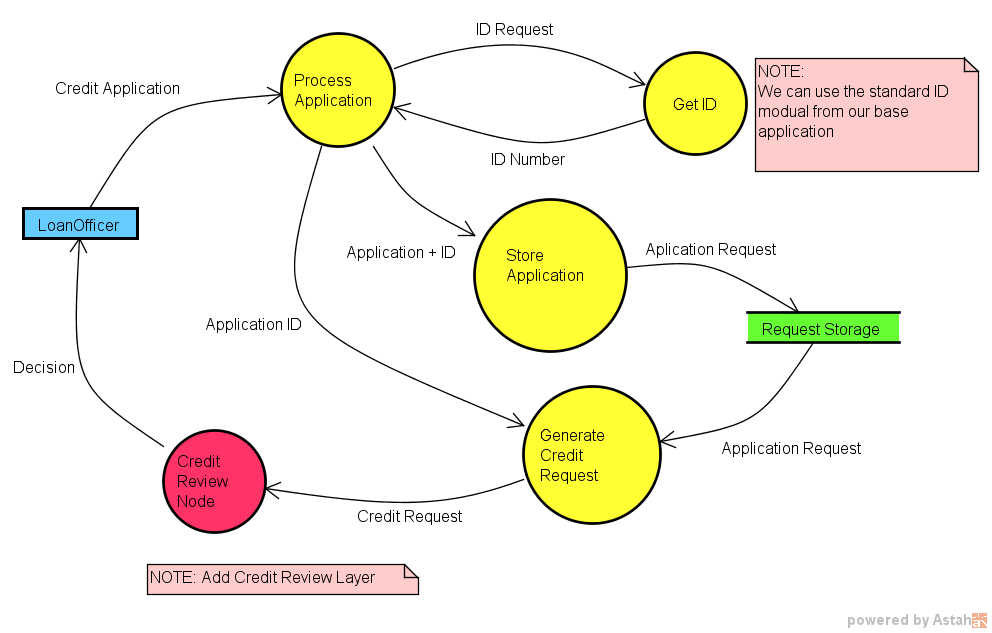
    The DFD may look complex at first, but when taken piece by piece it is quite simple and understandable with very little (if any) explanation. It also can be helpful to the Dev team because it isolates specific processes at a granular level.

    For example, the Dev team may see the process “Get ID,” know that it’s a system process (non-manual) and realize that they already have a module like that in an existing application that they can use for this application.

    Of course, this would be one of many DFDs created during an Application Model, which is another key advantage of using DFDs. Data Flow Diagrams can be layered, starting with a context diagram and working down granularly to the smallest process needed. This layering also naturally helps to break down the application to discreet parts, helping both in creating different parts of the Application Model as well as having natural starting and stopping points for conversations.

    With the idea that there can be many diagrams used during these discussions, it can be useful to use a modeling tool to easily create, edit, layer and store the diagrams for future use.

    Other Diagrams

    Of course, these are only a few diagrams, but they demonstrate how a process of diagramming can be useful to help a modeling team communicate. While a team could start with a Data Flow Diagram, it would be a much more difficult process. However, by walking through a UseCase and an Activity, it becomes easier since it breaks a system down into digestible parts.

    It also provides the modeling team easy-to-understand diagrams when they go back to their business units. They can explain the Application Model and get quality feedback, as well as suggestions to be added into the Model.

    These diagrams also can be helpful for teams as a starting point for documentation. The DFD is a good starting point for:

    • The Development team to create a detailed class and component diagrams that outlines the application architecture.
    • A deployment diagram for Operations to note which data to isolate behind a firewall with limited access.

    While no process of diagramming can create a universal language by itself, diagrams are supremely helpful to create team clarity. They also serve as a memory of Application Model discussion so that human error and memory can be reduced. Last, by helping to eliminate ambiguity among the modeling team, they help drive better communication that is part of the essence of DevOps.

    Note diagrams were created in Astah Professional and used with permission. To learn more about Astah and modeling please visit the company’s website.

    About the Author / Scott Reece

    ReeceScott Reece is a huge fan of the greater visibility and communication enabled by DevOps. As a Friend of Astah Scott has been successfully closing project communication gaps by using models and team building. With more than 10 years of project management experience, Scott currently serves as a Partner Director at Inedo.

  • Getting the Most Out of QA in Complex Environments

    Getting the Most Out of QA in Complex Environments

    We live in a world in which software is increasingly dominant. Not only do we rely ever more on software, but its complexity is becoming even greater. And with increased complexity, bugs are more likely to be intermittent, making failures difficult to reproduce. Sometimes this non-determinism results in failures never getting fixed. Any unfixed bug is potentially a security breach or catastrophic customer outage waiting to happen. With such risks on the line, ensuring your software is of the highest quality is essential to running a successful operation.

    To cope with this complexity while still providing some assurance of delivered software quality, the DevOps industry has embraced a variety of automated testing regimes. A development team of a given size is able to run many more tests than it could before and must triage, and attempt to resolve, a correspondingly larger number of test failures. Diagnosing the cause of each test failure can still take a lot of time, particularly if the problem is intermittent or otherwise not easily reproducible. In fact, developers can spend on average as much as 50 percent of their programming time debugging, not coding. Think of all the innovation that could occur if that time were reallocated.

    Traditional QA

    When it comes to Quality Assurance (QA), developers and testers are all aware of the sequence of deliverables, beginning with development delivering an untested product to QA, which releases the tested and approved product to the end user. However, when a bug is found, QA and Development must communicate with one another to solve the issue quickly. The effectiveness of the delivery channel between QA and Development hinges on the quality of the information about the failure.

    Some common challenges raised by inefficient QA processes include:

    • Complex control flow – Difficult to make inferences about how a failure unfolded
    • Non-deterministic failures – Hard to reliably reproduce a failure to investigate the root cause
    • International R&D – Collaboration is made more difficult by geographic separation

    Conventional test systems inform that there is a bug but offer limited information about the cause. Workflows such as continuous integration (CI) often offer clues, such as informing which commit to the codebase caused the failure. However, there are several cases where CI cannot directly help identify problematic code changes. For example, the triggering code change may be entirely correct, yet cause a pre-existing bug to manifest. The developer cannot simply stare at the modification in the expectation that the source of the bug will eventually appear. Conversely, the failure may not easily reproduce for the developers even if they run the same test again. In short, CI is often very good at making the easier bugs very easy to fix, but typically is of little help with the more difficult bugs, particularly intermittent ones.

    The Next Evolution of QA

    To bridge the gap between identifying a failure in the QA process and resolution by development, DevOps teams have adopted a variety of technologies to complement their automated testing setups. New to this scene is technology capable of recording all or part of a program’s execution for subsequent replay and analysis, capturing test failures as they happen. The recording contains all the information a developer needs to understand the exact set of conditions that led to the test failure. It can be analyzed on different machines to the one on which the failure occurred, facilitating collaboration between colleagues who can work on separate machines to resolve the same issue—a particularly useful benefit for large software companies with geographically distributed teams. By gaining the ability to debug an exact replica of the failure, developers immediately reduce the time and effort required to diagnose and fix failures, therefore speeding the development cycle.

    Being able to generate recordings of failed tests, especially those intermittent issues which might not otherwise get fixed, coupled with the productivity gains of increased collaboration between development and QA allows companies to maintain a competitive advantage in a volatile marketplace.

    About the Author / Greg Law

    Greg is the co-founder and CEO of Undo. Greg has 20 years’ experience in the software industry and has held development and management roles at companies including the pioneering British computer firm Acorn, as well as fast-growing startups, NexWave and Solarflare. Greg left Solarflare in 2012 to lead Undo as CEO and has overseen the company as it transitioned from the shed in his back garden to a scalable award-winning business. Greg holds a PhD from City University, London, that was nominated for the 2001 British Computer Society Distinguished Dissertation Award. He lives in Cambridge, UK with his wife and two children.

  • The Tester: Saving Your Soul in a DevOps World

    The Tester: Saving Your Soul in a DevOps World

    Software testers have seen their careers go through some ups and downs in recent years. In the days of Waterfall, the tester’s job was clearly defined. Like other functions of software development and delivery, testers lived in a neat and tidy universe, testing features and design, finding bugs, sending back feedback to developers for correction and eventually, passing off code to the production people to work their magic. Testers had discrete roles with strong value propositions in the software organization.

    Then, Agile came along and new teams were created, lumping together developers, QA and Ops people for the sake of better collaboration and efficiencies. This began to create some confusion regarding who was responsible for what, when.

    DevOps brought order to the process, adding automation to every step, speeding cycles and reducing bottlenecks in a highly standardized, streamlined approach. In the continuous delivery pipeline, each step of the process creates its own contract for software quality—and that’s good.

    Development teams still value high quality, which customers demand. Yet in some DevOps circles, there’s been talk that testers aren’t needed much anymore. They bring bottlenecks to the process, forcing developers to work outside of the DevOps toolsets for code management and testing to respond to a defect ticket posted by the tester in an issue tracking tool.

    Eliminating that layer of process helps developers be as efficient as possible using continuous integration (CI) tools, proponents say. As well, some developers are more than comfortable handling testing, using test-driven development (TDD) methodologies.

    On the other hand, there’s faulty thinking here. Testers, whether deploying manual or automated testing methods, provide a valuable second set of technical eyes. Testers have a solid take on the user experience perspective, not just the fact that the code executes correctly.

    This human behavior and design insight is critical to the ultimate success of a software application. Finally, not all developers want to spend time testing nor have the skills to do so outside of unit testing.

    Moving forward into this new age of DevOps, testers play a vital role. The distribution of the tester into each phase of development (rather than at the end) is necessary to maintain both high standards of delivery and to keep communications fluid between different parties.

    Here’s how testers can contribute to DevOps teams:

    Testers need to be included in the continuous integration process

    Developers might be automating their unit test coverage, but they don’t replace all the test activities a tester can bring to the table. There are still other types of functional and non-functional test activities that must occur to validate the health of the product. Instead of transferring more testing responsibilities to the already overworked developer, testers can integrate their processes and systems with those of developers.

    Although there are version control tools (GitHub) and feature tracking systems (JIRA) to help developers, testers are often disconnected from these central tools. To connect with developer tools, testers can start creating and versioning their test cases within those development platforms. By doing so, testers can radiate feedback to the development team on issues to fix quickly through source code check-ins and in a way that won’t disrupt the normal flow of work.

    If testers can learn to use the DevOps tools developers love, much of the conflict goes away.

    Testers should increase their adoption of test automation, no matter their skill level

    Testers can learn newer test automation driven frameworks, especially those that help with transitioning manual test cases into automated scripts that can be reused, such as Cucumber or Gauge.

    For example, Gauge allows testers to write test specifications in Markdown, which provides a simple transition to automate your favorite programming language. These newer tools help testers transition to test automation despite not having experience writing tests this way—a common issue for testers working in DevOps.

    A growing number of test case management providers are starting to integrate their test design and execution around these automation frameworks to make the manual to automation transition smoother.

    Although developers might have automated unit test coverage, they struggle with developing functional and user acceptance automated tests. Testers can provide value by suggesting to the development team which are the best areas for test automation based on common issues and their unique knowledge of the application.

    They also can recommend areas for exploratory or manual test execution, depending on application complexity. This is especially helpful when teams starting down the path of DevOps do not have a regression test suite built that can be triggered through CI.

    Testers should focus on quality over finding defects

    Developers often complain that when testers find defects, it slows down their development processes. On a fast-moving Agile or DevOps team, filing bugs in a defect or issue tracking system is a total waste of time and creates unnecessary clutter.  Developers want instant feedback on code that’s broken and the related feature, rather than seeing another defect ticket they must open and close upon fixing.

    Therefore, testers should be giving feedback directly to the features that are being developed within a branch of code. They can do this through adopting tools that facilitate “ChatOps,” such as HipChat and Slack, which can integrate with version control systems. Testers can also provide direct feedback through a commenting system on the feature itself.

    With the advent of Agile and DevOps, which emphasize speed and frequent releases, testing is more important than ever in software development. By making some slight modifications to how they work and the tools they use, experienced testers can add considerable value to these teams by providing another layer of quality checks and a holistic view of an application’s performance and usability.

    About the Author / Ryan Yackel

    Ryan Yackel is Director of Product Marketing at QASymphony. He is responsible for all marketing activities around product releases, including development of strategic messaging. Ryan also helps to train the Sales teams on key value propositions for new products and features, and he provides customer feedback to the product team for roadmap initiatives. He can be found online at Twitter and LinkedIn.

  • 5 Interview Tips To Help Developers Land Their Dream Job

    5 Interview Tips To Help Developers Land Their Dream Job

    CodeFights recently launched Interview Practice Mode, a new mode on its website that enables developers to prepare for job interviews with technical questions asked by top tech companies. Interview Practice Mode marks the latest step in CodeFights’ mission to transform the way companies hire with skill-based recruiting. This feature will help developers from all backgrounds, locations and skill sets better understand their abilities, pursue lucrative job opportunities and land their dream jobs.

    For most engineering jobs, companies put candidates through rigorous technical interviews with difficult questions and coding tests. These interviews can be difficult to prepare for, especially for candidates who have never gone through a similar interview process before.

    Here are five interview tips to help developers land their dream job.

    1. Practice using real interview questions. As a great developer you often think, “This is what I do for a living and I am good at it,” so it’s tempting to walk into an interview without much practice. The reality is, interview questions you face at most companies are very far away from your day job, so make sure to do some research and practice using real questions that appear on interviews.
    2. Make sure to ask lots of questions during the interview. Some engineers think that asking questions is a sign of poor skills or lack of understanding. In reality, it’s the opposite. Most questions during technical interviews are intentionally vague and the goal of the interviewer is to see if you can ask the right questions before diving in. The worst thing you can do during a technical interview is to solve something you weren’t asked to solve. So ask questions until you are absolutely sure you have all the details.
    3. Use sites such as Glassdoor and your own network to find out the interview process at the company. At some companies, the interview process includes four or five people onsite and they all have to agree on who to hire. At others, the interview process still includes four or five people, but all are from different teams, so as long as one says, “Yes,” then you are in. Knowing what you are dealing with and the process is behind the scenes will drastically improve your chances.
    4. Apply to as many companies as you can. Some candidates make the mistake of only talking to a select few companies and trying to hit the bull’s-eye from a few shots. That works in theory, but in practice it’s very hard to understand from the outside what a company is like. Interviews are a way for you to interview the company and see if it’s a place you’d like to spend time working at. On top of that, doing more interviews is more practice and, when you get to the offer stage, having several offers helps you negotiate the best compensation package.
    5. Be mentally prepared for a negative outcome. At the end of the day, interviews are run by human beings and human beings tend to be quite subjective. So no matter how good you are and how much you prepare, most of your interviews are going to have a negative outcome. You have to be mentally prepared for that. Candidates who are used to excellence throughout their lives can take it very personally when a company decides not to hire them. You have to set your expectations right upfront so you don’t set yourself up to be disappointed.

    About the Author / Tigran Sloyan

    Tigran Sloyan is CEO of CodeFights. Tigran is the co-founder/CEO of CodeFights, a startup aiming to make improving your coding skills and finding your dream job fun and accessible to everyone in the world. Since its launch in September of 2014, CodeFights has attracted half a million users from over 200 countries becoming one of the largest developer communities in the world. Connect with him on LinkedIn and Twitter.

  • Threat Protection Appliances: As Valuable to Security as Your Toaster

    Threat Protection Appliances: As Valuable to Security as Your Toaster

    Nothing in the IT security community is as widely deployed and universally reviled as anti-virus. But, threat detection appliances, including intrusion prevention appliances, application firewalls and advanced threat protection appliances, should be almost as reviled. These appliances are nearly as useless as they are toxic. They do a horrible job finding problems and ultimately create more costs for security organizations than they save by crippling organizations with false alerts.

    Protection is Impractical

    In terms of security, detection appliances have never been effective, since the network makes a lousy location for any kind of security hub from the outset. Few network protection devices can even prevent attacks, much less respond to them, and most appliances are simply used for detection, even those with rudimentary prevention capabilities. In theory, an intrusion prevention device can drop a connection before letting the bad stuff through, but, in practice, that seldom happens.

    In most enterprises, security detection appliances are sitting off to the side, only capable of looking at a copy of network traffic as opposed to the actual network traffic itself. Organizations choose this less-than-ideal setup to avoid the inevitable network latency issues that otherwise occur when a single point of failure such as an appliance gets flooded or has a bug, for example.

    That’s not to say a network appliance can’t respond to an attack in progress in any way. If an appliance determines a particular network connection is malicious, and there is complete confidence in the appliance’s judgment, then an organization can have the device signal something that is in-line, such as a router or firewall. That device can then take action by killing the connection or blacklisting the offending IP address.

    The problem with that scenario is that often there isn’t enough context at the network layer. If a network appliance tries to make fast decisions, it’s going to produce an extraordinarily high number of false positives, making its judgment suspect.  Whenever there’s any doubt about an appliance’s judgment, it shouldn’t be trusted to make decisions whether to take action. Action in such circumstances could affect legitimate connections, which could have catastrophic consequences for the entire business.

    Appliances: What’s Really Happening  

    While old-school devices (e.g., traditional intrusion prevention devices) sacrificed accuracy for speed, today’s more sophisticated appliances do a better job of processing available data, which gives vastly superior results with far fewer false positives.

    The typical “next-gen” security detection appliance (such as an “advanced threat detection” appliance) tries to give as good an answer as possible about whether the connection represents an attack by simulating the end destination of the traffic to predict whether anything malicious will happen. This is done by running a copy of the traffic into a specialized virtual machine, and then monitoring the simulated outcome. If something malicious is found at the destination in the virtual machine, then there’s reasonably high confidence that the connection represents an attack. The goal of this approach is to limit false positives to the point where the organization can respond to every event. Some organization may even be willing to automate that response, by killing the connection if a suspected attack is detected in time, for example.

    While this class of a device tends to reduce noise, it doesn’t eliminate “false negatives,” which allow attacks to sail through without being noticed. In fact, some believe they make the false negatives problem of appliances even worse.

    If an attack works against an actual end user but not in the virtual environment, it could easily be overlooked by an appliance. Imagine a company buys an appliance and configures it to test network traffic by sending it to a virtual machine running Windows 10, but the traffic being tested only runs its proper course if running on Windows 9. In that case, if the network traffic’s destination is a user’s desktop that is running Windows 9, the attack can easily be successful, since the appliance won’t find the problem (because it’s running Windows 10).

    This class of problem was first discovered for network intrusion prevention by Ptacek and Newsham in 1998. While “next-gen” technologies are capable of more accurately modeling the systems they’re trying to protect, this problem will never go away when protecting from the network. Even when companies attempt to force all systems onto a single “gold” image, exceptions tend to quickly come out of the woodwork. For example, users within development and technical organizations often may find themselves in need of software that isn’t on the gold image, or they may need to run older software for testing purposes. Also, the gold image approach tends to only work for desktops.

    Making things worse, the “black hat” community can get their hands on the same appliances and reverse-engineer the virtualization technology and detection techniques it uses. Then, they figure out how to detect whether they’re running on such a device. Once they’ve done that, their real-life attacks will go unnoticed on the appliance, while still reaching the intended target.

    In the “advanced threat detection” appliance space, this problem is prevalent. A dirty secret of the appliance sector is that the majority of detections from these devices are discovered on machines that have already been infected, which are then beaconing out to external command-and-control infrastructure. If instead, these appliances had detected the actual inbound threat, the attack might have been prevented.

    Alert Fatigue: Poor Detection Quality  

    Drowning in alerts is perhaps the single biggest problem IT sSecurity organizations face. Even after all the raw data coming from around the network goes through a best-of-breed correlation and analysis engine, there is still an overflowing sea of information. These besieged engines generate so many alerts that organizations can’t possibly and cost effectively provide proper review for every priority alert they would like to investigate.  As it turns out, the vast majority of alerts are likely to be false positives anyway. Even the best talent can often and easily miss real incidents when pouring through so much superfluous data.

    Imagine the proverbial needle in the haystack, but multiply the number of haystacks so that the entire state of Kansas is covered in hay. Now you can begin imagine the scope of the problem. Sure, you might find an occasional needle or two—especially with some ingenuity. But, there’s virtually no chance that you could tractably look for them all even if you wanted to. That aside, your vigilance is likely to wane for at least a haystack or two, which is all it takes for one devastating needle to puncture your organization.

    Security appliances—particularly more traditional devices—represent the single biggest contributor to alert fatigue by far.  When you’re limiting your investigation to network traffic and trying to get work done as quickly as possible, you don’t have enough context to make good decisions. So, if you want to err on the side of caution, keep in mind that appliances will give you plenty of reason for caution, while uncovering few actual problems.

    If we are serious about eliminating the problem of alert fatigue, we must move beyond appliances and begin managing all of our detection at the machine-level. On a machine we can see what’s happening on the file system, what’s happening in memory, what’s happening in the OS and even what’s happening in the application (for common applications). That’s far more telemetric data to isolate signals and ignore noise (assuming we use all that data wisely).

    Many of the “next-gen” approaches live in a poor middle ground; they try to simulate the machine but generally can’t afford to create an accurate or effective simulation. If an organization is trying to protect a thousand servers, how many appliances would be needed to thoroughly simulate every inch of network and each bit of traffic that crosses? The answer is about a thousand appliances, which is far too cost-prohibitive. Most organizations prefer one appliance to protect hundreds or even thousands of machines, which is clearly insufficient.

    The Future: Will Be Worse

    The standards community is finally embracing the less is more philosophy as it prepares to launch TLS 1.3. This new protocol will ensure there aren’t straightforward back doors to subvert end-to-end encryption. Right now, most security appliances rely on those back doors as a means to provide detection (they need to be able to see the decrypted traffic). The new standard is going to require IT organizations have man-in-the-middle for every hop if they want their security appliances to work. That will add massive latency and expense, so most people won’t do it and appliances will become even less reliable as a result.

    Additionally, the rise of containerization and microservices will exacerbate the situation further, since putting container-to-container traffic on the same machine is well beyond the reach of any appliance.

    Security appliances may seem better than anti-virus, because they occasionally provide some value and don’t add as much attack surface. On the other hand, anti-virus software doesn’t drown organizations in an ocean of spurious reports. Besides, at least anti-virus now has credible alternatives, unlike an appliance. Security appliances are not worth the silicon they’re printed on and should be cursed in the same breath as anti-virus.

    About the Author / John Viega

    John Viega is CEO of Capsule8. Previously, he served as EVP of cloud security provider Silversky, where he led the technological advancement of the company’s cloud-based security suite. Following the successful acquisition of SilverSky by BAE Systems, John went on to serve as EVP of Product. Prior to SilverSky, John was SaaS CTO at McAfee. John is an award-winning author with a half dozen books to his name, including “Building Secure Software” and “Network Security with OpenSSL.”  He also co-designed the GCM encryption algorithm, which is nearly universally supported in the HTTPS and IPSec standards. Connect with him on LinkedIn and Twitter.


  • Maintaining Control in a Cloud-Dependent Environment

    Maintaining Control in a Cloud-Dependent Environment

    AWith digital transformation changing the face of businesses worldwide, we have increased our reliance on public cloud providers and their services. As we host and deliver our software applications and services to our customers, a failure like the one recently with Amazon’s S3 storage subsystem can paralyze operations for innumerable companies, large and small, around the country and possibly worldwide.

    Amazon presumably also had its own internal operations come to a grinding halt, as so much of its platform and delivery infrastructure is likely built using its own services. So much so that from 12:37 p.m. EST till 3:37 p.m. EST, Amazon could not update its SHD (service health dashboard) due to its dependency on S3, and had to resort to Twitter to let customers know what was going on!

    The root cause of the outage was a failure in its Simple Storage Service (S3) as is explained here: https://aws.amazon.com/message/41926/. What most people most likely missed, however, is the impact it had on other AWS services that were dependent on the availability of its S3 service.

    The multiple AWS services that were also disrupted during the outage included:

    • Amazon Athena – used to analyze data in S3 using SQL
    • Amazon Elastic MapReduce (EMR) – Elastic Map Reduce used for big data processing
    • Amazon Inspector – used to detect vulnerabilities of your applications deployed on AWS
    • Amazon Kinesis Firehose – used to deliver real-time streaming data to S3, Redshift or Elastic Search
    • Amazon Simple Email Service (Amazon SES) – used to provide email service for applications running on AWS
    • Amazon WorkMail – Amazon’s email and calendaring service for businesses
    • Amazon Auto Scaling – allows scaling your EC2 capacity up and down based on conditions
    • Amazon CloudFormation – allows creating and managing a collection of related AWS resources

    Multiple services that saw degradations to the point that their performance was severely impaired during the outage window included:

    • Amazon AppStream – streaming service from the cloud for Windows apps
    • Amazon CloudSearch – managed search service
    • Amazon Cognitio – identity service for mobile and web apps
    • Amazon EC2 Container Registry (ECR) – managed Docker container registry
    • Amazon Elastic Compute Cloud (EC2), Amazon Elastic Transcoder – media transcoding
    • Amazon Glacier – data archiving and backup
    • Amazon Lightsail – easy-to-manage VPS
    • Amazon Mobile Analytics – analyze and track mobile usage data
    • Amazon Pinpoint – push notifications
    • Amazon Redshift – data warehousing service
    • Amazon Simple Workflow (Amazon SWF) – workflow service for developers
    • Amazon WorkDocs – document collaboration
    • AWS Batch – batch computing jobs
    • AWS CodeBuild – managed service that compiles code, tests and produces software packages
    • AWS CodeCommit – managed source control service
    • AWS CodeDeploy – managed code deployment service
    • AWS Data Pipeline – data workflow service
    • AWS Electric Beanstalk – automatic deployment, load balancing and scaling
    • AWS Key Management Service – centralized control of encryption keys
    • AWS Lambda – serverless computing
    • AWS OpsWorks – automated AWS config management
    • Stacks – AWS resource collection as a single unit
    • AWS Storage Gateway – hybrid cloud storage

    What Lessons Can we Learn from This Outage?

    This outage was not something unique to only cloud service providers. Having a service or set of services getting disrupted can easily happen even when hosted in your own data centers. An outage like this ends up having expansive impact is when a principal provider of services to numerous enterprises experiences disruptions in major services that they offer.

    Another consideration into the enormous impact of outages is the way we are building software. We are no longer building everything by ourselves. We build essential components and use third-party capabilities when possible. With the breadth of services and products that Amazon offers, it is not outside the realm of possibility that there are entire companies whose software offerings are built and run entirely on AWS.

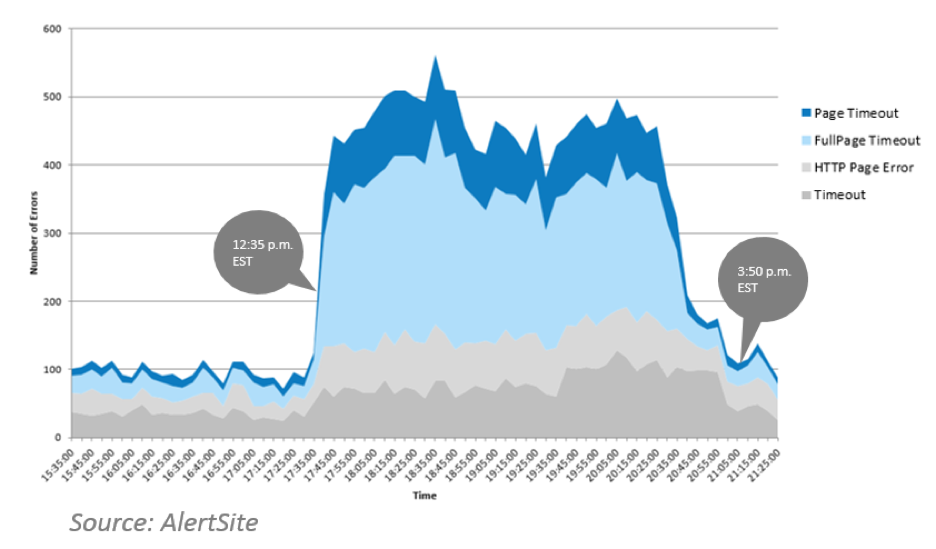
    Our customers have applications running on Amazon’s infrastructure, and we all felt the effects of the outage right away. The graph below shows the co-relation between when failures were noticed in applications being monitored on our system and when Amazon had the outage.

    This outage could have been caused by a hardware failure. It could have been caused by a software update that was not ready for prime time. Or as Amazon pointed out to us in this case, it was due to human error. We have all lived through experiences where human error has resulted in hardship to customers. What is imaginably happening at Amazon is the tightening of the processes around testing live services, what can be done, who can do it and what type of fail-safes are built into the tools used so that these large scale unintended outages can be avoided.

    What can you do help yourself, even with this dire dependency on your cloud provider?

    1. Test frequently and early in dev/test, staging and production to ensure that all the critical pathways through your applications and your services (your own and the ones from third parties) are working correctly.
    2. Do performance acceptance before pushing your software to production because it is a lot more expensive to catch problems in production than it is in dev/test or staging.
    3. Monitor services from your cloud providers so that you know right away when there is an issue.
    4. Understand the policies and procedures that your cloud provider follows regarding how they deal with changes to their production systems. The maturity of their processes and controls and their recovery mechanisms should let you rest easy that an outage of this magnitude will result in a speedy recovery.

    About the Author / Anand Sundaram

    With nearly 25 years of experience building and growing several technology businesses, Anand Sundaram is Vice President of Products, AlertSite at SmartBear Software. He is the co-founder of three startups including RSW Software that was valued at more than $240 million with more than 160 employees. He has extensive background in software quality, security and post deployment monitoring having built two load testing products and invented the first post deployment deep transaction monitoring product.

  • Digital Transformation and the DevOps Chaos Theory

    Digital Transformation and the DevOps Chaos Theory

    With the threat from agile startups disrupting markets across the globe, large enterprises are increasingly focused on moving to a more agile approach to business. Most organizations already have begun the digital transformation (DX) journey, but the fact that this transformation is still in its infancy and not completely finalized for many demonstrates the fluid and evolving nature of DX. Multiple IT technologies, processes, applications, systems and protocols need to be adopted and updated on a regular basis for businesses to keep abreast of changes. This does, of course, result in significant disruption for all involved.

    With this in mind, DevOps principles are beginning to have much greater impact, with the true value of this methodology being identified through a new approach. As development velocity increases, and the scale of the enterprise also increases, businesses will develop a much greater reliance on DevOps principles to rein in the chaos associated with continuous development that’s being spurred on by the pace of digital service development and increased automation.

    The key to managing and minimizing the resulting chaos is close collaboration and communication between the IT team members responsible for service development and delivery. Without this, the need for a continuous delivery pipeline operating at speed and scale, will quickly get out of control.

    The DevOps Chaos Theory

    To understand the challenges in this new business environment, it is useful to look at this at a more granular level, through the framework of the DevOps Chaos Theory.

    The pace of innovation is measured as the Velocity (V), or the number of new software releases deployed in a production environment in a defined time period. The Scale (S) factor is measured as the overall number of IT staff involved in service delivery and management in production environments, such as DevOps, SecOps, QA, system architects, DBAs, NetOps and help desk. Interaction between these team members brings the potential for miscommunication, which will increase the overall chaos. The maximum number of interactions between these IT members is S * (S – 1)/ 2, and for high-scale organizations it approaches S2/2. Based on these considerations, a logical hypothesis would identify the system-level Chaos (C) in production environments as C = K * V * S2.  K is the normalization factor that may change based on the overall adoption of DX in a specific industry and the effectiveness of collaboration and communication between the IT team members.

    Minimizing Disruption

    Collaboration between departments within the business is important to ensure the chaos is controlled. There is no doubt that automation tools play an important role in continuous delivery and allowing organizations to operate at the speed and scale they need to. However, enterprises must identify the level of constraint placed upon the IT operations team. This is crucial to establish what changes need to be made and what service performance management technology must be introduced, to prevent operations from becoming a bottleneck to the continuous service delivery cycle inherent to DX.

    Key performance indicators (KPIs) are critical when it comes to service delivery, particularly when you consider that this combines the entire stack into a single system. This stack is comprised of physical, virtual, wired and wireless layers of compute, storage and networking infrastructure and application that run at the top of the stack to deliver services consumed by end users. Using a variety of network, infrastructure and application performance management tools will obscure the system-level view across all the layers of the service stack and their interdependencies. Monitoring system-level KPIs requires access to reliable data sources, such as network traffic. An effective instrumentation of these data sources will play a key role in proactively identifying the root cause of service issues and thus reining in chaos.

    Enterprises must be able to effectively analyze the monitored data to gain insight into all the infrastructure subsystems and applications interdependencies to establish a comprehensive view of their services, accessing both real-time and historic information. In addition, effective management at a human level also should form an important part of a company’s DX strategy, if chaos is to be mitigated and crisis averted.

    More and more companies are realizing that DX offers a wealth of opportunity, but it’s crucial to understand that harnessing these opportunities requires strategy and forethought. Monitoring and managing systems will be vital, as will DevOps principles, as more processes are automated and data plays an increasingly central role to any company.

    About the Author / Michael Segal

    Michael Segal is vice president of strategy at NetScout. His product management experience spans across 10 years at Cisco Systems, where he managed all aspects of product line life cycles for several successful product lines. Michael’s technical areas of expertise include SaaS/cloud, virtualization, mobile IP, security, IP networking, Wi-Fi/wireless, VoIP and remote access. Michael holds patents in areas of networking and wireless mobility. Connect with him on LinkedIn and Twitter.

  • How Developers Can Spend More Time Coding, Less Time Fixing

    How Developers Can Spend More Time Coding, Less Time Fixing

    I don’t think anyone became a developer because they loved to spend their time debugging. As frustrating as it may be, making sure your build works is critical—and this burden is now falling on developers. If your organization wants to deliver highly rated apps faster, building quality into the development cycle is imperative. Even though agile development has become a popular approach, it’s execution has a ways to go.

    A recent trends report in mobile and web development shows 25 percent of time is spent addressing a bug fix backlog. This can slow time-to-market and limit the amount of new features your company can roll out—not ideal when your top priority is to draw in new users and boost engagement to stay competitive. The good news is, the time spent debugging throughout the development cycle can be minimized. How? By shifting QA into the development process, you can spend more time coding and less time fixing.

    Mastering Agility in Practice

    The question for devs today isn’t whether they test, but when and how to do it best. We’ve all heard the vague, top-line answers before: “Adopt Agile development,” or, “Shift left.” The problem is, these terms and strategies can be challenging to execute in practice, especially without proper tools to make it happen.

    When we talk about “shifting left,” there’s still an important balance to be found as to which stage is right for dev teams to test—it can’t be too early, when there is nothing meaningful to test, and it can’t be too late, when the test batch pile is too big. Once your coding and testing processes are harmonized, you can effectively maximize your time and resources and get the job done faster and better.

    For development teams, if testing is done in bulk at the end, identifying the specific point in the build that needs to be corrected is like finding a needle in a haystack. When we shift quality left, defects are found earlier among a much smaller set of changes, and are therefore easier to fix. That’s why continuous integration (CI) calls for building, integrating and testing the system you’re developing upon delivery of even the smallest change.

    By testing continuously, uncertainty is reduced and feedback loops are made smaller, ensuring you’re building in the correct direction. The “shift left” trend is ultimately going to condense the dev cycle by getting quality back into the ingredient list. The earlier we deal with quality issues, the less focus is taken from our primary goal: building valuable, innovative technology.

    Find Tools that Mesh with Your Workflow

    Whether you use Selenium, Appium or Android Studio, new products need to integrate seamlessly into existing developer environments. Having to switch between building tools and testing tools is a big waste of time, and it’s unrealistic to expect a high adoption rate if the product is disrupting, rather than enhancing, your workflow. If you’re expected to shift testing into your development cycle, look for testing tools that seamlessly support the continuous integration of testing.

    Once your testing and building processes is aligned, the testing feedback and analysis becomes a new bottleneck. To minimize inefficiencies and feedback gaps, you need to carefully select tools that will improve visibility into build health, and help avoid batching up issues.

    Empower Developers to Satisfy Users

    At the end of the day, smaller batch sizes are only half the battle. No matter the batch size, quality only can be built in if it includes full test coverage, and if all the defects can be fixed in a way that actually meets user standards of quality.

    With tons of potential end user environments, injecting reality into the development process is crucial if you want to meet the high expectations of today’s consumers. With different phones, operating systems, levels of connectivity and apps running in the background, you never know what your apps will be put through once released. Leveraging stable test environments capable of recreating all potential user conditions throughout the developments cycle will maximize efficiency in development and accelerate the speed of innovation at your organization.

    Through a better delivery pipeline, mobile app and web developers are simply more effective. Once your test process is automated, aligned and maximized, writing better code can become your main focus. By taking a strategic, practical approach to shifting quality left—and giving developers the opportunity to focus on what matters most—you’ll see happier developers, and in turn, more successful businesses.

    About the Author / Paul Bruce

    Paul Bruce is Developer Evangelist at Perfecto, focusing on the value of quality and velocity throughout the software life cycle. He previously worked as an advocate for API development and testing practices and a full stack developer before that. He now writes, speaks, listens and teaches about software delivery patterns in modern enterprises and key industries around the world. Connect with him on LinkedIn and Twitter.

  • Boosting Time-to-Market by Improving Software Development

    Boosting Time-to-Market by Improving Software Development

    Today’s business environments require “agility” in terms of being able to quickly understand and adapt to information, trends and new developments. For example, a company might employ a business intelligence suite that provides them with real-time information on product sales, which allows them to dynamically adjust content or strategy.

    Set a Baseline

    You can’t measure improvement in a business process without first establishing a baseline. The first step in reducing the time-to-market for software development is to look closely at the current development process. Review the steps involved in turning an idea into a live product or product feature and identify any bottlenecks, inefficiencies and constraints. Once this review is complete, set realistic goals that reflect the current situation and the improvements you want to see within a certain time period.

    Eliminate and Optimize

    During the review and baseline phase, you might come across activities that do not add value and do not speed up the process. Perhaps there are some unnecessary meetings during the mid-phase of the development process that typically do not uncover any problems and hold no real value. Or, there’s a documentation step that is a drain on human capital and takes away valuable time from testing and innovation.

    Identifying problems and bottlenecks is vital, but the efforts will be wasted if there aren’t open lines of communication. Poor communication causes software release delays, so establish efficient processes, set up the right team structure and adopt tools and technologies that allow transparent and fast communication between cross-functional teams. When it comes to teams, you want to find the right balance of staff. Generally, a winning team includes the right analysts, marketing managers and DevOps resources who can work together towards a common goal.

    Streamlining and Developing Incrementally

    As the team moves into development, there are steps you can take to increase efficiency. Independent tasks should be performed in tandem; for example, test scenarios built while various features are defined. Do not wait until development is completed before creating test environments; encourage the team to split parallel tasks that best match with their individual talents.

    When it comes to enhancements for business apps, there’s an inclination to go for the “home run” by greatly changing the application and including many new features with every update. For reliability and speed to reaching the market, you instead want an incremental approach, by which you develop controllable enhancements and bug fixes that provide immediate value to the users. Prioritize the “wish list” of feature sets so you can better manage and plan the updates that will go into future releases. Get buy-in from other departments and then build and create an enhancements schedule.

    Test Often and Embrace Automation

    In addition to having testers test the application, you should actively engage with clients and select users early in the development process so they can provide input on the overall functionality and user interface as well as help discover bugs. Your time-to-market can be greatly impacted if bugs aren’t caught early on, and you might even need to pull a newly launched application if the glitches impact users adversely.

    Improving this process requires defined and repeatable testing procedures and, to reduce time-to-market, these procedures must be automated at least partially.

    Consider these other benefits of software testing that will improve your DevOps:

    • Discovering bugs and software errors can improve the system’s capacity
    • Testing can improve the security of your applications
    • Improve customer engagement and satisfaction through a high QoE score
    • Reduce the total cost of ownership
    • Better meet industry standards and compliance regulations

    Other automated processes should be introduced into the development cycle, including environment provisioning, data or API mocking; builds management; and standards enforcement. For instance, automated deployment solutions give DevOps a repeatable process so engineers have more time to focus on crafting new features. Another example is release automation tools that manage workflow as software moves between development, production and testing. These tools not only speed up the process, they also eliminate potential for human errors.

    The modern business relies heavily on applications to communicate, complete sales and operate more efficiently. Companies strive to bring these apps to the market quickly so they don’t miss opportunities and can adjust to market conditions. To accomplish these goals, companies must adopt the right software development processes and tools to improve their time-to-market speed and capture a competitive advantage.

    About the Author / Ajay Kaul

    Ajay Kaul is managing partner at AgreeYa, bringing more than 27 years of experience in sales, consulting and managing small to large IT projects worldwide. Kaul has led AgreeYa through 16+ years of success, leading the company in highly competitive and complex markets and driving significant profitable growth with global workforce of more than 1,500. Prior to founding AgreeYa, he was responsible for managing engagements for Deloitte serving private and public sector clients across United States. Connect with him on LinkedIn.
  • When IT Disaster Strikes, Part 1: Resolving Incidents

    When IT Disaster Strikes, Part 1: Resolving Incidents

    As a developer or operations team member, there is nothing quite like the dread you feel when you hear the familiar ringtone of your on-call page at 3 a.m. Being on call means that you may be contacted at any time to investigate and fix issues that arise for the system, but that doesn’t mean you can’t get ready beforehand. There are steps your team can take to prepare for incidents and streamline the process of resolving them, leading to fewer 3 a.m. wake-up calls and better-running software and services.

    Below is an overview of a proven approach your organization can take before, during and after an IT incident to reduce headaches and increase hours of sleep.

    Before: Define the Who, What, When of Incidents

    The first step in any incident prevention and orchestration process is determining how your organization defines an incident. Generally, this is done by defining the varying degrees of severity, with lower-numbered severities more urgent. Operational issues can be classified at one of these severity levels. As a general rule of thumb, if you are unsure which level an incident is, treat it as more severe to ensure it is dealt with timely.

    In addition to aligning your team on defining an incident to communicate the sense of urgency involved, there are several main roles that should be designated ahead of potential IT issues. Certain roles have only one person per incident, while other roles can have multiple people assigned to it. It’s all about coming together as a team, working the problem and getting a solution quickly. Generally speaking, developer, IT Ops and DevOps teams must designate the following roles:

    • A point person or “Incident Commander”—someone who will drive the process forward, but not be involved in the actual remediation;
    • Someone to document a timeline of an incident as it progresses for future analysis and learning and to act as a backup for the point person;
    • One or more subject matter experts who are deeply familiar with the specified component or service and who will take the remediation steps; and
    • One person to manage customer support and communication during and after an incident.

    During: Keep Calm and Communicate

    If you are alerted of a major incident, don’t panic. The first step is to join a previously agreed-upon method of communication to be used during incidents to ensure that communication can run smoothly throughout the resolution process. The incident commander (IC) and the IC deputy should announce the issue in appropriate communication channels and lead the process, and it is best to defer to the subject matter experts assigned to the incident to ensure non-essential communication is kept to a minimum.

    The steps you take to prepare for an incident have a significant impact on how quickly you are able to move when disaster strikes. If incident prep has been done correctly, each member of the incident response team will have a very specific role and set of responsibilities carved out, ranging from someone to provide regular updates in the chat client to someone to modify your company’s status page to keep customers informed. By having these roles defined beforehand, you don’t have to spend valuable time during an incident figuring them out instead of fixing the problem. In a future article, I will break down each member of the incident response team’s specific role and the steps they should follow during an incident.

    After: Conduct a Post-Mortem Without Finger-Pointing

    For every major incident, you should follow up with a post-mortem—a blame-free, detailed description of exactly what went wrong to cause the incident, along with a list of steps to take to prevent a similar incident from occurring again in the future. The incident response process itself should also be included as part of the review.

    As the IT incidents we deal with daily become increasingly tied to larger organizational success and business objectives, streamlining the resolution process is a must. According to a report from IDC, the average hourly cost of an infrastructure failure is $100,000 per hour, and the average cost of a critical application failure per hour is $500,000 to $1 million. In future articles, I will break down the varying roles on an incident response team, specific steps to follow during an incident, a tried-and-true template for conducting a successful post-mortem and more, to ensure effective incident prevention and resolution.

    About the Author / Eric Sigler

    Eric Sigler is the Head of DevOps at PagerDuty, helping protect its customers from the pains of downtime. Before his current role, Eric led infrastructure teams at Minted, Expensify, and the Missouri University of Science and Technology. Connect with him on Twitter.