Netlify this week announced it has acquired OneGraph, a provider of a platform that simplifies the integration and management of application programming interfaces (APIs) based on the GraphQL query language.
At the same time, the company is committing $1 million to sponsor open source projects and setting aside $10 million for a Netlify Jamstack Innovation Fund that will help drive the development of emerging technologies. Those technologies will be consumed via the platform the company created based on Javascript, APIs and a markup language (referred to as Jamstack) to accelerate web application and website development. Rather than becoming investors in those companies, Netlify intends to make those funds available to advance the development of technologies that benefit the overall community.
Fresh from raising an additional $105 million in funding, Netlify CEO Matt Biilmann said Netlify is committed to an ecosystem through which developers will be able to consume a wider range of services via both REST and GraphQL-based APIs. OneGraph will provide the core foundation for adding support for GraphQL to the Netlify platform, he noted.
Overall, Netlify is trying to reduce the friction that developers encounter building web applications and the sites they run on, added Biilmann. That’s becoming especially critical as developers increasingly build microservices-based applications that invoke APIs to consume backend services that are made available via the Netlify platform, he added.
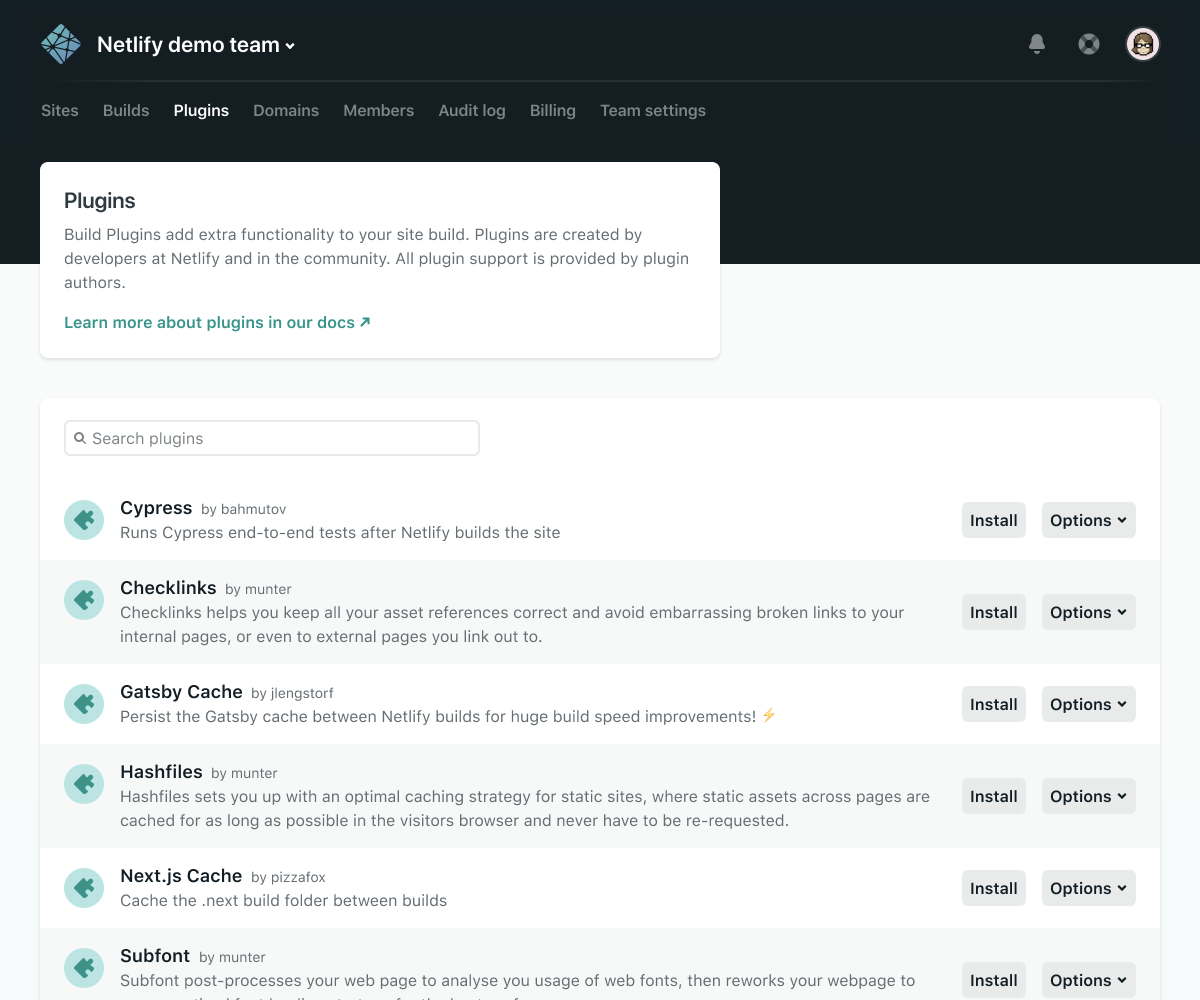
Earlier this year, the company made available Netlify Build Plugins that provide DevOps teams with a set of continuous integration/continuous delivery (CI/CD) workflows for building websites and web applications. Designed to be launched from within a Netlify platform, those plugin makes it possible to build a web application or website that can be launched directly from within a Git repository.
The overall Jamstack philosophy enables DevOps teams to separate the development of frontends and backends of websites and applications. That approach is agnostic as far as any specific JavaScript framework is concerned, but it does define a way to automate the build process for a web application or website.
A recent survey of more than 3,000 Jamstack developers published by Netlify finds one-third of survey respondents have worked on sites serving millions of users over the last year. Nearly two-thirds of survey respondents (62%) work outside the tech industry, including in advertising and marketing (21%), media and publishing (14%), education (14%), financial services (13%) and business support and logistics (13%). Well over a third (38%) work for a technology company. About a quarter (26%) have more than 10 years of experience. Top Jamstack benefits cited by all types of developers are performance, uptime, speed of development, security, compliance and avoiding vendor lock-in, the survey found.
Jamstack is, of course, not the only framework for building web applications and the sites they run on. DevOps teams are increasingly being tasked with building a much wider range of external applications to drive digital transformation initiatives that are typically built using some type of JavaScript framework. The next big DevOps challenge, of course, is that as the number of applications being built continues to increase, so does the number of applications that need to be maintained and continuously updated.
Here at MediaOps we have two big announcements today. The first is that we have earned a place in the Inc. 5000 annual ranking of the fastest-growing companies in America. We didn’t just make the list—we came in at 1,622, well in the top half of companies on the list.
The other announcement is that we have relaunched our MediaOps website, at mediaops.com. With updated positioning and messaging, our new site better reflects who we are today and what both our sponsors and visitors want to know about us.
Both of these announcements are linked in a way that may not be obvious to the casual observer. As the founder of this company, I am extremely proud of what we have accomplished that has resulted in our earning this honor. When I look at our new website and its impressive information about MediaOps, I am even more proud. But I am most proud when I look at the team page and look at the great group of people who make up our team.
To give you some background for insight, we started this company about seven years ago with devopsy.kinsta.cloud. It was going to be a blog with myself as the primary author. But even then we had plans that maybe there would be more. We chose MediaOps as the corporate name in case we ever did more than devopsy.kinsta.cloud. My partner Martin Logan came up with the name, actually. But when we went to register the domain, we could not get the Mediaops.com name. Instead, we registered MediaOps.io, figuring it wouldn’t make much of a difference because no one would know our corporate name anyway.
MediaOps and the MediaOps website shared a common theme. We really didn’t care if anyone knew the name or the website, really; we didn’t have the bandwidth or resources to promote that in addition to devopsy.kinsta.cloud. Parker Yates, our Chief Revenue Officer, and I developed many of the sponsored services we offered, which were centered around devopsy.kinsta.cloud and then its associated properties.
With the launch of Security Boulevard and Container Journal, we again put whatever resources we had toward establishing those brands in their own right. We never really had a focus on the MediaOps brand and MediaOps website.
Equally so, we really never thought about MediaOps being a fast-growing company that would become one of the fastest-growing companies in the U.S. Who had time for that? We were too busy delivering the next webinar, the next article, attending the next conference. Our mission was to help grow and establish the communities we lived in.
Today, MediaOps is a different company than it was seven years ago. We are more than 20 people strong, operate over a dozen different websites and all the other great metrics that go with this kind of success. We began to realize that our hard work was resonating and our sponsors looked to us as a reliable partner in delivering thought leadership, branding and lead generation activities. Our audience has come to expect quality content across all available channels.
We developed beyond the written word. Our virtual events, video, audio and even comics are different distribution channels to the same audience we serve: DevOps, Digital Transformation, Cyber and Cloud-Native. Taking our audience focus and our means of distribution, we call this the omniverse.
Our new website at Mediaops.com (we thought it was time to buy and own the domain) reflects all of this and more. Despite the current COVID-19 crisis, MediaOps is well-positioned to build on its success. In the weeks and months ahead, we will continue to make more announcements and bring new activities to the MediaOps omniverse.
Finally, I want to thank you, our audience, most of all. None of this success would be possible without you. Thanks for the support, thanks for being who you are. Our mission really hasn’t changed: We will continue to bring you the best content we can find via every channel we can use to contact you. That is the Mediaops Omniverse.
Netlify, at a Jamstack Conf Virtual event, announced the general availability of open source Netlify Build Plugins that provide IT teams with a set of continuous integration/continuous delivery (CI/CD) workflows for building websites and web applications using JavaScript, application programming interfaces (APIs) and static HTML files without employing web servers, otherwise known as a Jamstack.
Designed to be launched from within a Netlify platform to enable IT teams to build a website and launch it from a Git repository to a content delivery network (CDN), the Netlify Build Plugins are intended to make it easier to employ DevOps processes using, for example, a plugin to run an end-to-end Cypress test.
Netlify CEO Mathias Biilmann said DevOps teams also can make use of a Netlify API to create their own plugins. Ultimately, the goal is to foster the development of a wide range of open source Netlify plugins that would be built and vetted by the Jamstack community, he said.
Other Netlify Build Plugins provide a means to enable Ghost, an open source headless content management system based on Node.js that can be deployed on any framework; launch a Sentry tool to automatically discover, triage and prioritize bugs; or enable a Gatsby tool to create incremental builds on Netlify.
A survey of more than 3,000 Jamstack developers published today by Netlify finds one-third have worked on sites serving millions of users over the last year. Nearly two-thirds of survey respondents (62%) work outside the tech industry, including advertising and marketing (21%), media and publishing (14%), education (14%), financial services (13%) and business support and logistics (13%). Well over a third (38%) work for a technology company. About a quarter (26%) have more than 10 years of experience.
Top Jamstack benefits cited by all types of developers are performance, uptime, speed of development, security, compliance and avoiding vendor lock-in, the survey finds.
Biilmann said Jamstack as a philosophy enables IT teams to separate the development of front- and backend websites and applications in a way that allows organizations to embrace best DevOps processes. That approach is agnostic as far as any specific JavaScript framework is concerned, but it does define a way to automate the build process for a web application or website.
In the wake of the economic downturn brought on by the COVID-19 pandemic, more organizations are investing time and resources in modernizing their websites and applications. With more employees and end users depending on those websites to drive digital business processes, the quality of the application experience has become a much bigger concern. At the same time, end users have now come to expect those application experiences to be updated regularly, which in many cases will necessitate the adoption of best DevOps processes.
In fact, it’s arguable that organizations that don’t embrace best DevOps practices to build and deliver web applications at scale will soon discover they have bitten off more than they can chew.
Do you own or manage a WordPress site? Is it complex, with a lot of traffic? I’m going to show you the ideal architecture to host a highly available and scalable WordPress site on AWS.
This blog is intended to show a distributed architecture in AWS for WordPress CMS websites. You will be able to identify the different layers of services needed to run a high-traffic WordPress site.
The Concepts of a Highly Scalable and Available Environment
Let’s start by looking at what a highly scalable and available environment means—and what it includes:
High Availability: On IT it means that a system can operate without any service disruption or interruption for a long time, as well as a system that has redundant components. (In our case, the redundant Infrastructure will be our high availability — thanks, AWS, for making this easier!)
Distributed Services — Loose Coupling: The art of distributing different components of a system in the same network. We will be doing this to leverage the load of any resource and have dedicated hosts for a service.
Scalability: A system’s ability to monitor the user demand and automatically increase or decrease resources. This scalability will be provided by the following AWS Resources: AWS ELB, AWS EC2, AWS S3, AWS RDS.
One essential part of innovation is always to stay up to date and implement the best technology available.
If you are already on AWS, we have also compiled a very concise checklist, which is available here.
Architecture Diagram
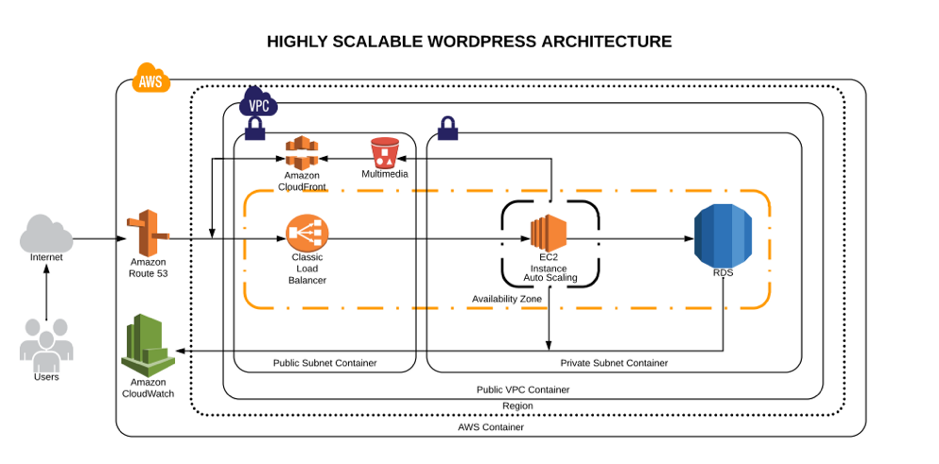
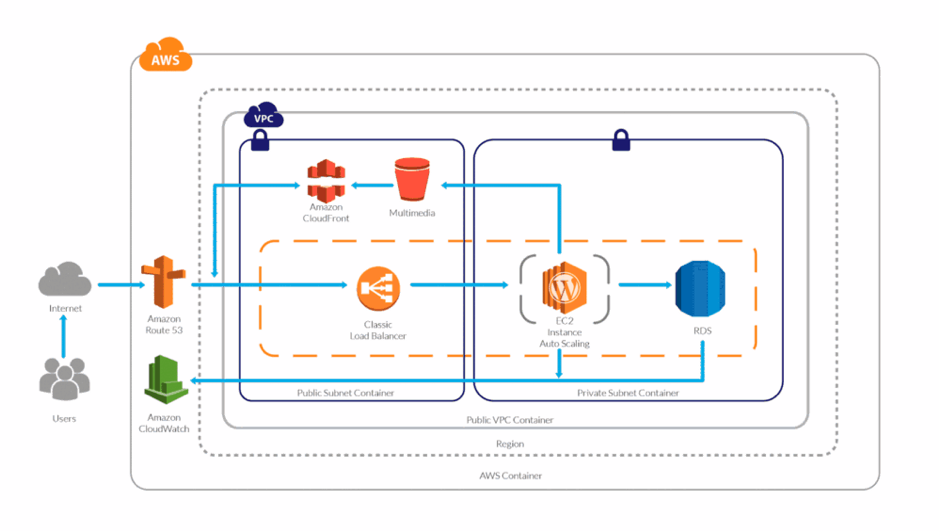
High scalable and available WordPress environment on AWS Cloud
AWS Services Explained
Route53: This service will help us to manage all the upcoming requests (traffic) for our domain. AWS Route53 will also be the DNS manager, so here we will point our domain registrar to be the manager. Once it has been migrated here, we can add the A records, Cnames or TXT records and many other more.
AWS VPC: The AWS VPC is a service that allows us to have a private network in which we will allocate our cloud computing resources. That means nobody has access to it—only ourselves.
AWS Private Subnet: The private subnet is the subnet in which we are going to deploy the resources we don’t want outsiders to have access to. In this case, our database will be only accessible by the application.
AWS Public Subnet: The public subnet is the subnet in which we are going to deploy the resources we want to make public — such as the server for our website.
AWS S3: Amazon Simple Storage Service will be our content storage solution. Here, our WordPress installation(s) will have the content available whenever it scales up or off.
AWS CloudFront: CloudFront combined with S3 will help us to spread the content faster to the end users. This way our WordPress multimedia content will be spread all over the AWS CDN network (edge locations), which will be used from our application to reduce the latency. Users will be served by the closest edge location available. So faster content = faster site.
AWS Load Balancer: Here is the tricky part. The AWS ELB will allow us to distribute the traffic load between our instances available or in use depending on how the auto scaling is set.
AWS EC2: Instances—also called “VMs”—the service on AWS for acquiring computing power. AWS EC2 will allow us to host our WordPress site and files we need.
AWS Autoscaling: This will be the solution for our highly available and scalable WordPress site. AWS Autoscaling will take care of always having a minimum quantity of instances available for the public, and in case something goes wrong, it will replace the instance with a healthy one. This way our site will always be available. Autoscaling will also benefit our WordPress by creating instances based on the traffic demand and will help us to save costs while the traffic is low.
AWS RDS and Multi A-Z: RDS will be the service in which we will host our WordPress database. The service is completely free and fully managed by AWS, which means we won’t need to worry about the database management anymore. Also useful is that RDS instances can have replication between them, which adds even more scalability. Also, enabling the Multi-Availability Zone (Multi A-Z) feature will provide us high availability. Keep an eye on this, however, since the price will is double for the RDS.
AWS Cloudwatch: AWS Cloudwatch will be our trusted supervisor. Cloudwatch will be in charge of monitoring all the resources in our AWS account. It will keep an eye on the metrics that are predefined or as default by AWS resources, such as CPU usage, memory usage, disk IO and networking.
Did I forget about EFS? Nope. In my experience, EFS has not been a huge help when it comes to sharing the WordPress files only. However, you can try using EFS; that way, the content will be replicated much faster and easier.
If you want to learn more about the technologies and the approach that should be taken to create this kind of environments, take a look at this post.
Millions of Page Views Served
Here’s how this environment will be able to serve millions of page views/visitors:
Traffic Flow
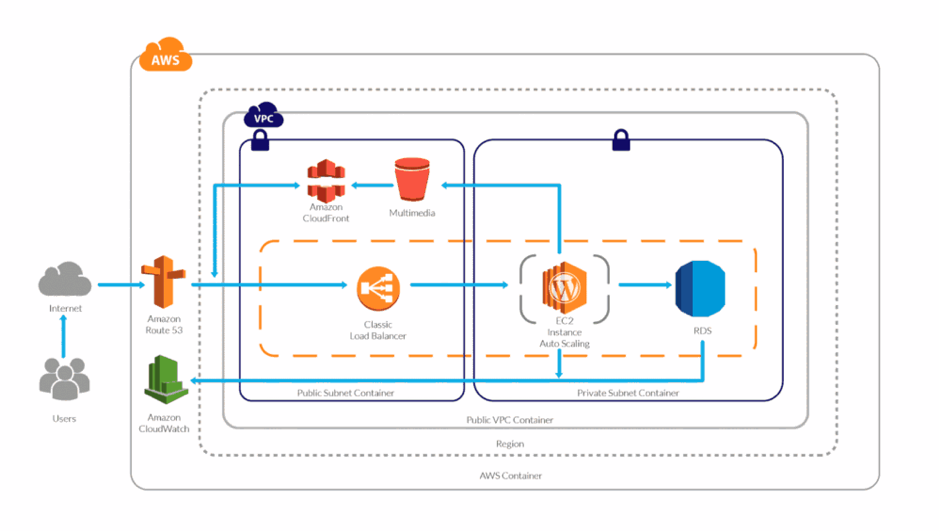
Once visitors hit your domain on their browser their request is passed to the internet, then routed to your DNS manager. The DNS manager (Route53) will solve the request to the specified server and the web server then will serve the application.
WordPress High Performance
What will happen when your traffic increases? Here is an example:
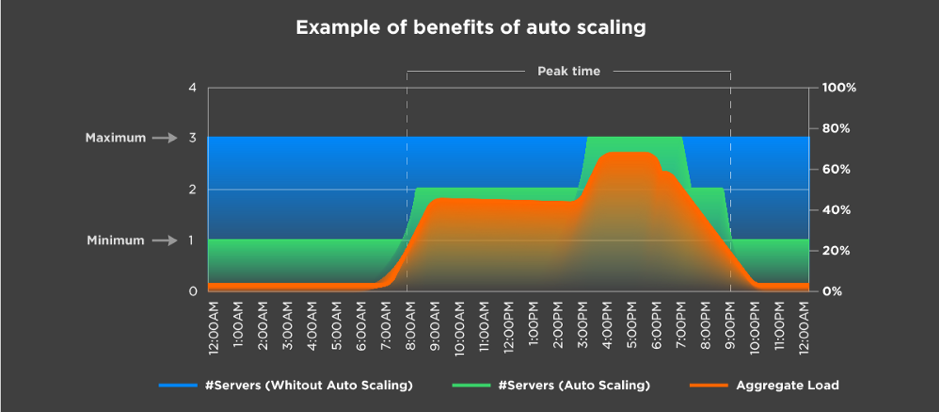
Autoscaling example
Let’s say you have set the autoscaling to one as the minimum number of instances and a maximum number of three instances. Based on different metrics, your environment will be able to scale out depending on the load it receives.
In the image above, we can see that depending on the aggregate load, the environment continues to satisfy the demand by creating more instances as it grows. The same happens the other way.
This means a lot when you are calculating the TCO of your cloud environment. It also means you won’t run out of memory or other resources; instead, you will have a more available system.
And you might be wondering, What is going to happen to my AWS Resources? Here’s a visual:
WordPress High Performance Scaling
The answer is simple: More demand or traffic, more servers to meet it.
Server Caching/WordPress Caching
Server-side caching or WordPress-side caching happens with a plugin or is embedded in AH host. Whenever someone requests the homepage, for example, the request is passed to the database to retrieve the homepage information. Caching creates a temporary file (I say temporary, because you can specify the expiration) so when your request comes, it will check for the files it generates instead of processing the request to the database.
This way, we can serve faster pages/content to our users and reduce the database consumption.
If you yet don’t have a caching system implemented, make sure you do from now on, as it speeds up your website dramatically.
Content Delivery Network
In a few words, the content delivery network (CDN) the network of servers or services in which your content will be hosted and this network will be used to transfer the content to all the visitors. Using a CDN will help you to spread your content around the world faster than having it hosted on your server.
CPU/Memory Performance
Based on the CPU and memory metrics, our stack will be able to scale up or scale in as desired. This way our response time will always be the same between all the servers and no instance will experience overload due to CPU or memory (these are the annoying 500’s errors).
Instance Types
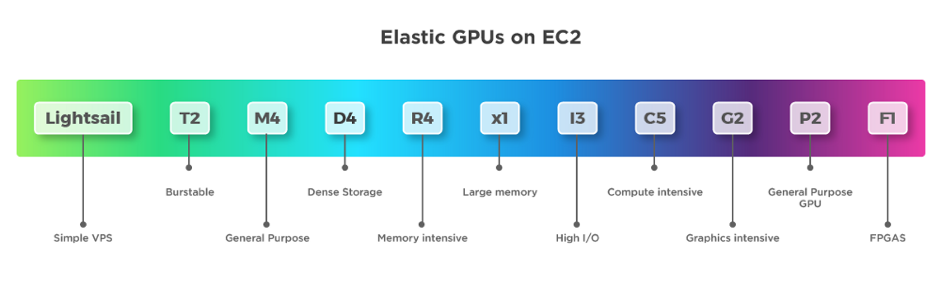
On AWS we have different instance types that we can use depending on the workload we have. It’s important to choose the right instance type.
Definitely using the correct instance type for our WordPress will help, as well as selecting the number of resources for it to run.
And there you have it —you now know how your site can support millions of page views with a distributed system.
Backup and Disaster Recovery
It is essential to have a backup strategy as well as a disaster recovery solution in case something happens to our WordPress installation or our environment. Luckily, AWS offers a lot of redundancy between all its services.
There are different ways in which we can protect our application and users’ data:
WordPress plugins to back up the site (S3).
Disaster recovery for infrastructure (physical).
Backup for user data (DB — RDS).
Backup for application code.
Amazon Web Services already provides different backup solutions for all its services, so we can create backups for the RDS with one click and perform the configurations for backups with EC2.
Pro Tips
To increase the performance use a database, query and page caching plugin.
Increase the RDS performance with a dedicated Aurora RDS.
Use S3 and CloudFront to deliver the content faster.
Enable alarms on AWS Cloudwatch.
Enable the billing alarm to avoid unwanted charges for usage.
Use Reserved Instances—if you are going to stay in AWS for a long time reserve, it can save you up to 30 percent.
Use a version control system to track your changes and deploy to the instances.
Conclusion
This article outlines what I consider an ideal architecture for a high-performance/high-traffic WordPress site. As you can see, Amazon provides us with all the tools and technologies to do it, but sometimes it can be challenging.
As always, if you think I missed anything, please post it in the comments!
The volume of transactions running through websites and mobile apps make customer-facing applications crucial to online businesses. If these applications perform well for their users, they generate revenue for the business. If they don’t, they affect the credibility of the business, which in turn affects the overall revenue. It is therefore imperative that businesses using monitoring to understand how well their revenue-critical applications are behaving for their end users.
From an IT team’s point of view, understanding the user experience of their applications is becoming more challenging as technology evolves. Newer and more complex applications are being written using an assortment of languages. These applications are being deployed on a wide variety of infrastructure components. To add to that, today’s users access these modern applications on a variety of devices such as the web, smartphones, tablets and smart watches.
Fortunately, there are a few means available through which businesses can determine the user experience of their web applications. Let’s take a look at three common approaches below.
Real User Monitoring (RUM)
Real user monitoring is a passive monitoring approach that involves collecting metrics at the browser level to accurately determine the application performance as perceived by the end users. Monitoring at the browser level is achieved by injecting JavaScript snippets into the header and footer of the HTML code of the web application. This code will ascertain the full page-load experience—including downloading the assets from the content delivery network (CDN), rendering the page and executing the JavaScript from the browser’s perspective. Additional instrumentation can be used to collect more metrics by injecting additional JavaScript code.
The data gathered through RUM provides answers to questions about user experience such as:
How long did it take to load the full page?
What is the response time from a network perspective (redirection time, DNS resolution time, connection time)?
What is the time interval between sending the request and receiving the first byte of response?
What is the time taken by the browser to receive the response and render the page?
Are there any problems on the page? If yes, what caused the problem?
How is the performance when the application is accessed from different countries?
What is the response time across different browsers? Do new application updates affect the performance in a specific version of the browser?
How does the application perform on different platforms such as desktop, web and mobile?
The biggest advantage of monitoring real user data is that it relies on actual traffic to take measurements. There is no need to script the important use cases, which can save a lot of time and resources.
Real user monitoring captures everything as a user goes through the application, so performance data will be available irrespective of what pages the user sees. This is particularly useful for complex apps in which the functionality or content is dynamic.
Server-Side Monitoring
Although user experience is best tracked at the browser level, application performance monitoring at the server side also provides insight into end-user performance. Server-side monitoring is mostly used in conjunction with real user monitoring. This is because problems originating on the server side can only be efficiently detected using server-side monitoring.
Monitoring performance on the server side involves agent-based instrumentation technology for acquiring and transmitting data. This monitoring approach is used to watch user transactions in real time and troubleshoot issues such as slowness or application bugs.
Developers have to install agents on the application server to help capture and visualize transactions end to end, with performance statistics across all components, from the URL down to the SQL level. This visual breakdown reveals the flow of all the user transactions being executed in each layer of the application infrastructure.
Server-side monitoring helps track response time and throughput taken by each application component, with the option to trace transactions end to end via code analysis. This helps the IT operations/DevOps teams identify slow web transactions and then isolate performance issues down to the level of the specific application code that caused them. The underlying database is also monitored most of the time to determine slow database calls, database usage and overall database performance. With server-side monitoring, users will be able to identify the SQL queries executed during a transaction and thus identify the worst-performing queries.
Synthetic Transaction Monitoring
Synthetic transaction monitoring is an active monitoring technique based on the concept of simulating the actions of an end user on a web application. This method involves the use of external agents executing prerecorded scripts that mimic end-user behavior at regular time intervals. The monitoring agents are usually very light and do not create any additional load on network traffic.
Most application performance monitoring solutions provide recorder tools to capture the actions or paths a typical end user might take in an application, such as log in, view product, search and check out. These recordings are saved as scripts, which are then executed by the agents from different geographical locations.
Technically, there are two different approaches to generating requests. Some solutions replay recorded HTTP traffic patterns, while others drive real browser instances. The second approach is more useful for modern applications that make a lot of JavaScript, CSS and Ajax calls.
Since synthetic transaction monitoring involves sending requests across the network, it can measure the response time of application servers and network infrastructure. This type of monitoring does not require actual web traffic, so you can use this approach to test your web applications prior to launch—or anytime you like. Many companies use synthetic monitoring before entering production in the form of automated integration tests with Selenium.
Synthetic monitoring does have its limitations, though. Since it is based on predefined transactions, it does not monitor the perception of real end users. Transactions have to be “read-only” because they would otherwise set off real purchase processes. This limits the usage to a certain subset of your business-critical transactions.
The best approach is to use synthetic transaction monitoring as a reference measurement that will help identify performance degradation, detect network problems and notify in case of errors.
Every business is different and has its own requirements that can help to choose which type of monitoring to implement. An ideal strategy would be to use active and passive monitoring techniques side by side so that no stone is left unturned in the pursuit to monitor end-user experience.
The main reason your company should load test its websites and mobile applications is to learn how the site performs so you can improve the user experience and make smart web infrastructure decisions. Sounds obvious, doesn’t it? Above all else, load testing is a learning experience that provides a wealth of insight into how your website performs from both a user experience and technical perspective.
How can it be done? Running a load test involves creating a small or large number of virtual users via programming script, running a simulation in which those virtual users access your site, and gathering information about how well the website performs under the traffic load.
How Your Website Operates and Why it Matters
If you are curious to learn more about how your website operates, contact a specialized load test company that offers load tests with up to 50 users for free over a 30-day period. Such a smaller test will provide insight into how well your company’s site performs for a typical user during light traffic situations. Free application monitoring tools often can be downloaded if your business does not already have one.
Longer load times hurt conversion rates: According to Amazon, every 100ms of page load time latency reduces sales by 1 percent. So your business could be losing out on 10 percent of sales because your pages take a second longer to load. Testers can learn all sorts of interesting things about how a site operates with varying virtual traffic loads.
Primarily, the load test tells you how long it takes a page to load on your site for users at different traffic levels. You can find out how quick load times are during normal, peak, spike and overwhelming use rates.
The load time data helps identify not only problems in your website code that could be slowing down individual pages, but also problems with the infrastructure itself. Load testing lets your business know exactly how much load times increase when the site gets busy relative to normal use. The tests also can determine how much traffic a site’s infrastructure can handle before load times get outrageously high—and when the site will crash.
Proximity Performance
A load test provider can offer testing from server locations all over the globe. A guest in Chicago visiting a site that is hosted in New York City may have fast load times, but Los Angeles-based visitors may have to wait an extra second for pages to load. This data can help your company make an educated decision when purchasing a content delivery network (CDN) service that mirrors content, so site guests farther away from the original host server have a better experience with your site. Look for a load test provider that can offer synthetic load traffic of up to 500 Gbps bandwidth and a million concurrent virtual users. Loads should be generated to your breaking point, and fast!
Get the Ideal Amount of Power and Learn How to Scale
Once your business is able to see how your site performs under various traffic loads, that information can help determine where the infrastructure needs upgrades at various traffic levels. This helps with capacity planning—the ability to scale different infrastructure elements to meet demand without wasting money on power that is not going to be used.
Running load tests on your company’s site will teach you invaluable information about how your site works so your customers can have a better experience with your platform. Improved website performance equals improved business.
About the Author / Sven Hammar, CEO, Apica
Sven Hammar is co-founder and CEO of Apica, a provider of powerful, best-in-class technology for testing, monitoring, and optimizing the performance of cloud and mobile applications. Mr. Hammar he has decade-long experience and expertise in web performance and web optimization, e-commerce, cloud services, IT entrepreneurship and the Internet. He is also a serial entrepreneur who has founded several successful IT companies over the years.





 Sridhar Iyengar is vice president, product management, at
 Sven Hammar is co-founder and CEO of