Tag: telemetry

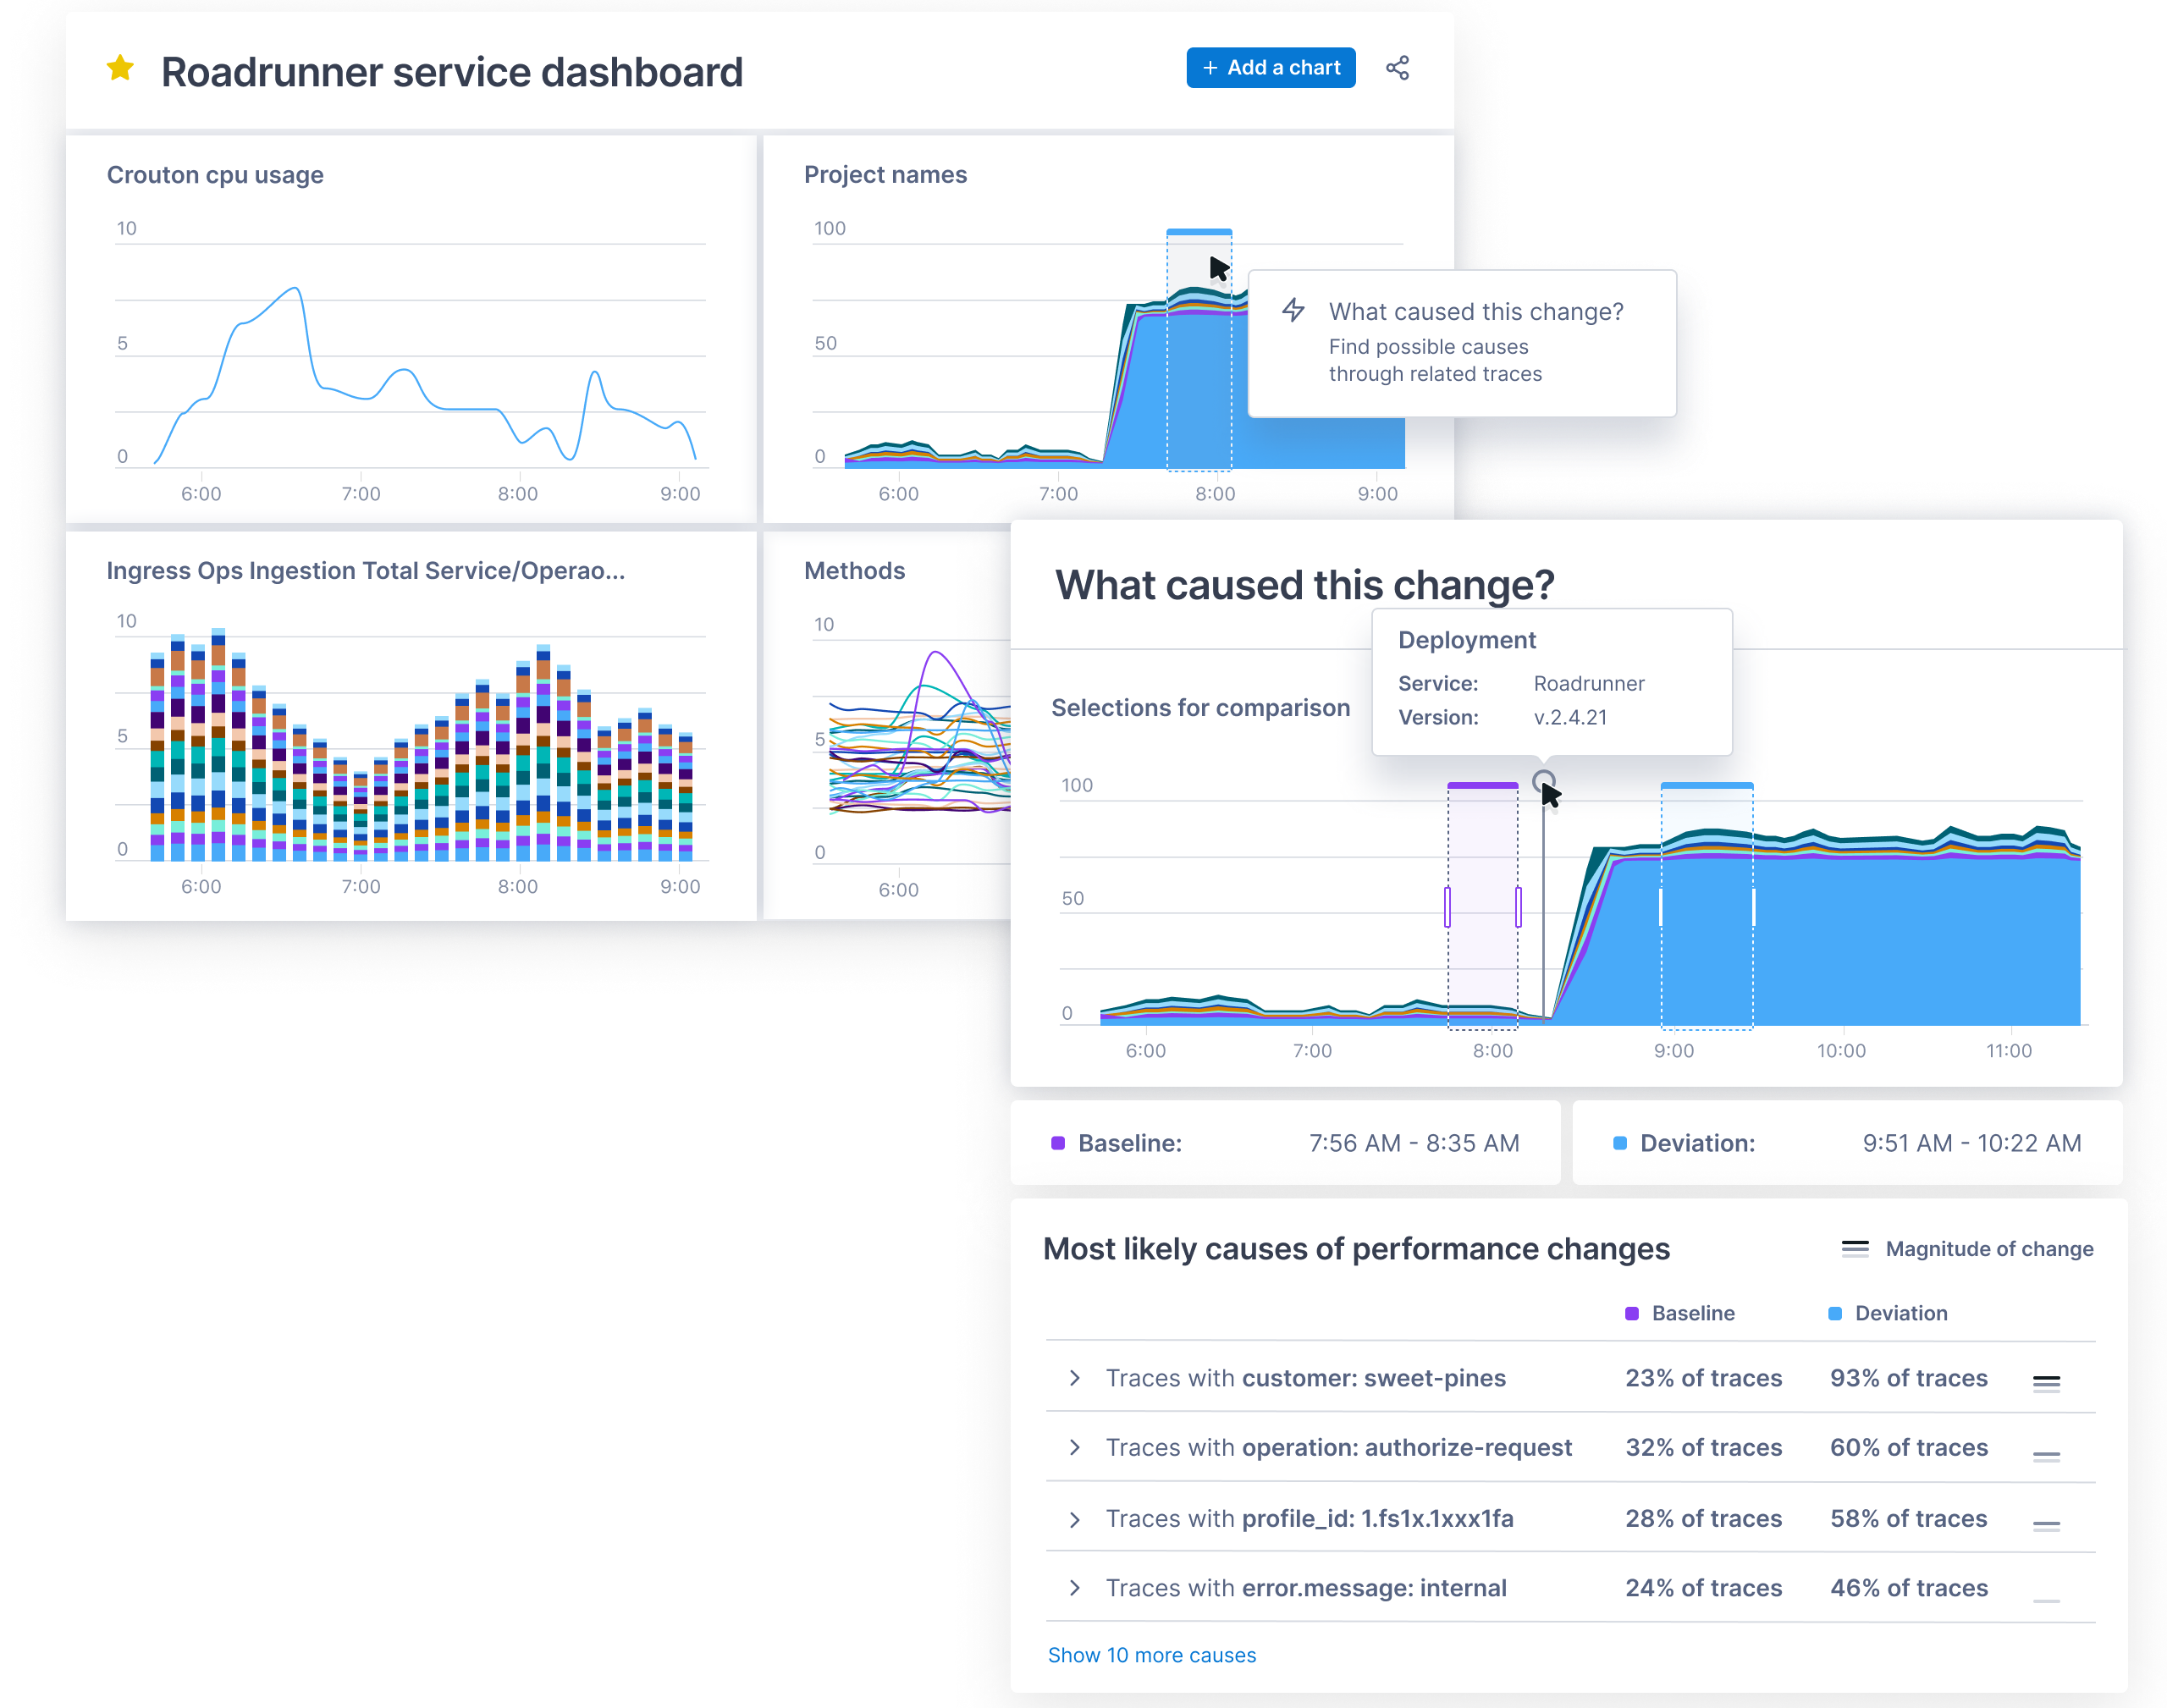
  • New Relic: Observability Tops 2022 DevOps Agenda

    New Relic: Observability Tops 2022 DevOps Agenda

    If 2021 was the year when IT organizations became aware of the need for observability, then the coming year should see observability aspirations realized.

    A report published by observability platform provider New Relic postulates that there are no less than 11 factors converging in a way that will make observability an absolute requirement for organizations.

    At the top of that list is a simple fact: Observability is now required to drive digital business transformation initiatives that typically span multiple processes. In fact, a global survey of 1,300 IT leaders, software engineers and developers conducted by New Relic found 90% of respondents view observability as critical to the business.

    Second, as a result, observability is now starting to be applied in both pre- and post-production environments as organizations take a more holistic approach to managing the software development life cycle, the report noted.

    Third, the report suggested that IT teams are looking to make better-informed decisions based more on facts than intuition. To do this, teams are using data collected from across the enterprise application environment. In fact, the fourth factor advancing observability in the enterprise is that the cost of instrumenting application environments is dropping, which the report notes is making it easier to collect relevant data.

    The fifth and sixth factors reflect a desire to rationalize the number of monitoring tools that IT teams currently use and the fact that usage-based pricing has simultaneously made it less expensive to leverage observability platforms as needed.

    The seventh factor is the overall shift toward open source software that enables observability platform providers to collectively leverage innovations faster. The eighth factor, closely linked to the open source trend, is the rise of more complex open source platforms such as Kubernetes that require much higher visibility to successfully deploy and manage.

    The ninth trend identified in the report is increased adoption of DevOps best practices that encourage IT teams to view observability as a core tenet of any IT management strategy. The tenth factor cited by the report is the need to drive increased collaboration among IT professionals.

    Finally, the eleventh factor driving further adoption of observability is the need for increased application reliability as more organizations appreciate their dependence on software to deliver essential services.

    Buddy Brewer, a group vice president and general manager for New Relic, said now that observability platforms are becoming more accessible, the next big challenge will be teaching IT professionals what questions to ask as they troubleshoot both legacy monolithic applications and a wide range of emerging microservices-based applications. The results of those queries then need to be easily shared with both developers and internal IT operations teams that must work together to maximize application performance and availability, he added. The latter requirement is why New Relic decided to acquire CodeStream to make telemetry data available with integrated development environments (IDEs), noted Brewer.

    There is, of course, no shortage of observability platforms for IT teams to adopt. In fact, the biggest challenge now is getting every application stakeholder to agree to standardize on an observability platform—no small feat, as many DevOps teams may already have a preference for one approach over another.

  • Observability Matters. But Are You Observing the Right Things? 

    Observability Matters. But Are You Observing the Right Things? 

    It’s like clockwork. Every few months, a new buzzword descends on the tech industry, and soon it’s on everyone’s lips. Take your pick from the graveyard of buzzwords past: “Big data,” “internet of everything,” “hacktivism,” “gamification.” It’s not that these terms are meaningless—just that they go from relatively obscure to ubiquitous seemingly overnight. We can add a new one to the list in the digital monitoring space: “Observability.”

    Unlike some trendy buzzwords, observability captures something that’s actually quite important about how we monitor digital systems and how current approaches differ from those of the past. So, it’s a good and useful concept. But where I take issue is with the way many analysts, technologists and vendors seem to use it. Whether or not they mean to, they often paint a far too narrow a picture of what observability is or ought to be, and that linguistic oversight can have real-world consequences. If enterprises invest in observability without understanding what, exactly, they’re observing—and what they’re not—they risk leaving themselves vulnerable to some serious blind spots. 

    What is Observability and Why Does it Matter?

    Technically, observability is an approach with the goal of understanding how a system is doing. The distinction lies in what the system is and how it is being observed. The monitoring tools of yesterday typically focused on one or more domains to identify typical and known problems. Usually, that entailed collecting metrics directly from those domains and measuring them against predefined thresholds. For example, storage levels shouldn’t exceed a certain threshold; if they do, send me an alert so I can investigate what’s happening. 

    On the other hand, observability takes a more holistic approach, examining multiple outputs of the system to infer system health. For example, suppose you were trying to gauge a car’s condition. In that case, traditional monitoring might track engine temperature or idle speed RPMs, while observability would examine things like power output, engine leaks, transmission noise, emissions and fuel efficiency to infer the car’s overall health. 

    This output or outcome-focused approach to managing performance maps well to today’s complex and distributed digital systems. Even if you wanted to, you couldn’t pull real-time metrics from every relevant component of a system when those components consist of thousands of microservices running in any number of physical servers across multiple clouds. However, the bigger problem with more antiquated monitoring models is that they only capture the specific metrics they’re designed to track. If you’re encountering a problem you’ve never seen before, your monitoring dashboard might look perfectly healthy while actual system performance is terrible. 

    Observability and APM 

    So then, observability should give you everything you need to track the health of a modern digital business, right? Well, not so fast. Because for today, people seem to use “system observability” interchangeably with “application performance monitoring,” or APM. And they are not at all the same. 

    Yes, you want an observability-based approach to tracking your application environment, and modern APM tools provide a great way to do it. But knowing the health of your application environment is not the same as knowing the health of your overall digital systems as experienced by users. And at the end of the day, if you’re not gauging performance from your users’ perspective—whether that’s customers, employees or other devices relying on your systems—then what’s the point? It’s unfortunately not uncommon to forget that the most important key performance indicator (KPI) of any digital system is the quality of its intended output or outcome. In the case of any application, the most important KPI is the user experience.

    The outputs that APM tools track do contribute to the user experience—and you want to be monitoring them. But so do many, many other things. There’s the user access itself (browsers, virtual or physical user devices loading the application). There are local, regional and global networks connecting those users to your application environment. And then, of course, there are the dozens, sometimes hundreds of third-party digital services running between and among users and applications. Problems in any link of that digital chain can seriously impact the user experience—even if your application environment itself looks healthy. 

    Observing End-to-End, from User to App and Everything in Between 

    To get the full picture of the health and performance of your digital assets, you should be tracking outputs from across the end-to-end digital service chain. That includes telemetry (logs, infra metrics, traces) from your application hosting environment. It should include actively and passively observing at the point of consumption—that is, outputs from customer browsers and worker devices. It must include active and passive monitoring of network connectivity. And it should include continuous active monitoring of all the disparate services—APIs, content delivery networks (CDNs), DNS services, cloud-based security services and every other cloud and web service that contributes to what the user is experiencing. (And by the way, you should look for independent, objective telemetry whenever possible rather than taking what your various service providers report at face value.) 

    When you approach observability from this outcome-based, holistic perspective, you can capture a real and truthful picture of the performance of your full digital business, not just pieces of it. Just as important, when you do identify a problem, you’re in a much better position to do something about it. Because now you have outputs to measure from all the many systems and services that contribute to the user’s application experience instead of just a subset of them, which means it’s much easier to zero in on which piece of the puzzle isn’t behaving the way it should. 

    A Smarter Approach to Observability

    So, should you take all the hype about observability seriously? Yes. As tech buzzwords go, you could do a lot worse. This one actually means something important. But make sure you’re keeping the big picture in mind as you do. 

    Observability that ignores the outcome begins and ends with the application environment and is nowhere near sufficient. We need to expand our sense of observability, begin with the user experience and encompass every link in the chain of the end-to-end digital business. When we do, we create a much more holistic, useful and actionable picture of the health of our digital systems. And we can make sure we’re continually monitoring digital performance in the way that matters most: As experienced by users. 

  • Consider Telemetry When Rearchitecting Applications

    Consider Telemetry When Rearchitecting Applications

    Australia and New Zealand have seen a big move to the public cloud, and “… when I talk to customers, I see huge interest in rearchitecting applications rather than doing a lift-and-shift right into public cloud,” said Scott van Kalken, F5 ANZ solution architect for DevOps and modern applications.

    That migration to the public cloud has led to massive interest in telemetry. When you go from a monolithic application to a distributed app, there may be 100 or even 1,000 APIs involved. Without telemetry, you don’t know what’s going on with those APIs. But the telemetry needs to be consistent.

    F5’s 2021 State of Application Strategy report found 75% of respondents considered telemetry, especially about application security and delivery, important for meeting business outcomes, and 95% of respondents said they are missing insights from their existing monitoring and analytics solutions.

    Van Kalken recounted a conversation with a practitioner as an example. This practitioner gets yelled at when problems arise with partner APIs used by the application he manages. So, even though these APIs are not technically his responsibility, he needs visibility into their status. Only by combining internal telemetry with telemetry from these partner APIs can he make sense of what’s happening within the application ecosystem.

    And it’s not just a question of whether an API is available or not. Problems can arise when it is responding slowly. “‘Is that normal? Is that normal for this time of day?’ I’ve got to have some sort of telemetry data available to me to make decisions,” van Kalken said.

    Enabling Security Automation with Telemetry

    An aspect that’s particularly interesting to him is the ability to automate or otherwise take action based on security telemetry data.

    A simple example is a security event that reveals some kind of systems abuse. Automation can add a firewall rule to block the associated traffic.

    As organizations increasingly adopt event-driven architectures, events and responses occur at the application, network, infrastructure and other levels. “The minute that you automate those event-driven architectures with security, it opens up a world of possibilities.”

    It’s not just about automating security. Imagine an API gateway that serves a variety of APIs to customers. Telemetry might reveal that two of the APIs are starting to slow down; in which case, “I might kick off a workflow that just deploys more of them so that we can handle the load. But if you don’t have that telemetry, you can’t do that,” he said.

    In practice, this involves telemetry, analytics and automation.

    “When we show [customers] how you can make use of the analytics in a really easy way, their eyes light up,” van Kalken said.

    Multi-Cloud Migration

    A further consideration is that rearchitecting applications isn’t just about splitting monoliths into smaller pieces and redeploying them as microservices. There’s also a desire to run them across multiple public clouds to reduce risk, and also to deploy applications at the edge where they are closer to their users.

    The 2021 State of Application Strategy reported that just over three-quarters of respondents are already using or have plans to use the edge to capture benefits related to application deployment, performance and data availability.

    “This is really important, because as an application developer, I want to deploy my application once and I want to say, ‘I want this distributed to all of these places around the globe’,” van Kalken said.

    But if the application is deployed in, say, five locations, then from a telemetry perspective, it is five applications, not one.

    “I’ve got five sets of telemetry, because I’ve effectively got five different applications deployed out there. It’s the same app, but it’s in five locations, and the consumers are different in every location; the way that they interact is different and the telemetry that I’m getting is going to be different,” he said. “So, I need to actually suck up all of that telemetry, and make it meaningful in some way,” he explained.

    Telemetry Enables Clearer Vision

    “A distributed cloud architecture is right for these modern applications. We recently bought a company called Volterra, and this is one of the areas that they play in — distributed applications, and specifically, abstracting multi-cloud and multi-cluster Kubernetes application deployments,” he said. This area of focus will be critical in the future, van Kalken said.

    He predicts that as organizations move to 5G, applications will become increasingly distributed. If that does happen, it will be extremely important to receive telemetry from all components of the application so it can be analyzed and used to support intelligent decisions, as part of the distributed application deployment.

  • ServiceNow Acquires Lightstep to Gain Observability Platform

    ServiceNow Acquires Lightstep to Gain Observability Platform

    ServiceNow today announced it has acquired Lightstep as part of an effort to add an observability platform to its IT operations portfolio. Terms of the deal, expected to close this quarter, were not disclosed.

    The Change Intelligence observability platform from Lightstep is based on a time-series database that is capable of processing a trillion events each day. It was built by the same team that created Monarch, the globally distributed in-memory time series database system that Google employs to monitor its applications and systems. Lightstep team members also co-created both the OpenTracing and OpenTelemetry open source projects for collecting traces, metrics and logs.

    Pablo Stern, senior vice president and general manager for IT workflow products at ServiceNow, said ServiceNow will employ Lightstep to enable IT organizations to observe both monolithic and microservices-based applications as IT operations and DevOps teams continue to collaborate more closely with one another. The goal is to provide a single pane of glass through which IT teams can observe their entire IT environment via the Now platform that ServiceNow makes available via a software-as-service (SaaS) delivery model.

    That approach will enable DevOps teams to programmatically manage IT environments alongside IT administrators employing graphical tools, noted Stern.

    Lightstep CEO Ben Sigelman added that, in time, the number of users of that observability will only increase as more application stakeholders start to track software development projects that are at the heart of various digital business transformation initiatives.

    ServiceNow

    Thanks mainly to the rise of microservices that are now being deployed across highly distributed computing environments, it’s become more difficult to discover the root cause of an IT issue. Microservices-based applications have lots of dependencies that, while serving to make the overall application more resilient, conspire to make it difficult to determine which specific microservices might be adversely impacting the performance of an application.

    The time-series database that lies underneath the Change Intelligence observability platform makes it feasible to go beyond logs and metrics to process distributed traces that provide more insight into application behavior. Ultimately, the goal is to enable organizations to innovate faster with a higher degree of confidence in the IT environment, said Sigelman.

    As far as the march to observability in the enterprise is concerned, it’s still early days. While observability may be a core tenet of any DevOps practice, most IT organizations rely on myriad tools that surface data the teams then attempt to correlate. Whenever there is a major issue, those IT teams typically convene in a “war room” to compare reports generated by the various IT monitoring tools employed. Observability platforms that collect and process distributed traces used to instrument an application using a consistent set of specifications, frameworks and libraries. The OpenTracing and OpenTelemetry tools are significant because they provide an open source approach to instrumenting applications that reduces the total cost of observability. In comparison, many legacy application performance management (APM) platforms employ proprietary agents to instrument applications.

    Naturally, each IT organizations will be moving down the path toward an observability platform that provides greater application context. At this point, however, it’s not clear to what degree observability platforms will need to be installed before making the transition to microservices versus being a capability that only gets appreciated once the trouble with microservices finally becomes apparent.

  • OpenTelemetry Project Gains Log Agent Software from observIQ

    OpenTelemetry Project Gains Log Agent Software from observIQ

    Stanza, an open source log agent developed by observIQ, a provider of an observability platform, has become part of the OpenTelemetry Project for collecting telemetry data.

    Mike Kelly, CTO and co-founder, observIQ, said Stanza will make it possible to collect log data alongside other telemetry data using a common application programming interface (API) and software development kit (SDK).

    OpenTelemetry is currently a sandbox-level project being developed under the auspices of the Cloud Native Computing Foundation (CNCF); it provides a set of open source libraries, agents and other components for collecting the telemetry data consumed by observability and IT monitoring tools.

    Contributors to the OpenTelemetry Project include Amazon Web Services (AWS), Elastic, Google, Honeycomb, Lightstep, New Relic and Splunk. After Kubernetes, Kelly said the OpenTelemetry Project is now the most popular open source initiative being advanced by the CNCF.

    The OpenTelemetry Project is still a long way from delivering agent software that will be widely employed on an IT production environment. However, the potential implications of the project are already being widely noticed. Rather than having to deploy, manage and update agent software for individual IT management tools, it will soon be possible to deploy a single set of agent software to generate data that can be consumed by multiple platforms.

    That shift will enable providers of these platforms to focus more of their effort on enhancing their analytics capabilities rather than developing proprietary agent software that typically doesn’t provide much differentiated value, Kelly said.

    Stanza is part of an IT observability platform developed by observIQ when it was previously known as Blue Medora. After selling its platform for integrating monitoring tools to VMware, Blue Medora changed its name to observIQ. Now, it is making an effort to advance adoption of an observability platform that it makes available as a software-as-a-service (SaaS) application.

    Will DevOps teams roll out elements of OpenTelemetry themselves, or wait for the observability and monitoring tool and platform providers to support open source agents that would automatically be deployed? That remains to be seen. Regardless, the total cost of observability should decline, as open source agent software replaces the proprietary agent software strewn across enterprise IT environments today. The expectation for vendors is that more applications will be consuming analytics data surfaced by the observability and monitoring platforms they provide.

    Of course, it will be a while before that dream is fully realized. In the meantime, IT organizations will need to carefully evaluate the total cost of observability against the business value of the application deployed. Cost is one of the reasons application performance management (APM) tools are not widely employed today. Of course, as IT environments become more complex, thanks to the rise of microservices and serverless computing frameworks, it’s also become increasingly apparent that observability will soon be a capability IT teams can’t afford to do without.

  • Dynatrace Adds to Observability Capabilities

    Dynatrace Adds to Observability Capabilities

    Dynatrace today announced it has extended its observability capabilities via the launch of its PurePath 4 platform that adds support for the open source OpenTelemetry framework and W3C Trace Context specification for distributed tracing.

    In addition, the company is adding support for service meshes and serverless computing frameworks running on Amazon Web Services (AWS), Microsoft Azure and Google Cloud Platform.

    Alois Reitbauer, chief technology strategist for Dynatrace, said by adding support for open source tools to gather metrics, the total cost of achieving observability is being driven lower at a time when a transition to microservices-based applications is making the need to observe applications more crucial than ever.

    Dynatrace is adding support for OpenTelemetry and W3C Trace Context to a platform that has already supported distributed tracing since 2006 via its OneAgent software. Dynatrace is now becoming the latest provider of observability tools to embrace open source software to instrument applications as part of an effort to focus engineering efforts on advancing analytics capabilities.

    In the case of Dynatrace, those capabilities are driven by a Davis artificial intelligence (AI) engine embedded within the Dynatrace platform and SmartScape continuous topology mapping technology. The combination of those technologies makes it possible for Dynatrace to automatically discover changes to IT environments and surface the root cause of any issue that might arise, noted Reitbauer.

    Despite being widely available via application performance monitoring (APM) tools, distributed tracing is now coming into vogue. As application environments become more complex, there is a need to more deeply analyze events to discover the root cause of an outage or performance issue.

    The challenge has been that applying that level of instrumentation to applications has been costly. Many IT organizations have historically limited the use of APM tools to their most mission-critical monolithic applications. It’s also worth remembering that three-tier applications are easier to troubleshoot because the potential source of any issue is probably already well-known to the IT team, he added.

    Given all the dependencies that exist between microservices, however, Reitbauer said the need to understand what’s occurring within an application environment more deeply is becoming a bigger requirement.

    Observability, of course, has always been a core tenet of best DevOps practices. The level of observability depth required by DevOps teams has tended to vary widely. Increased adoption of microservices-based applications invariably will push more IT organizations toward embracing DevOps at increasing levels of sophistication and maturity.

    In the meantime, the observability wars among platform providers are intensifying. There’s no shortage of options to achieve that observability, so it will be up to each IT team to decide which platform might best suit their DevOps workflow. Dynatrace is betting that as more applications become instrumented, deciding which platform to employ will shift closer to the AI capabilities that enable issues to be resolved issue faster regardless of what type of application is deployed rather than the capabilities of the agent software employed to instrument applications.

  • GitLab Open Sources Monitoring Tools

    GitLab Open Sources Monitoring Tools

    GitLab has decided to make its monitoring and observability tools available as part of its core open source platform to help reduce the total cost of DevOps. Previously, the tools were available as part of the commercial tools in GitLab’s DevOps platform.

    Kenny Johnston, director of product/Ops products for GitLab, said that as responsibility for observability shifts left, it is clear developers are now exercising more influence over which monitoring tools are employed. As developers begin to employ monitoring tools early in the application development process, most of them prefer open source tools because it’s unclear whether the application being developed will ever make it into a production environment, he said.

    However, if the application does make it into a production environment, it can be challenging for developers to make a case for standardizing on whatever monitoring tools they’re using in place of an existing commercial offering employed by an IT operations team. In addition to reducing costs, the GitLab approach could serve to eliminate any potential friction in the DevOps environment, as applications move from development into production environments.

    GitLab’s move to make its monitoring tools available as open source software comes at a time when more telemetry applications being employed to collect data are also based on open source software. In addition, developers of modern cloud-native applications based on containers are taking advantage of open source Prometheus monitoring software developed under the auspices of the Cloud Native Computing Foundation (CNCF) to monitor their applications. GitLab already provides integration with Prometheus.

    GitLab is also making it clear it expects its monitoring tools to benefit from the contributions of a larger pool of developers. Specifically, GitLab is calling for help in the areas of ongoing integrations with Prometheus along with improved logging, tracing and alerting capabilities.

    It’s not at all clear just yet to what degree DevOps teams will prefer to rely on open source versus commercial monitoring tools. While open source tools have some obvious advantages in terms of cost, many organizations have already standardized on commercial monitoring tools for a wide variety of existing applications. Open source tools often are more difficult to deploy and don’t tend to provide as much observability depth for IT operations teams. In addition, most of the providers of commercial monitoring tools are integrating their offerings with both open source telemetry software and Prometheus to bridge any divide that might occur between when an application is developed and deployed in a production environment.

    The one thing that is clear is a lot more individuals within the IT environments will be accessing these tools now that developers increasingly are being held accountable for the performance of their applications in production environments. In addition, modern applications require monitoring tools to make sense of all the dependencies that existing between microservices. Previously, IT operations teams tended to limit usage of monitoring tools based on commercial software to their most critical applications because of the costs involved. With the rise of open source monitoring tools, the opportunity to apply monitoring more broadly becomes more economically feasible.

    Regardless of the path forward chosen, the more visibility into IT environments provided, the easier it becomes to embrace best DevOps practices.

    — Mike Vizard