Tag: SRE

  • Five Great DevOps Job Opportunities

    Five Great DevOps Job Opportunities

    devopsy.kinsta.cloud is now providing a weekly DevOps jobs report through which opportunities for DevOps professionals will be highlighted to better serve our audience.

    Our goal in these challenging economic times is to make it easier for DevOps professionals to advance their careers.

    Of course, the pool of available DevOps talent is still relatively constrained, so when one DevOps professional takes on a new role it tends to create an opportunity for others.

    The five job postings shared this week are selected based on the company looking to hire, the vertical industry segment and, naturally, the pay scale being offered.

    We’re also committed to providing additional insights into the state of the DevOps job market. In the meantime, for your consideration:

    LinkedIn

    Samsung Electronics America
    Mountain View, California
    Lead Site Reliability Engineer (SRE) – DevOps Specialist
    $180,000 to $210,000

    Indeed.com

    Federal Reserve Bank of New York
    New York, New York
    DevOps Engineer
    $178,100 to $207,900

    CareerBuilder.com

    SAIC
    Chantilly, Virginia
    DevOps Advisor
    $130,000 to $200,000

    Dice.com

    Saicon Consultants
    Alpharetta, Georgia
    DevOps Engineer
    $110,000 to $140,000

    Simply Hired.com

    Hewlett-Packard Enterprise
    Fort Collins, Colorado
    DevOps Automation Engineer
    $109,400 – $251,500

  • Nobl9 Adds Tools to Make SLO Queries More Efficient

    Nobl9 Adds Tools to Make SLO Queries More Efficient

    At its SLOconf event today, Nobl9 added a Query Tester tool that validates whether queries made against the data its service level objectives (SLO) management platform collects will deliver meaningful results. Nobl9’s SLO management platform collects data in real-time from data sources such as New Relic, Datadog and Dynatrace to help customers meet SLOs.

    In addition, a Query Checker tool will now automatically put any new SLO into a testing state to automatically validate that the query against that SLO will run correctly.

    The company has also improved the precision of its calculations to provide DevOps teams with more accurate, reliable and actionable insights into the performance of services and added a Metrics Health Notifier toolset that provides insights into anomalous data being collected from various sources as well as what data might be missing. Nobl9 has also added a Custom Query Delay tool that gives DevOps teams more control over when data is pulled along with access to data source logs.

    Kit Merker, chief growth officer for Nobl9, said the overall goal is to improve the overall resiliency of its platform for managing SLOs.

    Finally, Nobl9 also announced that its platform is now available for the Google Cloud Platform (GCP) in addition to existing support for Amazon Web Services (AWS). As part of that GCP support, Nobl9 made available an educational site that provides example of how DevOps team can take advantage of the large language models (LLMs) that Google is making to improve SLOs or generate an SLO that is automatically converted into a set of YAML files.

    A survey of 314 IT professionals conducted by Dimensional Insight on behalf of Nobl9 found 69% have implemented SLOs, with more than three-quarters of those respondents crediting SLOs for preventing business disruptions. A total of 80% also noted their organization has an increased focus on system reliability, with just over a quarter (27%) saying SLOs saved their organizations a half million dollars or more. A full 95% said SLOs are also driving better business decisions.

    However, 97% also reported it is difficult to manage SLOs because of a lack of reporting, lack of application and environment support and interoperability issues.

    Nobl9 is trying to spur greater adoption of SLOs by making available an open source SLO specification that defines a common interface for constructing SLOs across a Git-based workflow. Nobl9’s platform based on that specification has now been integrated with 24 data sources, said Merker.

    SLOs, of course, are not a new idea. They have been employed as a metric to track the performance of IT services for decades. However, as more microservices-based applications are built and deployed, it’s becoming more challenging to maintain SLOs across applications that have many more dependencies than legacy monolithic applications.

    Ultimately, each IT team needs to provide some sort of objective benchmark that assesses their overall effectiveness at delivering application services. SLOs-as-code are intended to make it simpler to gather the metrics that confirm whether service levels are being achieved. Those SLOs are then tracked and integrated across any set of application services a DevOps team cares to track.

  • Mezmo Adds Free Community Plan for Managing Observability Data

    Mezmo Adds Free Community Plan for Managing Observability Data

    Mezmo this week added a free trial and a community plan for the Mezmo Telemetry Pipeline service to make it simpler for DevOps teams to store and manage the large amounts of telemetry data they are collecting.

    Mezmo CEO Tucker Callaway said as more DevOps teams embrace observability to minimize disruptions to application environments, they are struggling to manage the explosion of data being created. The Mezmo platform makes it possible to apply data engineering best practices to manage that data using a set of drag-and-drop visual tools, he added. A set of data transformation tools also makes it simpler to extract metrics embedded in the logs, summarize events and metrics and then forward those metrics to downstream platforms for analysis.

    The free edition of the platform makes it possible for organizations to begin to apply those capabilities without any upfront costs required, noted Callaway.

    It’s not clear to what degree DevOps teams may need to add data engineering to manage all the telemetry data being collected. It’s already apparent that the cost of storing and managing all that data is becoming a significant issue as more applications are instrumented. In fact, it’s nearly impossible to manage cloud-native applications without being able to observe interactions between the microservices used to construct them.

    Log management has always been a challenge, but with the addition of traces, the amount of telemetry data being collected to surface metrics has increased. The Mezmo platform makes it possible to set a daily or monthly hard limit on the volume of logs stored or, alternatively, set soft daily or monthly quotas that can apply throttling logic to ensure mission-critical log data will continue to flow.

    DevOps teams can also make use of soft limits to reallocate storage resources from one team to another based on how much log data might be generated for a specific amount of time.

    Reducing storage costs has naturally become a higher priority during challenging economic times, so there’s a lot more pressure for DevOps teams to be more efficient. Finance teams are reducing costs by, for example, applying quotas to the amount of storage resources being made available to individual DevOps teams. The days when cloud storage resources were made available indiscriminately are over.

    It’s not clear how quickly DevOps teams are embracing observability, but it is certain that relying on predefined metrics to monitor IT environments is no longer sufficient. DevOps teams need to be able to query telemetry data to, for example, identify bottlenecks that are often created by dependencies between microservices. The issue is striking a balance between the amount of data being collected and the cost of storing it all.

    Regardless of approach, observability is rapidly becoming a requirement for DevOps teams to succeed. In fact, there is already no shortage of observability platforms to choose from. The issue is that not every observability platform provider is equally concerned about the cost of storing all the data being collected.

  • PagerDuty Bets on AIOps and Automation to Simplify IT Management

    PagerDuty Bets on AIOps and Automation to Simplify IT Management

    PagerDuty this week made generally available an artificial intelligence for IT operations (AIOps) platform that leverages the data model embedded in its incident management software to reduce the amount of time required for an AI platform to learn how an IT environment operates.

    Jonathan Rende, senior vice president and general manager for PagerDuty, said that approach enables the PagerDuty AIOps platform to begin surfacing valid recommendations sooner than other AIOps platforms. Other platforms first need to be integrated into IT environments by an expensive team of consultants and integrators, he added. The PagerDuty approach makes the benefits of AIOps immediately available to both IT operations teams and application development teams alike, he said.

    The arrival of PagerDuty AIOps comes on the heels of the launch of PagerDuty Process Automation, a platform for orchestrating automation across multiple platforms that is integrated within PagerDuty Operations Cloud. That capability makes it possible for organizations to centralize the management of islands of automation that have emerged across the enterprise without having to replace any framework that has already been deployed, said Rende. There are also more than 700 integrations between PagerDuty AIOps and the PagerDuty Operations Cloud platform.

    Like other platforms, PagerDuty AIOps relies on machine learning algorithms and an AI model created by PagerDuty to correlate events so that the platform can put them in context. Incident response recommendations are then made, which an IT team can accept and automatically implement or reject. The platform then uses those inputs to surface more accurate recommendations over time, said Rende.

    The platform will also automatically group apply defined rules coupled with its machine learning capabilities to aggregate alerts. That capability reduces the overall alert noise that might otherwise be generated, noted Rende.

    Organizations are looking to invest in AI and automation more heavily at a time when many of them are reducing the overall size of their IT staff, said Rende. The challenge with AI, however, is that it can take six months or more for a rival AIOps platform to learn enough about an IT environment to begin making recommendations. The PagerDuty approach takes advantage of the data within the PagerDuty incident management platform to train an AI model more quickly, in a way that reduces the time to generate valid recommendations to a matter of days, noted Rende.

    PagerDuty has been building that AI model for the last four and a half years with that specific goal in mind, he added.

    It’s not clear how quickly organizations are embracing AIOps, but as IT environments continue to evolve, many once-manual tasks are being automated. There is a natural fear of the impact those advances might have on specific roles within an IT organization, but as IT environments get more complex, there will always be a need for IT personnel that can focus on higher-order tasks, said Rende.

    Overall, the rate of IT staff turnover should also decline as much of the toil that contributes to burnout is also eliminated.

    It may be a while yet before AI becomes pervasively applied to manage IT, but the proverbial genie is not going back into the bottle. The challenge is determining precisely where the line between the man-machine interface with IT environments is today versus where it might be tomorrow.

  • Predicting, Preventing and Resolving Incidents With AIOps

    Predicting, Preventing and Resolving Incidents With AIOps

    IT operations teams, site reliability engineers (SREs) and service providers are on a mission to scale across geographies, expand their digital services and create new experiences for customers. Amid this drive, their backend IT systems are getting more complex. This hinders visibility into applications and makes monitoring and troubleshooting cumbersome. With heightened competition in the market, businesses cannot afford to take hits on revenue or customer experience scores due to issues stemming from their IT stack, such as unknown outages, increased incident management times and data replication.

    Infusing artificial intelligence capabilities into IT operations (AIOps) can raise efficiency through automation, improve security and make a significant impact in warding off downtime. AIOps uses machine learning (ML) to enhance IT operations such as performance monitoring, event correlation and analysis. With AIOps, IT teams, SREs and service providers can predict and prevent outages before they occur and resolve them automatically. Moreover, AIOps uses ML to analyze current and past data to make precise predictions, reducing costs and speeding up return on investment (ROI).

    AIOps Implementation

    Launching AIOps requires a unique approach depending on your organization, its capabilities and needs. This article provides a three-step implementation strategy to help your organization detect incidents before they impact users, automate responses and prevent recurring issues.

    AIOps 201

    Fig: AIOps implementation approach

    With the advanced ability to collect and analyze IT operational data, AIOps is an asset for a range of actions and solutions. When implemented effectively, AIOps can enable IT teams, SRES and service providers to significantly reduce application outage costs by over 60% within a span of 24 months.

    Getting Started With AIOps: Predicting Outages in Applications and Infrastructure

    The AIOps platform can be leveraged by IT teams, SREs and service providers for data gathering, analysis and generation of useful insights. It is designed to enhance operational efficiency, offer predictive alerts, reduce mean-time-to-identify (MTTI) and mean-time-to-repair (MTTR) as well as prevent service outages.

    Recommendations

    • Prioritize onboarding mission-critical applications, such as network monitoring, fault management and service assurance onto the AIOps platform.
    • Determine the best method to ingest data from the different monitoring tools. For example, build APIs, use pre-built connectors, use MuleSoft to automatically collect data from different systems, etc.
    • Choose the right ML model based on the types of raw data, e.g., use an anomaly detection model to identify issues from a dataset or use a time-series model to understand patterns based on historic data.
    • Use closed-loop automation to resolve low-risk issues; for example, automate disk clean-up issues or Java Virtual Machine (JVM) bounce for JVM-related issues.

    AIOps platform

    Fig: AIOps platform

    Assess Your Organization’s Adoption of AIOps to Gain Value

    Organizations contemplating AIOps as a strategy should first evaluate their current maturity and then chart out a path to make the best use of AIOps, which is automated resolution. There are three levels of maturity in AIOps adoption.

    Maturity

    Recommendations

    Level 1: Dashboard

    • Remove operational siloes by integrating the application data sources into unified architecture and ITOM tool.
    • Collect logs from applications and set up alerts that are commissioned to command centers to escalate as per the defined SOPs.

    Level 2: Alarm & Recommend

    • Implement supervised or unsupervised ML algorithms on the unified data to derive insights.
    • De-duplicate and correlate alerts and events through noise reduction to alleviate alert fatigue

    Level 3: Automation

    • Correlate incidents and events with business impacts by leveraging ML algorithms.
    • Trigger autonomous remediation bots spontaneously based on the predictive insights to fix incidents that are likely to happen in operations.

    Identify Applications for the AIOps Platform

    Conduct an AIOps workshop with key stakeholders to narrow down the list of apps and prioritize them for evaluation. Apply specific criteria to prioritize applications that meet the required onboarding standards.

    Recommendations

    • Prioritize onboarding critical apps and outage-causing apps on the AIOps platform.
    • Tag the data e.g., metrics, logs, inventory, topology, to ease the browsing, searching and visualization of data across the distributed analytics repository.
    • Setup an AIOps service and support team, as there is a constant need to maintain and update the platform features
    • Collect all relevant logs, metrics and traces along with data collected from ITOM platforms. A poorly constructed AIOps platform will show incorrect insights and inaccurately reflect the activities in the IT environment.

    Onboard Applications and Leverage AI to Predict and Resolve Issues

    To initiate application onboarding, monitoring tools must be set up to collect data for ML models. Predictions from the models can be integrated into visual dashboards for analysis.

    Automate AIOps

    Fig: Application onboarding

    Recommendations

    • Route both the on-premises and cloud-centric data to the AIOps platform. This will facilitate the prediction of issues in both the environments.
    • Use ML models such as Prophet, Nelson, Arisma, Random Forest, etc., to forecast the time series data, correlate the events and predict thresholds.
    • Choose secure connectors to transfer data in/out of the AIOps platform. For instance, any log flowing into the platform must be sent over transport layer security (e.g., syslog) or HTTPS (API endpoints).

    By implementing AIOps, service providers can successfully reduce the MTTI and MTTR, attaining a 63% reduction in outage costs for applications within 24 months, a 90% reduction in false-positive alerts and a 400+ hours reduction in downtime per annum.

    Ramesh Ram (Assistant Vice President), Sreedhar S K (Associate Director), Sakthivel D (Director), and Rohit Karthikeyan (Manager) also contributed to this article.

  • Debunking Myths About Reliability

    Debunking Myths About Reliability

    “Our service should always be up.” Some myths just won’t die.

    Engineering for reliability is well understood by engineering leaders, less so by bosses demanding unreasonable uptime with minimal resources and immense feature pressure. Business leaders tend to waffle between ignoring reliability with a hand wave and freaking out after an outage. How can they understand the reality of reliability and forget the myths?

    Myth One: Our Service Should Always be Up

    Reality: Our Service is Engineered to Consistently Exceed Expectations

    Some might imagine reliability like a light switch—it is either on or off. But reliability is about consistent repetitions and managing the risk of minor, occasional, recoverable failures. Can we consistently exceed customer expectations?

    Understanding customer expectations is challenging because you can’t ask people what they expect from you (unless you have a peculiar customer). So instead, we want to define and quantify the impact of our service not working and how that could negatively impact customer experience based on observed behavior. For example, “People abandon their shopping cart when our checkout experience takes more than 10 seconds to load, which means we lose money.”

    We reflect business impact in our reliability goals and then engineer our system and processes to meet this goal. We might change how we do releases, ensure tests pass or avoid changes during times of peak usage. These engineering decisions use reliability as a business metric based on customer expectations.

    Myth Two: Innovation is More Valuable Than Reliability

    Reality: You Need to Balance Innovation and Reliability Engineering Work

    The constant drive for new features over reliability is the most frustrating myth. “We need to release new feature X, or we won’t have customers; we can worry about reliability later.” In reality, most customers care about reliability; they don’t mention it until it’s a problem.

    You can have the most fantastic whizbang feature in the world, but if it doesn’t work–and Murphy’s Law will make sure that it doesn’t work at the worst possible time–no one can use it, no one will be impressed and it will turn your technology into a laughingstock.

    Innovation excites customers, but trust comes from reliability, which you must earn through hard work and clever engineering. Depending on your business context, you may require reliability more than ever. If you are facing headwinds, you may need to scale back your ambitions regarding innovative features. Still, you can’t scrimp on reliability or customers will justifiably leave.

    Myth Three: Five Nines is Normal and Incremental From Four Nines

    Reality: Five Nines is Expensive—10X the Cost of Four Nines

    No one–not even massive cloud providers or telcos–can consistently deliver at 99.999% across all their services by accident. Reliability at that level–less than six minutes downtime per year!–is an engineering marvel. A bridge or a dam might look simple after completion, but the engineering required to create a reliable physical infrastructure is immense, as everyone knows. Why is it so hard to understand the complexity, design, engineering and redundancy required to deliver a highly available and performant digital system? Further, it’s easy to think that 99.999% is just a bit more than 99.99%. After all, it’s “just one more nine.” Remind your less-technical counterparts that each nine requires ten times more effort!

    Why is it so expensive to deliver? Because the failure tolerance (also known as an error budget) is 1/10th the size but the risk of missing the goal increases exponentially. You’ll need more redundancy, careful testing and certification of releases, increased on-call rotations, extra hardware or cloud capacity and extensively tested backup plans to achieve this goal.

    Worst of all, higher reliability will slow you down. You can’t innovate or deliver updates as fast when you need to ensure absolute uptime.

    But what if there was a limit to how much reliability we need?

    Myth Four: More Reliability is Always Good

    Reality: Reliability Engineering Has Diminishing Returns

    There is a point at which being “too reliable” is terrible for business. It’s expensive to build all that redundancy, testing, responding to tiny glitches and all the rest. And most of your users won’t notice. We must avoid the large blowups that put us in the headlines and manage expectations everywhere else. The significant outages that can impact thousands, if not millions of customers come from this reductionist view of reliability as a by-product of conscientious work rather than an engineering problem with well-defined tolerances and thresholds. You earn the trust of your customers by properly engineering reliability into your delivery process.

    Consider tardiness at meetings. If you wanted to be 99% on time, you’d need to join a one-hour call within 36 seconds and at 99.9%, you would need to enter a Zoom within 3.6 seconds of its start time, a timescale so small you don’t even notice it. You would have to do this for every meeting you attended, no excuses–bio breaks, last meeting ran long, someone at the door, etc. None of these things matter when defining and measuring reliability. This metaphor also provides a common sense way to think about risk and error budgets. Your other meeting attendees can’t possibly notice (or care) if you’re 3.6 seconds late, no matter how prestigious or impatient the other party is.

    You could apply this same reasoning to catching a flight, picking up your kids from school, completing an exam, building a woodworking project or any human endeavor. The concept is so intuitive to daily life that even pointing it out seems absurd. But this is the fundamental concept from which reliability engineering stems. To build a reliable system, we must define acceptable failure boundaries. Otherwise, we will spend precious time and resources to eliminate the 3.6 seconds of delay that no one cares about and miss the more significant issues–like being present and engaged in the discussion.

    Busting Reliability Myths

    Understanding reliability is vital for engineers and business people alike. It all comes down to intentionally designing a customer experience, keeping up with expectations and, in some cases, even promises. Right-sizing reliability lets you find the perfect balance between delivering excellent service and efficiently running your organization.

    Image Source: Indira Tjokorda via Unsplash 

  • Why Observability is Important for Development Teams

    Why Observability is Important for Development Teams

    Observability, which allows development teams to understand better how their systems behave in production, is critical to successful software delivery. According to Gartner, by 2026, 70% of organizations that successfully applied this practice will achieve shorter latency for decision-making, enabling competitive advantage for target business or IT processes.

    Observability allows development teams to identify and diagnose issues quickly to make decisions that improve overall software delivery performance. Let’s take a closer look at why this practice is critical for development teams.

    Differentiating Observability and Visibility

    To better understand observability, it’s essential to clear up a common misconception – that observability and visibility are the same. Two critical differences exist between the two. Visibility allows development teams to look at the surface-level aspects of an application or system. In contrast, observability provides deeper insight into what an application is doing in production. Being equipped with a deep knowledge of observability allows developers to be more productive within their respective organizations.

    Impact on Developer Productivity

    With observability, developers can identify and diagnose issues within applications quickly, giving them more time to fix bugs and time for resolution, which are both critical success factors for software delivery. Observability allows organizations to quickly identify and respond to potential problems, such as operational issues or security breaches, before they become issues that impact customers or users. While there is no such thing as perfect software, observability helps developers quickly find and fix issues, bottlenecks, inefficiencies, etc., so they can get back to doing what they love: Creating new software.

    With the benefits of observability, developers naturally gravitate toward tooling and technology. There are many tools available for developers to take advantage of, and development teams must learn how to use these tools to integrate them into their applications and services. Let’s explore some of the more popular options.

    The Shift to Cloud-Native Tools

    The shift to cloud-native tools is driven by the increasing popularity of cloud computing and its benefits, such as scalability, cost-effectiveness and flexibility. The move to cloud-native has made an enormous impact on observability efforts. Having good tooling and processes available positively impacts observability efforts because it’s a critical aspect of the developer communities’ systems. Overall, the shift to cloud-native tools is driven by the need for organizations to take advantage of the benefits of cloud computing and the need for more efficient and flexible deployment and scaling of applications.

    Some of the most common tools in observability include:

    These tools offer developers greater insight and knowledge into how applications behave. The cloud-native approach necessitates a new way to aggregate all of these operations.

    Conclusion

    With observability, developers can understand how their systems work in production. These systems act in different ways depending on the environments they run in. Therefore, organizations must do more to provide developers with sufficient observability because of the limited visibility into the overall system performance.

    Observability allows developers to act quickly and remedy issues before they go into production and organizations can better measure success relative to the application’s performance. Hours of developers’ time are spent manually debugging and troubleshooting when organizations could have a system in place to do this automatically and allow developers to get back to what they love doing most: Creating software. Observability helps organizations make better-informed decisions, improve operations and performance and achieve their objectives more effectively.

  • Nobl9 Adds Service Level Analyzer to SLO Management Platform

    Nobl9 Adds Service Level Analyzer to SLO Management Platform

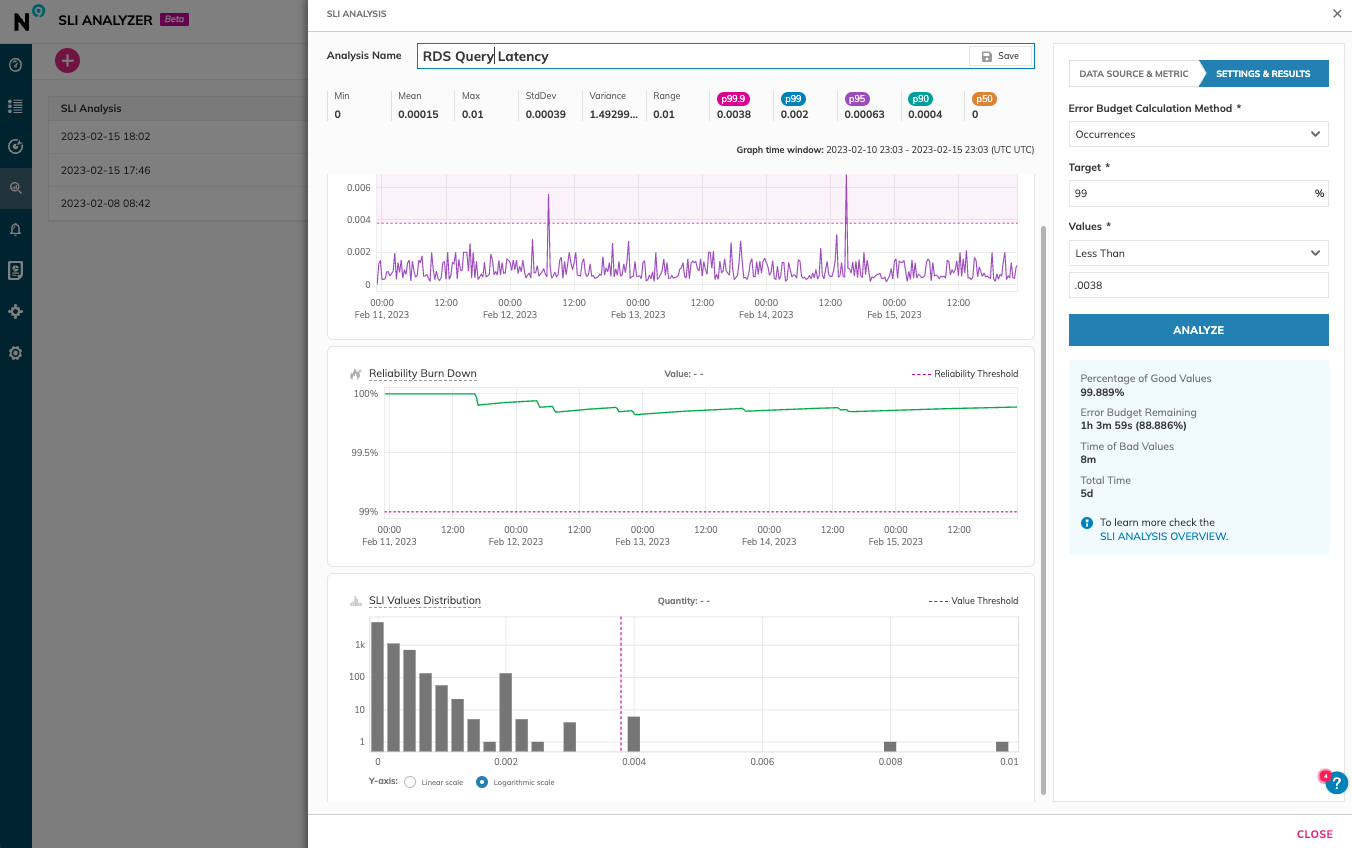
    Nobl9 today added a free tool for analyzing service level objectives (SLOs) to its platform to enable DevOps team to more accurately set reliability goals.

    Brian Singer, chief product officer for Nobl9, said Service Level Analyzer collects metrics and observability data from more than 24 DevOps tools and platforms that can then be used to create an SLO via a single click.

    Included as part of the free tier of the Nobl9 service, Service Level Analyzer also enables DevOps teams to more easily update SLOs as error budgets and error budget burn rates change over time based on actual incidents that have occurred, added Singer.

    DevOps teams can also perform “what-if” analysis to test out the impact of different targets and thresholds on error budgets, he added. That capability ultimately reduces costs because DevOps teams become less likely to overprovision resources to ensure application performance and resiliency, noted Singer. In effect, Service Level Analyzer is providing DevOps teams with an observability tool that spans the entire software development life cycle, said Singer.

    Nobl9 is trying to spur greater adoption of SLOs by making available an open source SLO specification that defines a common interface for constructing SLOs across a DevOps workflow. SLOs, of course, are not a new idea. They have been employed as a metric to track the performance of IT services for decades. However, as more microservices-based applications are built and deployed, it’s becoming more challenging to maintain SLOs across applications because they have many more dependencies than legacy monolithic applications.

    Ultimately, each DevOps team needs to provide some sort of objective benchmark that assesses their overall effectiveness at delivering application services. SLO-as-code is intended to make it simpler to gather the metrics that confirm whether service levels are being achieved. As organizations become more dependent on software to drive digital processes, those SLOs are then tracked across everything from financial services to supply chains.

    In general, DevOps teams are more comfortable with the SLO concept, said Singer. The biggest challenge is making them simpler to implement, he added. The Service Level Analyzer lowers the bar for implementing an SLO by making historical data stored in DevOps tools and platforms more accessible, noted Singer. Rather than having to manually collect that data and then normalize it in an external repository, Nobl9’s Service Level Analyzer automates that process on behalf of a DevOps team using actual data versus relying on less precise statistical analysis, said Singer.

    As IT environments become more distributed, the number of dependencies that exist across application environments only continues to expand. IT teams can spend weeks trying to discover the root cause of issues that are negatively impacting application performance, only to discover that, for example, calls to an application performance interface (API) are being rerouted in a way that significantly increases latency. Tools that enable DevOps teams to more easily understand the relationships between all the services that make up an application environment are more crucial than ever.

  • 5 Technologies Powering Cloud Optimization

    5 Technologies Powering Cloud Optimization

    Cloud optimization is the process of improving the performance, cost-effectiveness, and reliability of cloud computing resources and services. It involves identifying and addressing inefficiencies in cloud architecture, application design and resource utilization, as well as implementing best practices for security, scalability and disaster recovery. 

    The goal of cloud optimization is to maximize the benefits of cloud computing while minimizing the risks and costs associated with it. It is a multi-disciplinary process that may involve several key elements, such as:

    • Capacity planning: Evaluating the current and future resource requirements of your cloud environment and ensuring that the right amount of resources are available to meet your needs.
    • Resource utilization: Monitoring and managing the utilization of cloud resources to ensure that they are used efficiently and effectively.
    • Cost optimization: Minimizing the cost of cloud resources and services by identifying and addressing areas of inefficiency and waste, such as over-provisioning or underutilized resources.
    • Performance optimization: Improving the performance of cloud applications and services by optimizing network bandwidth, storage performance and database performance.
    • Security optimization: Enhancing the security of cloud resources and data by implementing best practices for access control, encryption and threat mitigation.
    • Scalability optimization: Making sure that your cloud environment can scale up or down as needed to meet changing resource demands.
    • Disaster recovery: Establishing a disaster recovery plan to ensure that your cloud environment can quickly recover from failures or outages.

    Why is Cloud Optimization Important?

    Optimization is important for several reasons, including:

    • Cost savings: By optimizing the use of cloud resources, organizations can reduce their cloud computing costs and ensure that they are only paying for what they actually need.
    • Improved performance: By optimizing cloud applications and services, organizations can improve the performance and responsiveness of their systems, leading to a better user experience and increased productivity.
    • Increased reliability: Optimization helps organizations to improve the reliability and availability of their cloud environment, reducing the risk of downtime and ensuring that their systems are always available when they are needed.
    • Better security: By implementing best practices for security, organizations can better protect their cloud resources and data, reducing the risk of data breaches and other security incidents.
    • Scalability: Cloud optimization enables organizations to scale their environment up or down as needed, ensuring that they always have the resources they need to support their growing business.
    • Improved agility: Organizations can be more agile and responsive to changing business needs, enabling them to quickly and effectively respond to new opportunities and challenges.

    5 Technologies Powering Cloud Optimization

    Cloud Cost Management

    Cloud cost management is a critical component of optimization that helps organizations to monitor and manage their cloud spend. The goal is to ensure that organizations are only paying for the cloud resources they actually need and that they are using those resources efficiently.

    Cloud cost management solutions (such as Azure Cost Management or AWS Trusted Advisor) provide detailed cost reports, usage analytics and cost optimization recommendations to help organizations understand their cloud spend and identify areas of inefficiency. For example, these solutions can:

    • Monitor and report on cloud resource usage: By monitoring the usage of resources, cloud cost management solutions can provide detailed cost reports that show how much an organization is spending on each resource, such as compute instances, storage and network traffic.
    • Automate cost optimization: Many cloud cost management solutions can automate cost optimization tasks, such as turning off unused resources or right-sizing instances to reduce waste.
    • Provide cost analysis and forecasting: These solutions can provide detailed cost analysis and forecasting to help organizations understand the impact of changes to their cloud environment and plan for future spending.

    Autoscaling

    Autoscaling is a technology that enables organizations to automatically scale their cloud resources up or down as needed to meet changing demands. The goal of autoscaling is to ensure that organizations always have the right amount of resources to support their workloads while minimizing costs and ensuring that their systems are always available when they are needed.

    Autoscaling works by monitoring the performance and usage of cloud resources, such as compute instances, storage and network traffic, and automatically adjusting the size of those resources to meet changing demand. For example, autoscaling can:

    • Add or remove instances as needed: If demand for a resource increases, autoscaling can automatically add more instances to meet that demand. If demand decreases, autoscaling can automatically remove instances to reduce waste.
    • Optimize resource utilization: Autoscaling can optimize the utilization of cloud resources by right-sizing instances to meet demand, ensuring that resources are not over-provisioned or underutilized.
    • Improve system availability: By automatically adding or removing resources as needed, autoscaling can ensure that systems are always available and responsive, reducing the risk of downtime and improving the user experience.

    API Gateway

    An API gateway is a server that acts as an intermediary between an application and one or more microservices. The API gateway is responsible for request routing, composition and protocol translation, which enables microservices to communicate with each other securely and efficiently.

    An API gateway can help with cloud optimization in several ways:

    • Load balancing: The API gateway can distribute incoming API requests to multiple microservices, improving the overall performance and reliability of the system. It can also provide features such as automatic failover and load balancing, which helps to ensure that the system remains available and responsive even in the face of high traffic volumes or other performance challenges.
    • Resource optimization: By acting as a single entry point for API requests, the API gateway can help to reduce the overall resource usage of the system. For example, it can cache frequently used data and serve it directly to clients without having to go back to the microservices, reducing the load on the underlying system.
    • Monitoring and management: API gateways provide a centralized management interface for the microservices, making it easier to monitor and manage the system as a whole. This includes features such as logging, monitoring and alerting, which can help to identify and resolve performance issues quickly and effectively.

    GitOps Platforms

    GitOps is a paradigm that helps automate application deployment and infrastructure provisioning. It typically involves using Git, an open source version control system, as a single source of truth for declarative infrastructure and applications. 

    GitOps aims to improve the developer experience by letting teams use their familiar software development tools to manage application and infrastructure changes.

    With GitOps, cloud optimization can be achieved by:

    • Automating the deployment process: GitOps automates the deployment process, reducing the risk of human error and speeding up the deployment process. This helps to ensure that resources are deployed consistently and correctly, improving the reliability and performance of the environment.
    • Managing cloud infrastructure as code: With GitOps, cloud infrastructure can be defined and managed as code, making version control and collaborating on configurations easier. This helps to optimize the use of resources and improve the overall efficiency of the cloud environment.
    • Improving collaboration and communication: GitOps enables teams to collaborate and communicate more effectively, reducing the risk of conflicts and delays. With Git, changes can be easily tracked, discussed and approved, improving the speed and quality of deployments.
    • Enforcing governance and compliance: GitOps provides a centralized and auditable record of all changes to the environment, making it easier to enforce governance and compliance requirements. This helps to improve the security and reliability of the cloud environment, reducing the risk of breaches and other security incidents.

    APM

    Cloud application performance management (cloud APM) is the practice of monitoring, analyzing and optimizing the performance of cloud-based applications. The goal is to ensure that these applications are available, responsive and performing optimally to meet the needs of users.

    These solutions provide a range of tools and capabilities for monitoring and optimizing cloud-based applications, including:

    • Performance monitoring: Cloud APM solutions monitor application performance in real-time, providing visibility into performance metrics such as response time, resource utilization and error rates.
    • Root cause analysis: These solutions can help identify the root cause of performance issues by providing detailed performance data and tracing information.
    • Capacity planning: Cloud APM solutions can provide detailed performance data and analytics to help organizations plan and optimize their application deployments.
    • Performance optimization: These solutions can provide recommendations for performance optimization, such as right-sizing cloud resources, reducing resource utilization and improving application design.
    • Continuous performance monitoring: These solutions can continuously monitor application performance, providing real-time visibility and alerting to help organizations quickly identify and resolve performance issues.

    Conclusion

    In conclusion, cloud optimization is critical for organizations looking to maximize the value and minimize the costs of their cloud deployments. By using technologies such as cloud cost management, autoscaling, API gateways, GitOps platforms and APM, organizations can improve availability, performance and efficiency while reducing costs and ensuring that they are always prepared to meet changing business needs. 

    These technologies provide the tools and capabilities necessary to monitor, analyze and optimize cloud-based applications, helping organizations to ensure that their deployments are always delivering the best possible value. By embracing optimization, organizations can stay ahead of the curve and ensure that their cloud deployments are always aligned with their business goals and objectives.

  • Where Does Observability Stand Today, and Where is it Going Next?

    Where Does Observability Stand Today, and Where is it Going Next?

    As we move into the second half of 2023, it’s only natural to engage in the annual ‘state of the industry’ reviews and take a general inventory of the past year while looking out into the immediate future. Observability has gained traction among DevOps and platform engineering teams over the past year and is poised to continue that velocity. But my observation is that the current observability model is broken.

    Too Much Data

    Long story short: Many organizations (and engineers specifically) agree that they are sending too much data to their monitoring tools, resulting in an inability to garner valuable insights because the systems are massively overloaded. Sending this high volume of data also costs too much and requires an inordinate amount of time for analysis, which many organizations don’t have. Put simply–more data doesn’t mean more clarity; in fact, we see the opposite.

    Massive adoption of cloud-native technologies such as Kubernetes that heighten the challenge of efficiently monitoring environments is also accelerating this problem. Beyond increasing costs and complexity, many teams seem to feel that their current approach doesn’t create the desired level of observability for Kubernetes, full stop.

    Another major issue we see on the observability landscape relates to the overall maturity of monitoring processes and teams. In many instances, even when organizations have effective tools, they struggle to interpret the data produced into targeted conclusions that their teams can translate into effective actions. And this is further amplified by the outstanding engineering talent shortage because good people are harder to find and retain than ever before.

    We also see a lot of pervasive challenges related to organizations’ desire to use popular open source monitoring tools-especially if they are attempting to do so in an integrated manner or to support rapidly growing deployments at scale.

    Overwhelmed by Observability Data?

    In summary, if you’re overwhelmed by observability data, if complexity and costs grow out of control and you’re also struggling to make sense of the available information and improve your cloud applications, we think that means that the current observability model really is broken.

    To that end, gaining a deeper perspective into end user opinions on these topics, among others, is the precise goal of the annual DevOps Pulse Report, currently in its sixth year and now in the survey stage. We predict that this year’s research project will underline the aforementioned challenges and help frame how teams might seek to address them.

    What types of findings do we hope to unearth? Last year, respondents revealed that despite a growing perception of DevOps maturity, it was actually taking them more time to respond to emerging problems. Roughly 64% of respondents reported that MTTR during production incidents was over an hour, compared to only 47% the previous year.

    Last year’s report also highlighted the reality that monitoring complex environments remains difficult with over 52% of respondents citing Kubernetes, microservices and serverless as their primary challenges in gaining improved observability.

    Both of these previous findings also seemed to underline the growing issues of data overload and spiraling complexity. We’ve also seen previous evidence of a lack of maturity around distributed tracing—a critical observability practice aimed directly at increasing visibility into complex architectures—despite the fact that 75% of respondents listed it as a priority in last year’s research.

    Is your team struggling to make sense of its available monitoring data, or do so in a way that aligns with your current processes or budgets? Hopefully, the 2023 DevOps Pulse Report, set to publish early this year, will put some numbers behind these assertions and help us all understand how to move forward.

    If you want to participate, you can do so here.