Tag: SRE

  • Observe Inc. Brings Generative AI to Observability

    Observe Inc. Brings Generative AI to Observability

    Observe, Inc. today revamped the Hubble user interface to its observability platform that has been infused with generative artificial intelligence (AI).

    Fresh from raising an additional $50 million in funding, Observe CEO Jeremy Burton said as the company’s software-as-a-service (SaaS) platform continues to be infused with AI using multiple large language models (LLMs), it’s becoming apparent that observability is rapidly becoming democratized.

    Most IT organizations still rely primarily on legacy monitoring tools to track a set of predefined metrics. Observability platforms have arisen to aggregate metrics, logs and traces to enable DevOps teams to launch queries and surface the root cause of performance issues or IT incidents. The challenge is that most observability platforms have required IT teams to master a proprietary query language such as Observe’s RegEx.

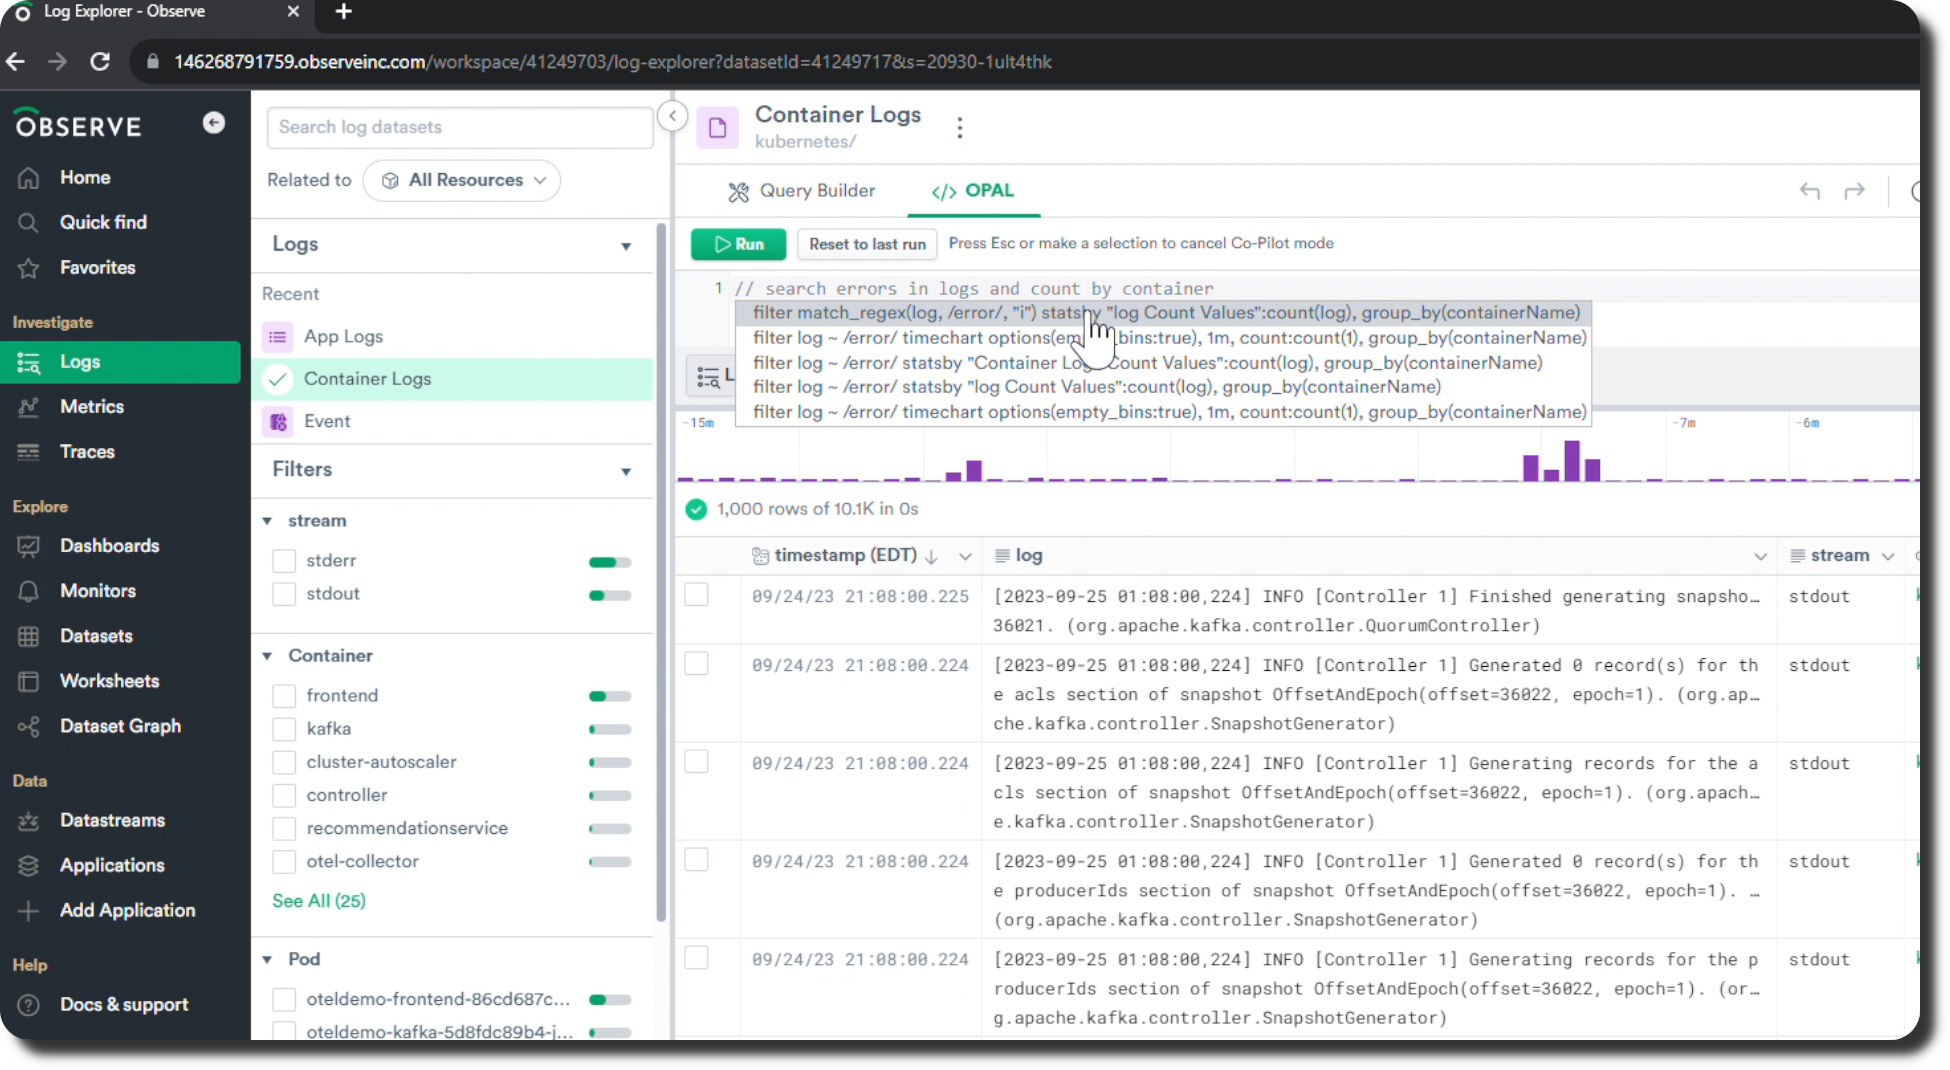
    However, with the rise of generative AI tools, it is now possible for IT professionals of all skill levels to employ a natural language chatbot to generate a RedEx query, noted Burton. A RegEx generation tool also parses data to add structure to logs on-the-fly, and there is also an OPAL Co-Pilot that generates OPAL code in response to natural language inputs.

    Observe

    The Hubble interface furthers those capabilities by simplifying the onboarding experience anytime there is a new member added to an IT team, he added. Hubble also expands the range of data access options available, including a public application programming interface (API), a command line interface (CLI), export to CSV and data sharing to the Snowflake cloud platform.

    IT teams are also coping with an explosion of telemetry data generated by modern distributed applications based on microservices architectures. Legacy observability and monitoring tools were not designed for these data volumes, so when there is an incident, the mean-time-to-resolution (MTTR) is increasingly extended. In contrast, the Observe platform now features a ‘Live’ mode that enables data to be queried in 20 seconds or less from when it was created.

    Other capabilities include an assistant embedded in Slack to help users troubleshoot issues and summarize threads for incident response.

    While it’s still early days as far as the adoption of observability platforms are concerned, there is already no shortage of options. The pending acquisition of Splunk by Cisco next year will cause more organizations to reevaluate their IT management options, so the pace at which organizations are transitioning to cloud-hosted observability platforms should increase, noted Burton. Even after the merger is completed, it might be several more months before Cisco integrates its AppDynamics platform with the observability platforms that Splunk added to its IT operational analytics platform, he added.

    In the meantime, IT environments are only going to become more complex. It won’t be feasible for most IT teams to manage highly distributed computing environments without some help from AI. The challenge, as always, will be finding the budget dollars needed to deploy an observability platform before the number of increased IT incidents makes the need for one painfully obvious.

  • Nobl9 Unfurls Reliability Center for Managing SLOs

    Nobl9 Unfurls Reliability Center for Managing SLOs

    Nobl9 today launched a next-generation platform for managing service level objectives (SLOs) in a way that promised to improve overall reliability.

    Brian Singer, chief product officer for Nobl9, said in addition to enabling DevOps teams to meet SLOs, the Nobl9 Reliability Center also now provides a single source of truth about the state of reliability in an application environment.

    That capability is critical because as DevOps teams add new features to applications, they need insights into how they are impacting the reliability of the software environment, said Singer. No matter how great any new capabilities might be, it won’t matter much if the application environment slows to a crawl or outright crashes, he added.

    Nobl9 Reliability Center addresses that need by providing dashboards and reports to assign reliability scores based on the metrics collected from the SLOs defined. Those scores can then be shared with senior business and IT leaders so they can better understand the actual state of an application environment, noted Singer.

    In addition, the platform will recommend SLOs and policies and can be used to automate runbooks to improve reliability. The goal is to enable DevOps teams to continuously monitor and manage using SLOs via alerts that are received in a way that is timely enough to act on, added Singer.

    That approach enables DevOps teams to make sense of conflicting alerts generated today by multiple monitoring and management tools. A recent survey published by Nobl9 found 72% of respondents are using six or more monitoring and observability tools.

    The Nobl9 platform collects SLOs by tracking workflows through more than 50 integrations with various DevOps tools and platforms.

    SLOs, of course, are not a new idea. They have been used as a metric to track the performance of IT services for decades.

    However, as more microservices-based applications are built and deployed, it’s becoming more challenging to maintain SLOs across applications that have many more dependencies than legacy monolithic applications. Ultimately, each IT team needs to provide some sort of objective benchmark that assesses their overall effectiveness at delivering application services. The Nobl9 platform makes it simpler to track whether SLOs are achieved and maintained.

    That’s crucial because as more organizations depend on software to deliver digital services, any disruption is likely to have a direct impact on profit and revenue. As such, the reliability of application environments has become a major concern. The issue, of course, is that many of those application environments have dependencies on legacy platforms that, in some cases, have been running for years. Each feature and application programming interface (API) added over time conspires to adversely impact performance. In an era where IT teams are now trying to manage distinct services rather than individual applications, latency can significantly slow down response times.

    Each organization will need to determine for themselves how aggressively they need to manage SLOs. But thanks to the rise of digital business transformation, more senior IT and business leaders are focused on them than ever.

  • Five Great DevOps Job Opportunities

    Five Great DevOps Job Opportunities

    devopsy.kinsta.cloud is now providing a weekly DevOps jobs report through which opportunities for DevOps professionals will be highlighted to better serve our audience.

    Our goal in these challenging economic times is to make it easier for DevOps professionals to advance their careers.

    Of course, the pool of available DevOps talent is still relatively constrained, so when one DevOps professional takes on a new role it tends to create an opportunity for others.

    The five job postings shared this week are selected based on the company looking to hire, the vertical industry segment and, naturally, the pay scale being offered.

    We’re also committed to providing additional insights into the state of the DevOps job market. In the meantime, for your consideration:

    CareerBuilder.com

    Cognizant Technology Solutions
    Phoenix, Arizona
    Senior DevOps Architect
    $130,000 to $180,000

    Indeed.com

    IBM
    Research Triangle Park, North Carolina
    SAP DevSecOps SME
    $126,000 to $235,000

    Dice.com

    DGN Technologies
    Dallas, Texas
    Azure DevOps Engineer
    $110,000 to $115,000

    SimplyHired.com

    Sabre Systems
    Lexington Park, Maryland
    Cloud Engineer – DevOps
    $106,000 to $134,000

    LinkedIn

    Deloitte
    Miami – Fort Lauderdale, Florida
    Junior Cloud Infrastructure Architect
    $65,000 to $97,000

  • Operational Intelligence: AI-Powered SRE Measurements and Observability

    Operational Intelligence: AI-Powered SRE Measurements and Observability

    In my recent blog, Revolutionizing the Nine Pillars of SRE with AI-Engineered Tools, I indicated AI can help analyze vast amounts of data from monitoring and observability systems, identifying patterns and correlations that may be difficult for humans to detect. In this blog, I explain, in more detail, how AI-engineered tools can be used to improve the site reliability engineering (SRE) measurements and observability pillar of practice.

    AI Use Cases for SRE Measurements and Observability

    Making Applications Observable: AI tools like Dynatrace can provide real-time observability of applications, identifying trends and anomalies that might not be evident from raw data. Challenges here include the potential for overwhelming amounts of data, which can be mitigated by AI’s capacity to analyze and prioritize this data effectively.

    Making Infrastructure Observable: Tools like New Relic and Datadog use AI to provide insights into the health and performance of infrastructure. The challenge here can be the complexity of modern, cloud-based infrastructures, but AI tools can model these systems and analyze their behavior to provide actionable insights.

    Monitoring Applications in Production: AI can be used to monitor applications in real-time, identifying potential issues before they impact users. Tools like Splunk use AI to monitor application logs, detect anomalies and automatically alert relevant teams. The key challenge here is filtering the signal from the noise, which AI can help by learning which anomalies are significant.

    Monitoring Production Infrastructure: AI can monitor infrastructure health and performance, predict maintenance needs and identify potential bottlenecks. Tools like Zenoss use machine learning to predict infrastructure failures before they occur. One of the main challenges here is the diversity of infrastructure components, but AI can handle multiple data sources and types and integrate this data into a comprehensive overview.

    Tracing and Logging: AI can help manage the vast amounts of data generated by modern logging and tracing systems, identifying patterns and correlations that might be difficult for humans to detect. Tools like Logz.io use AI to analyze log data, detect anomalies and provide actionable insights. One challenge can be the sheer volume of log data, but AI can handle this by focusing on patterns and anomalies and learning over time which issues are significant.

    Production Dashboard Design: AI can help design more effective dashboards by identifying which metrics are most relevant and should be highlighted. Tools like Grafana use machine learning to optimize dashboard layouts based on usage data. The challenge here is determining what information is most relevant, but AI can learn this from usage patterns and user feedback.

    Performance Forecasting: AI can help with predicting system performance based on current and historical data, helping to prevent performance issues before they arise. Tools like Virtana use AI to provide accurate forecasts of system performance, helping teams to plan for future capacity needs. The challenge here is the variability of performance data, but AI can handle this by identifying patterns and trends in the data.

    Automated Root Cause Analysis: AI can be instrumental in quickly identifying the root cause of issues in complex, distributed systems. Tools like RunWhen and Moogsoft use AI to correlate events across different systems and tools, significantly reducing the time to identify the root cause. The challenge here is the complexity of modern systems, but AI can handle this by analyzing data from multiple sources and identifying correlations that might not be evident to humans.

    RoadMap for SREs to Transform Measurements and Observability With AI

    Here is a practical roadmap that organizations can use to transition to AI tools for SRE measurements and observability.

    Understand the Current State: First, an organization needs to fully comprehend its existing monitoring and observability practices. This includes understanding what tools are currently in use, what metrics are being monitored and where the gaps in visibility exist.

    Define Goals and Objectives: The next step is to define what the organization hopes to achieve by implementing AI in its monitoring and observability practices. This could include goals like improving system performance, reducing downtime or predicting system failures before they occur.

    Identify the Right Tools: Evaluate different AI tools to help achieve these goals. This includes looking at AI-powered monitoring tools like Dynatrace, New Relic and Datadog, log analysis tools like Logz.io and Splunk and AI-driven observability platforms like Moogsoft and Zenoss.

    Test and Iterate: Implement the chosen tools on a small scale initially, using a test environment if possible. Monitor the results and adjust your approach as necessary. This step might involve tweaking the AI models, adjusting the data inputs or even trying a different tool if the initial choice doesn’t provide the expected results.

    Training and Upskilling: Ensure your teams are well-versed in using the chosen AI tools. This could include formal training sessions, workshops, or even bringing in external experts to provide guidance. This will help your team to effectively use these tools and get the maximum benefit from them.

    Full-Scale Deployment: Once testing has been successful and the team is comfortable with the tools, deploy them across your production environment. Continue to monitor their performance and make adjustments as necessary.

    Continual Evaluation and Adjustment: AI tools learn and improve over time. It’s important to regularly evaluate their performance and make adjustments as needed. This could involve feeding them new data types, adjusting their models or retraining them based on the latest performance data.

    Summary

    Harnessing the power of AI to revolutionize your SRE practices can propel your organization to new heights. AI tools can significantly enhance the measurements and observability pillar of SRE, providing unparalleled insights into application and infrastructure performance, enabling more efficient monitoring practices and ultimately driving improved system reliability and performance. These tools, such as Dynatrace, New Relic, Datadog, Logz.io and Moogsoft, can transform how your organization perceives and interacts with its technological environment, providing crucial visibility and actionable intelligence.

    Imagine a world where your monitoring systems not only alert you about a problem but also predict potential system failures before they occur and even recommend preventive actions. With the implementation of AI in your SRE practices, this can become a reality. By following a well-defined roadmap that begins with understanding your current state, defining your objectives, selecting the right AI tools, iteratively testing and upskilling your teams, you can pave the way for a future where improved system performance and reduced downtime are the norms. AI-powered SRE practices today can unlock a new era of operational efficiency and system reliability.

  • Embracing Chaos With AI: Reinventing SRE’s Anti-Fragility Practices

    Embracing Chaos With AI: Reinventing SRE’s Anti-Fragility Practices

    In my recent blog, Revolutionizing the Nine Pillars of SRE with AI-Engineered Tools, I indicated that AI can contribute to the development of more resilient systems by analyzing system behavior under stress and identifying vulnerabilities. In this blog, I explain, in more detail, how AI-engineered tools can improve the SRE anti-fragility pillar of practice.

    AI Use Cases for SRE Anti-Fragility

    Fire Drills: AI can assist in creating more effective and dynamic fire drills by predicting potential failures based on patterns and anomalies in data. Tools like Gremlin and ChaosIQ can be used to design, schedule and manage chaos experiments. However, resistance from team members may be a challenge due to the potential for disruption. To overcome this, it’s important to communicate the benefits and ensure there are safeguards in place to prevent unnecessary disruption.

    Chaos Engineering – Infrastructure: By introducing controlled failures in the infrastructure, AI can learn and identify weaknesses that would not be apparent under normal conditions. Tools like Chaos Monkey and Netflix’s Simian Army can be helpful here. A significant challenge could be to deal with the resulting chaos and anomalies. Adequate training and support are required to ensure the teams can handle the chaos experiments and learn from them.

    Chaos Engineering – Applications: AI can introduce failures at the application level to understand how the system behaves and recovers. Tools like Litmus can help conduct these experiments. Challenges could include resistance from developers and potential impacts on the user experience. Having a well-defined scope and process and conducting these experiments in pre-production environments can help mitigate these risks.

    Chaos Engineering – Security of Production Environments: By simulating attacks and breaches, AI can help understand vulnerabilities in the security architecture. Tools like Game of Hacks and AttackIQ can simulate different types of attacks. The main challenge could be the potential exposure of vulnerabilities, making it essential to have robust security measures in place and conduct these exercises in a controlled environment.

    Identifying Reliability Weaknesses in Production Logs: AI can analyze vast amounts of log data to identify patterns or anomalies that may indicate reliability issues. Tools like Splunk and Logz.io can help here. However, the sheer volume and complexity of log data can pose a challenge. To overcome this, robust data management strategies and powerful AI-driven analytics tools should be deployed.

    Predicting System Failures: AI can analyze system usage and performance data to predict potential system failures before they occur. Tools like Dynatrace and New Relic can be useful in this scenario. A major challenge here is the accuracy of predictions, which can be addressed by training the AI model with quality data and continuously refining it.

    Automated Rollbacks: AI can help in the automated rollback of deployments if chaos experiments or real-time monitoring reveal major issues. Spinnaker is one tool that can help in this aspect. The challenge is to ensure accurate triggers for rollbacks without causing unnecessary disruption. This can be mitigated by proper testing and calibration of the AI system.

    RoadMap for SREs to Transform Incident Response to Using AI

    Here is a practical roadmap for organizations that want to transform to using AI tools for SRE anti-fragility.

    Define Anti-Fragility Goals: Define what you want to achieve with your AI-driven anti-fragility measures. Is it to reduce system downtime, improve security or enhance overall system resilience? Defining these goals upfront will help guide the selection and implementation of AI tools.

    Identify Use Cases: As per the use cases listed above, identify those that are most relevant to your organization and your specific infrastructure and applications. Prioritize them based on your anti-fragility goals.

    Evaluate AI Tools: Assess various AI tools available in the market, such as Gremlin, ChaosIQ, Chaos Monkey, Litmus, Game of Hacks, AttackIQ, Splunk, Logz.io, Dynatrace, New Relic and Spinnaker. Look for those that align best with your defined use cases and overall goals.

    Pilot and Learn: Select one or two tools and use cases to start. Run pilot programs to understand the effectiveness of these tools and to gain valuable insights. This step also includes training your team to use these tools effectively.

    Integrate with SRE Practices: Once you have gained sufficient confidence in the chosen tools, integrate them with your existing SRE practices. Ensure that these tools can interact with your current monitoring, incident management and deployment tools.

    Iterate and Improve: Continually measure the impact of these AI tools on your systems’ anti-fragility. Use this feedback to refine your approach, re-adjust your goals, and explore other use cases or tools.

    Expand Scope: As your team becomes more comfortable with AI tools and chaos engineering practices, you can gradually expand the scope of AI-driven anti-fragility measures across more applications, systems and use cases.

    Summary

    The rising complexity of digital systems and increasing customer expectations necessitate a shift towards a more resilient and adaptive approach to system reliability. SRE’s anti-fragility pillar embraces this challenge, allowing systems not just to resist stress but to thrive under it. The incorporation of AI tools in the realm of anti-fragility brings this dynamic resilience to a new level, enhancing capabilities from conducting fire drills and chaos engineering to identifying reliability weaknesses in production logs. With AI-driven tools like Gremlin, ChaosIQ, and Splunk, SREs can effectively simulate failures, analyze intricate system patterns, and proactively fix potential issues to build stronger, more reliable systems.

    Embarking on a journey to harness AI for anti-fragility is an exciting endeavor that promises profound benefits. An achievable roadmap begins with setting clear goals, selecting relevant use cases, evaluating suitable AI tools, and running pilot programs. The key is to integrate these tools into existing SRE practices gradually and iteratively, continually assessing their impact and refining the approach based on the insights gained. This journey is a continuous process of learning, adapting, and expanding, fostering an environment where systems can thrive amidst chaos and uncertainty. The future of SRE is here, and it’s more robust and resilient than ever.

  • Gremlin Adds Detected Risk Tool to Chaos Engineering Service

    Gremlin Adds Detected Risk Tool to Chaos Engineering Service

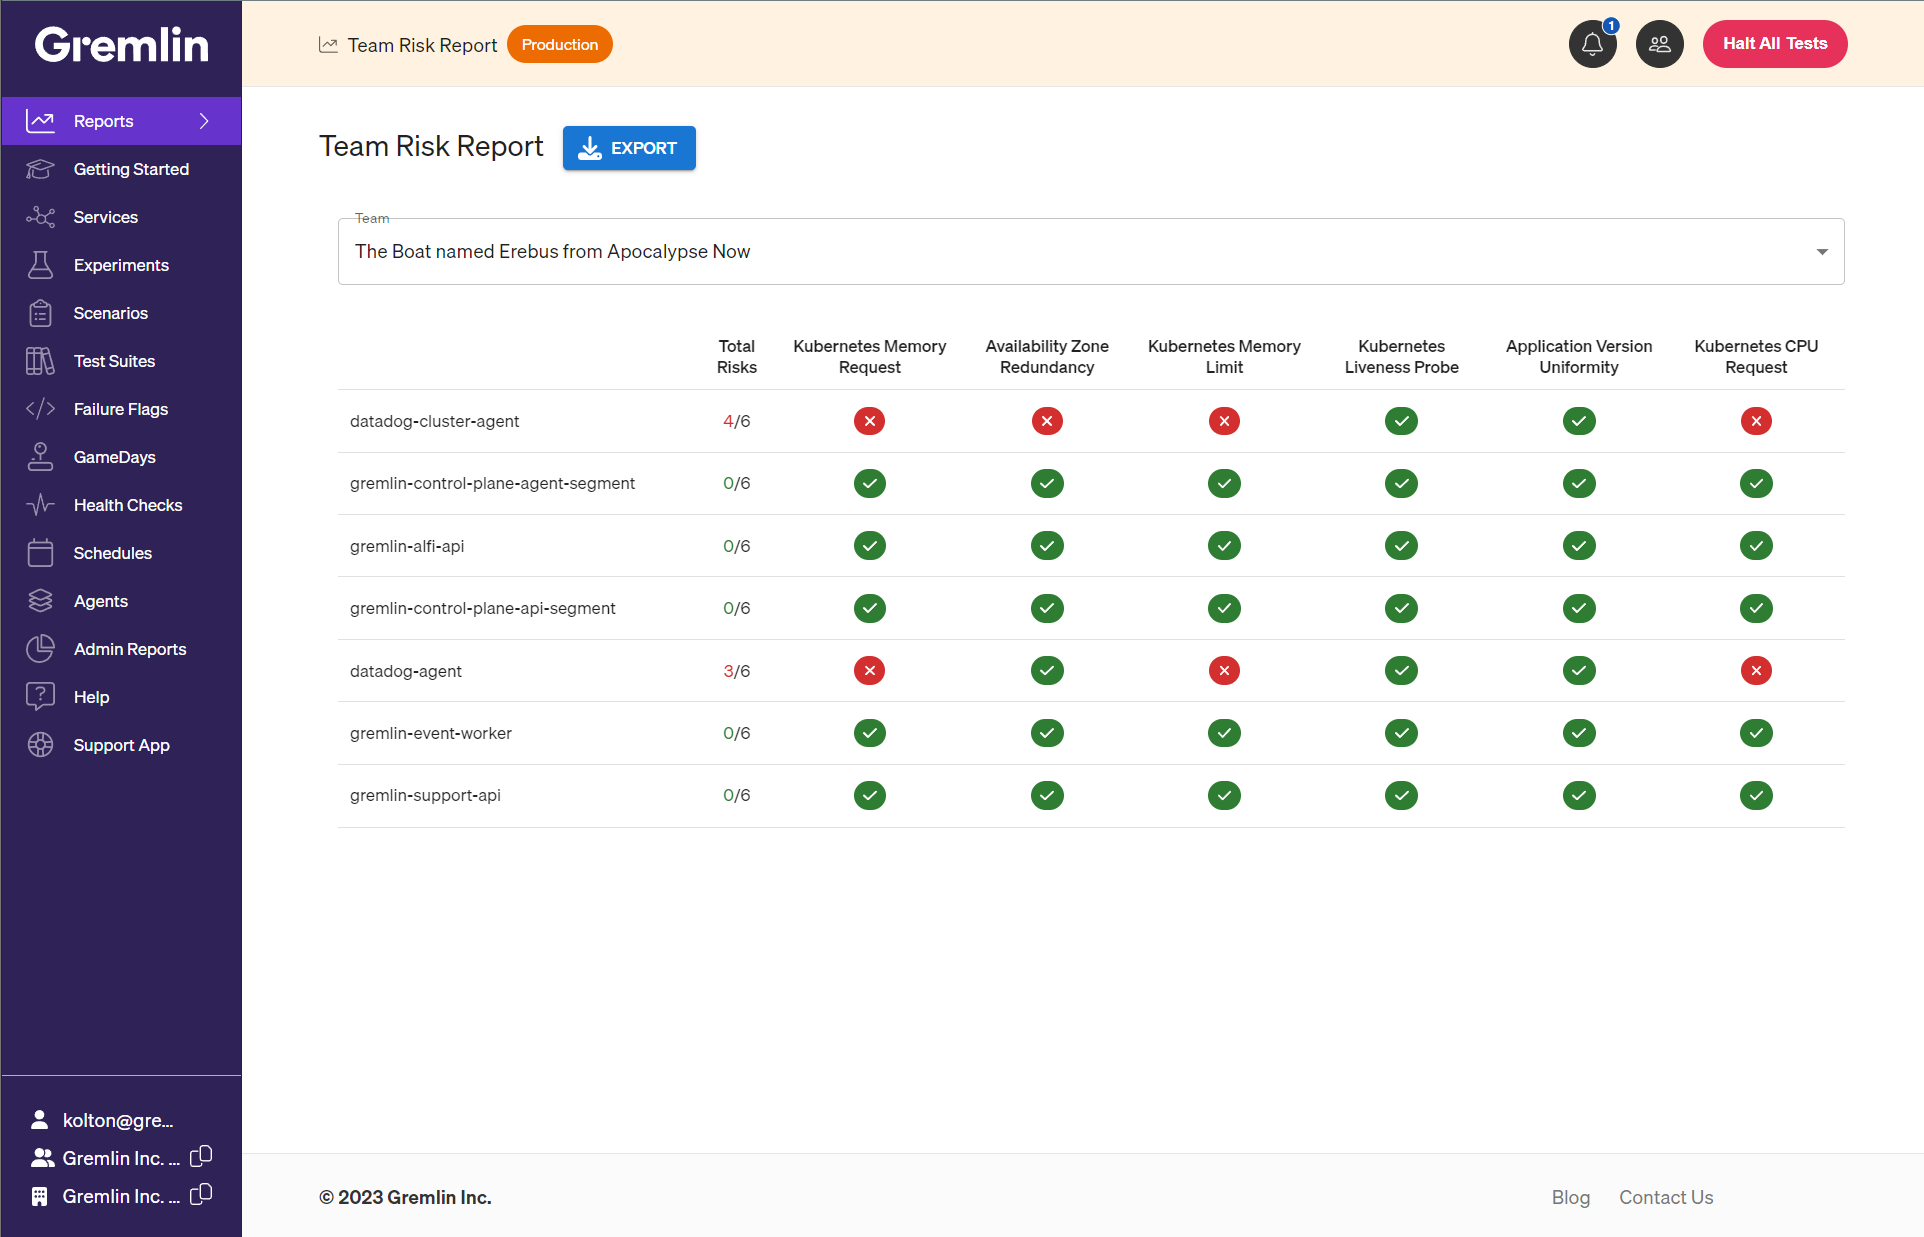
    Gremlin today added a risk detection capability to its chaos engineering service that automatically identifies issues that could cause outages along with recommendations to resolve them.

    Enabled by agent software deployed in an IT environment, the Detected Risk tool makes it possible to benefit from chaos engineering techniques without needing to construct experiments or run reliability tests.

    Gremlin CTO Kolton Andrus said that approach eliminates much of the friction that previously limited adoption of chaos engineering best practices to improve the resiliency of IT environments.

    Chaos engineering is rooted in a resiliency testing philosophy that posits applications should be able to keep functioning regardless of any service or infrastructure failure. Most IT organizations, however, don’t have the expertise required to build the tools required to test resiliency based on the “Chaos Monkey” principles—pioneered by a Netflix project by that name—that, for example, randomly turns services off to see if an application fails.

    Each DevOps team will need to evaluate Gremlin’s recommendations before implementing them, but the overall goal is to provide IT teams with a better understanding of the level of risk attached to, for example, a misconfiguration of a server. To do so, the tool uses a scoring mechanism provided by Gremlin, noted Andrus.

    The challenge is that as IT environments become more complex, the level of dependencies between applications and infrastructure continues to increase. It’s often impossible for DevOps teams to manually keep track of all the hidden dependencies that might exist when IT environments are continuously being updated.

    In theory, of course, adopting cloud-native applications based on microservices should make IT environments more resilient as calls to application programming interfaces (APIs) are rerouted in the event of an outage. Nevertheless, there are almost always dependencies that get overlooked as these applications evolve, which creates a potential single point of failure.

    Naturally, not every IT team is always comfortable with the concept of deliberately breaking things to better understand what issues might cause an outage. As organizations become more dependent on software to drive critical processes, however, a more proactive approach to ensure resiliency is required, added Andrus.

    In fact, business leaders are becoming less tolerant of outages that result in lost revenue, so DevOps teams are being held to a higher level of accountability. DevOps teams may appreciate the value of a blameless culture that encourages everyone to learn from their mistakes, but IT leaders still get fired when there are too many outages, noted Andrus.

    Less clear is the degree to which the rise of artificial intelligence might affect chaos engineering. At the very least, AI models should make it easier to assess levels of risk, but the cost of using those technologies to achieve that goal is substantial, especially when platforms that provide the same outcome already exist.

    Regardless of approach, however, when it comes to resiliency, everyone agrees that the value of application uptime is now beyond measure.

  • Driving DevOps Excellence: Implementing SLOs for Your DevOps Team

    Driving DevOps Excellence: Implementing SLOs for Your DevOps Team

    In today’s fast-paced world of software development, when continuous deployment and frequent releases are the norm, DevOps teams are essential to facilitating smooth communication between development and operations. In a blog post on LinkedIn, I talked about the importance of service level objectives (SLOs) for the testing team to improve the overall product quality. On top of that, let’s look at how adding SLOs to your DevOps team can improve productivity, dependability and client happiness.

    The Role of SLOs for DevOps Teams

    • Aligning DevOps Goals with Business Objectives:

    SLOs help DevOps teams coordinate their efforts with business objectives. The DevOps team can concentrate on delivering real business value by setting precise performance indicators, such as deployment success rates or infrastructure provisioning timeframes.

    • Promoting Collaboration and Accountability:

    By implementing SLOs, several stakeholders—including development, operations, quality assurance and business teams—are encouraged to work together. Over each stage of the software development life cycle, this shared responsibility promotes a sense of ownership and accountability.

    • Driving Reliability and Stability:

    SLOs play a key role in ensuring the stability and dependability of the system. You can be sure that your services consistently fulfill client expectations when your DevOps pipeline adheres to defined SLOs.

    • Proactive Issue Mitigation:

    Monitoring and alerting systems are used together with SLOs. The DevOps team could avoid service outages and downtime by aggressively identifying possible problems and resolving them before they become more serious by regularly monitoring important indicators.

    • Data-Driven Decision Making:

    Decision-making is driven by quantitative data. With the help of such indicators, the team is able to identify bottlenecks, prioritize improvements and streamline processes based on quick feedback.

    Now, let’s explore some key areas where DevOps teams can set SLOs to improve their performance:

    1. Continuous Integration (CI):
    SLO: “xx% of builds complete within Y minutes.”
    Measurement: Monitor build times and queue times regularly.
    Action: Optimize CI infrastructure and configurations to meet the SLO.

    2. Continuous Deployment (CD):
    SLO: “xx% of deployments are successful.”
    Measurement: Track deployment success rate.
    Action: Improve the deployment process to meet the SLO and reduce deployment failures.

    3. Infrastructure Management:
    SLO: “xx% of infrastructure is provisioned within Y minutes.”
    Measurement: Monitor infrastructure provisioning time.
    Action: Optimize infrastructure provisioning scripts to meet the SLO.

    4. Monitoring and Logging:
    SLO: “DevOps tools and system uptime should be at least xx%.”
    Measurement: Monitor the availability of the DevOps pipeline, deployment system and other tooling, including monitoring and logging systems.
    Action: Ensure high availability for DevOps tools and components.

    5. Artifact Management:
    SLO: “Artifact retrieval time should be less than x seconds on average.”
    Measurement: Monitor artifact retrieval time and availability.
    Action: Optimize artifact storage and distribution mechanisms.

    6. Testing and Quality Assurance:
    SLO: “Code must have at least xx% unit test coverage.”
    Measurement: Track test coverage regularly.
    Action: Encourage developers to write more tests.

    7. Security and Compliance:
    SLO: “xx% of compliance checks must pass.”
    Measurement: Monitor the results of compliance checks.
    Action: Ensure necessary security measures to meet the compliance SLO.

    8. Standardized Tools Selection:
    SLO: “xx% of teams must use the approved CI/CD tools stack.”
    Measurement: Track the percentage of teams using the approved tools stack.
    Action: Encourage teams to adopt standardized tools and provide necessary training and support.

    9. Training and Skill Development:
    SLO: “xx% of team members should undergo relevant DevOps training annually.”
    Measurement: Monitor training completion rates.
    Action: Provide training opportunities and resources to help team members enhance their skills.

    Initially, teams should baseline which percentage values to track by observing the current state. In the event they don’t have the bandwidth to baseline, start with any reasonable arbitrary number over a period of time, and it will be automatically refined.

    Implementing service-level objectives empowers DevOps teams to focus on delivering reliable and high-performing services that meet user expectations. By setting clear performance and reliability targets, teams can proactively identify and resolve issues, leading to improved collaboration, efficiency and overall user satisfaction.

    SLOs are not rigid constraints but are a means to drive continuous improvement and foster a culture of excellence within the DevOps ecosystem. As organizations strive to keep up with the ever-changing demands of the digital world, embracing SLOs is a crucial step toward achieving DevOps excellence and ensuring a competitive edge in the market.

  • The Differences Between DevOps, DevSecOps and SRE

    The Differences Between DevOps, DevSecOps and SRE

    DevOps, DevSecOps and SRE are all quickly gaining traction within the tech world due to their effectiveness and promise of reliability for companies. Each framework provides various levels of safety and scalability—DevOps is agile, DevSecOps prioritizes security above all else and SRE focuses on performance optimization. Together, these are changing how software gets deployed from conception to production. We’ll break down each one in detail.

    What is DevOps?

    DevOps is a set of practices that combines software development and IT operations, which aims to shorten the software development life cycle (SDLC).

    DevOps bridges the gap between those two areas by bringing together different people–developers, operators, testers and system engineers–who are responsible for different parts of the software delivery process, from planning to deployment into production environments.

    A core tenet of DevOps is to automate manual processes within each stage of the SDLC, eliminating much of the redundant work that used to take weeks or even months. This automation significantly drives down costs, as well as reduces problems posed by human error when running manual tasks.

    The following are some of the core tenets of DevOps:

    1. Collaboration
    2. Quality and reliability
    3. Automation
    4. Scalability
    5. Security

    What is DevSecOps?

    DevSecOps (or DevOps security) is an emerging field within the DevOps practice that focuses on strengthening software security within the development and operations process.

    These three distinct groups often have different priorities when it comes to building software applications. Developers are focused on speed-to-market objectives from their employers or clients, operations focus on reliability and scalability, while security teams prioritize safety from malicious actors or data breaches. At the same time, with DevSecOps, these goals become united under one umbrella: Build fast and reliable applications with built-in protection against attacks.

    DevSecOps focuses on implementing security as code—or automating many routine tasks involved with identity management, like user authentication and authorization. To ensure that security is properly integrated into your DevOps pipelines, below are some key DevSecOps practices:

    1. Automate security processes whenever possible
    2. Encourage continuous testing
    3. Prioritize remediation over detection
    4. Create a culture around secure coding principles

    What is SRE?

    SRE stands for site reliability engineering. The basic idea behind SRE practices is that software engineers should be responsible for both the development as well as the reliability of their product as a whole. This means having an understanding of not only how users will interact with the application or service but also how it interacts with other services in its operating environment, such as databases, firewalls, cloud environments, etc.

    To maintain uptime while meeting these requirements, SRE applies various techniques like automation and continuous deployment processes to ensure high availability.

    A key goal of site reliability engineering is service-level objectives (SLOs), which measure how consistently a service meets its goals over a given period of time—such as how often it’s available, how quickly it responds to requests made by users or customers—and establishing goals around those SLOs. Achieving objectives like these helps organizations build customer trust in their products and services since it ensures that they have stable and reliable day-to-day operations.

    Here are some of the most important SRE principles:
    1. Automation
    2. Proactive monitoring
    3. Fault tolerance
    4. Measurement and analysis
    5. Service-level objectives (SLOs)

    DevOps Vs. DevSecOps Vs. SRE

    The differences between DevOps, DevSecOps and SRE can be summed up in three main areas: Scope, roles and objectives.

    DevOps focuses on improving the speed of releasing software by automating processes and optimizing collaboration between development and operations teams. This helps organizations create a continuous delivery pipeline to quickly deploy code into production with minimal risk. As such, it is typically focused on development or operations activities and has become synonymous with agile methodologies such as continuous integration/continuous delivery (CI/CD).

    DevSecOps expands upon these concepts to include security considerations from the very beginning of a project’s life cycle instead of tacking them on after the fact. By shifting security left in the process–meaning bringing security earlier into the design phase–teams are able to reduce risk early on while achieving faster results overall through continuous feedback loops.

    As part of this shift left process, DevSecOps practitioners focus heavily on automating security compliance activities as part of their job function rather than waiting until after deployment has occurred.

    Meanwhile, SRE focuses more broadly on keeping the user experience consistent across various products an organization offers by responding to customer needs quickly while creating automation processes that allow common tasks to be repeated without manual intervention from engineers or developers.

    Then there is also platform engineering, which is a closely related yet distinct discipline with its own unique responsibilities. While both DevOps and platform engineering involve automation and working with the infrastructure that supports software development, there are some key differences between them.

    Platform engineering can be defined as a practice that involves developing a standardized platform on which all applications will run. Platform engineers build the underlying infrastructure to support applications, including servers, databases, virtualization layers and networking components using standardized toolsets. An important task for this field is designing an application’s architecture in such a way that allows it to scale easily with increased demand or usage levels. Additionally, they create self-service tools that enable developers on their team to quickly spin up new environments without requiring outside assistance.

    Wrapping Up

    In conclusion, while all three approaches have similar goals–ensuring reliability, speeding up the software delivery process and securing user data–they do so using different strategies:

    ● DevOps favors automation.
    ● DevSecOps puts focus on proactive security measures.
    ● SRE prioritizes optimization, reliability and scalability.

    Each one can contribute significantly when appropriately implemented into any organization’s workflow, depending upon its own specific needs.

  • Strategic Roadmap for SREs: Software Deployments With AI

    Strategic Roadmap for SREs: Software Deployments With AI

    In my recent blog Revolutionizing the Nine Pillars of SRE with AI-Engineered Tools, I indicated that SREs can use AI and machine learning to optimize deployment strategies and minimize risks. In this blog, I explain, in more detail, how AI-engineered tools can be used to improve the pillar that I call deployments.

    SRE Use Cases for AI-Assisted Deployments

    Here are use cases for SREs to use AI to assist with software deployments.

    Pre-Deployment Preparation Activities: AI can analyze the deployment package to assess dependencies, predict potential conflicts and evaluate the readiness of the package for deployment. AI can also assist in configuration management, ensuring the correct configurations are applied based on the deployment environment. Tools like Harness Continuous Delivery use machine learning to predict the success of deployments based on previous patterns and trends.

    Deployment Decision Process Automation: AI can use data from past deployments, current system status and predictive analytics to decide the best time and method for deployment. It can assess the risk associated with the deployment and help in decision-making. Tools like IBM’s UrbanCode Deploy leverage AI to optimize deployment processes based on historical data.

    Deployment Orchestration Using Blue-Green: AI can help orchestrate Blue-Green deployments by managing the routing rules, monitoring the performance of the new environment and deciding when to switch traffic. Tools like Spinnaker, integrated with AI capabilities, can automate this process more effectively.

    Deployment Orchestration Using Canary: In Canary deployments, AI can analyze the performance of the canary instances in real-time, compare it with the baseline and make data-driven decisions about whether to proceed with the full deployment. Canary deployments can benefit from AI tools like Flagger, which automatically advance or roll back deployments based on key metrics.

    Deployment Orchestration Using Feature-Flag Rollouts: AI can help manage complex feature-flag rollouts, analyzing user behavior and system performance to optimize the rollout strategy. Tools like LaunchDarkly provide feature flag management and integrate machine learning for more sophisticated flag controls.

    In-Production Testing: AI can enable more effective testing in production by identifying unusual system behavior, predicting potential issues and recommending areas for focused testing. Chaos engineering tools like Gremlin integrate AI to automate the identification of system weaknesses.

    Decision-Making and Orchestration of Rollbacks: AI can monitor the health of the system post-deployment, making data-driven decisions about when a rollback is necessary. AI can also help orchestrate the rollback process to minimize disruption. Harness Continuous Delivery provides AI-driven rollback capabilities.

    Monitoring Performance of Deployed Artifacts: AI can analyze the performance of deployed artifacts, compare it with baseline performance, and predict potential performance issues. Tools like Dynatrace use AI to provide real-time performance monitoring and anomaly detection.

    RoadMap for SREs to Transform Deployments to Using AI

    Here is a practical roadmap for SREs to transition to using AI tools for deployment.

    Needs Assessment: Begin by understanding the current state of your deployment processes and identify areas where AI can bring the most benefits. This could be in deployment decision automation, deployment orchestration, in-production testing, rollback decision-making or performance monitoring.
    Tool Selection: Research AI-enabled tools that are available in the market that could fulfill your specific needs identified in step one. Some of these tools could include Harness Continuous Delivery, IBM’s UrbanCode Deploy, Spinnaker, Flagger, LaunchDarkly or Gremlin. Remember to evaluate these tools based on their features, scalability, compatibility with your existing systems and cost.
    Pilot Program: Implement a pilot program with the selected AI tools on a small scale or in a non-critical environment. This will allow you to evaluate the tool’s effectiveness, understand its strengths and weaknesses and refine its configuration and usage in your environment.
    Training: Ensure your SRE team is adequately trained to use the selected AI tools. This could involve formal training sessions, self-guided learning resources or hands-on practice in a sandbox environment. Remember, the tool is only as good as the person using it.
    Gradual Rollout: Once you’re confident in the tool’s effectiveness and your team’s ability to use it, begin a phased rollout of the tool in your production environment. Monitor closely and be ready to adjust as necessary.
    Continuous Improvement: Regularly review the tool’s effectiveness and look for ways to further optimize its usage. Stay informed about updates to the tool and industry best practices, and continually adjust your processes to stay ahead of the curve.

    Summary

    AI’s role in enhancing SRE practices, specifically software deployments, is revolutionizing the efficiency and reliability of deployment processes. From pre-deployment preparation to monitoring the performance of deployed artifacts, AI tools can automate complex tasks, make more informed decisions and improve the speed and reliability of deployments. Whether you’re using Blue-Green, Canary or feature-flag rollouts or you’re navigating decision-making for rollbacks, AI tools like Harness Continuous Delivery, UrbanCode Deploy, Spinnaker, Flagger, LaunchDarkly and Gremlin can be game-changers.

    However, transitioning to AI-driven deployments isn’t an overnight switch; it’s a journey that requires strategic planning and execution. Starting with a thorough needs assessment, choosing the right tools and implementing them via a pilot program is the first leg of this journey. Training your SRE team on these tools and rolling them out gradually in your production environment will ensure a smooth transition. And the journey doesn’t end there. Regular tool effectiveness reviews and staying up-to-date with the latest in the tool’s features and best industry practices will ensure that you’re getting the most out of AI in your deployment processes. Embrace the AI revolution in SRE to stay ahead of the curve in the fast-paced world of continuous software deployments.

  • AI: A Game-Changer for SRE Work-Sharing and Technical Debt

    AI: A Game-Changer for SRE Work-Sharing and Technical Debt

    In my recent blog, Revolutionizing the Nine Pillars of SRE with AI-Engineered Tools, I indicated that AI can assist work-sharing and incremental technical debt. For example, AI can help analyze code and infrastructure changes to assess their impact on technical debt. In this blog, I explain in more detail how AI-engineered tools can be used to improve the SRE work-sharing and technical debt pillar of practice.

    AI Use Cases for SRE Work-Sharing and Technical Debt

    Sharing Wisdom of Production: AI tools like Splunk and Datadog can analyze log files and telemetry data to uncover hidden patterns and trends, improving system understanding and enabling knowledge sharing. Challenges include integrating these tools into existing infrastructure and managing the vast amount of data generated. Clear data governance policies and proper tool configuration can help overcome these.

    Collaboration with Development, QA and Security: AI-powered platforms like GitHub and GitLab can automate code reviews, identify security risks and even suggest code improvements, fostering collaboration. Integrating these tools into existing workflows can be challenging, but this can be mitigated by providing proper training and phased integration.

    Backlog Grooming: Tools like Atlassian’s Jira, powered by machine learning algorithms, can prioritize the backlog by predicting issue impact, allowing SREs to focus on higher-priority tasks. The challenge is to integrate these tools seamlessly into the workflow, which can be achieved through comprehensive onboarding and training sessions.

    Participation in Sprints: AI tools like Tara.AI can predict sprint velocity based on historical data, helping teams adjust their workload. The challenge lies in adjusting to the predictions and estimates provided by these tools, which can be managed by slowly incorporating AI guidance into sprint planning and review processes.

    Participation in Testing: AI in testing tools like Testim.io and mabl can automate test cases and intelligently adapt to changes in the system, reducing the time and effort required for manual testing. The challenge lies in selecting and configuring the right AI testing tools for your specific context, which can be mitigated by conducting a thorough needs and gap analysis before tool selection.

    Participation in Automation of Environments: AI tools like Hashicorp Terraform can help automate infrastructure provisioning and management. The main challenge is understanding and defining infrastructure-as-code (IaC), which can be overcome with training and leveraging IaC best practices.

    Participation in Release Management: Tools like UrbanCode Velocity harness AI to provide insights into the release management process, enabling better decision-making. However, integrating these insights into existing release management workflows can be challenging. Slow, phased integration of AI tooling supported by training can help.

    Sharing On-Call Duties and Incident Response Activities: AI tools like PagerDuty and xMatters use machine learning to automate incident response, helping reduce on-call burnout. The challenge is ensuring the AI doesn’t overlook critical incidents due to false positives or negatives, which can be mitigated by continuous tuning of the AI model and maintaining a human in the loop.

    RoadMap for SREs to Transform Incident Response Using AI

    Here is a practical roadmap an organization can follow to implement AI tools for SRE work-sharing and technical debt:

    Identify the Need and Set Goals: The first step involves identifying the specific areas where AI tools could help in work-sharing and technical debt management. It’s essential to set clear, measurable goals for what you hope to achieve with AI.

    Conduct a Gap Analysis: Understand your current tooling and processes and identify where the gaps are. Evaluate how AI could fill those gaps and improve your processes.

    Select the Right Tools: Some tools that could be helpful include Splunk or Datadog for data analysis and sharing production wisdom, Jira for backlog grooming, Tara.AI for sprint planning, Testim.io or mabl for automated testing, Terraform for automating infrastructure and PagerDuty or xMatters for incident response. However, the exact selection will depend on the specific needs and context of your organization.

    Phased Implementation: Start by introducing AI tools in the areas where they can provide the most immediate benefit. A phased approach helps manage the transition and reduces the risk of disruption.

    Training and Support: Ensure your team is trained in using the new tools and understands how to interpret the insights they provide. This may involve external training or bringing in experts to provide in-house training and support.

    Measure and Adjust: Continuously evaluate the effectiveness of the AI tools against your initial goals. It’s likely that you’ll need to make adjustments along the way, either to the tools themselves or to the way you’re using them.

    Iterate and Expand: Once the tools have proven their effectiveness in one area, you can start to expand their use into other areas of work sharing and technical debt management.

    Summary

    Transforming the way we approach work-sharing and technical debt management within SRE practices through AI can propel teams toward increased efficiency and better outcomes. By leveraging intelligent tools, we can automate routine tasks, predict and manage technical debt more effectively, enhance our decision-making in sprints and deployments and create a more collaborative and insight-driven environment. AI tools such as Splunk, Datadog, Jira, Tara.AI, Testim.io, mabl, Terraform, PagerDuty and xMatters provide an arsenal of capabilities that can revolutionize how we handle everything from backlog grooming to sharing production wisdom and incident response.

    Embracing this transformation requires a well-thought-out strategy. A roadmap that begins with identifying needs and goals, conducting a gap analysis, selecting the right tools, implementing in phases, training teams and continuously measuring and adjusting for effectiveness can guide the journey. It’s about ensuring that AI serves its purpose in empowering SRE teams, fostering a culture of shared responsibility and knowledge and, ultimately, improving the reliability and efficiency of our systems. This evolution holds immense potential, and we are just starting to tap into it.