Splunk this week at its .conf18 conference continued a campaign to extend the reach of its operational analytics platform into the realm of DevOps through a partnership with Puppet.
Spunk also announced the 4.0 release of Splunk IT Service Intelligence (ITSI), which extends a platform for managing IT using machine learning algorithms by integrating it with incident management software Splunk gained via its acquisition of VictorOps. Other new capabilities include support for a set of key performance indicators (KPIs) for tracking metrics such as application workloads and the ability to do root cause analysis on any event the machine learning algorithms predict.
Andi Mann, chief technology advocate for Splunk, said the alliance with Puppet furthers Splunk’s ambitions to be a primary source of data used to inform automation frameworks that are at the heart of any set of DevOps processes. Over time, Splunk will continue to expand its DevOps partnerships with an eye toward being the analytics platform used to trigger automated processes using frameworks developed by Puppet and others, he said.
At the same time, Splunk continues to develop orchestration capabilities of its own based on technologies it gained via its acquisition of Phantom. While that orchestration software primarily is used today in a security management application, Mann said Splunk is now looking at applying that software more broadly, as it encouraged developers to build applications using a Splunk Developer Cloud now in beta.
Mann said that when it comes to machine learning in IT operations, otherwise known as AIOps, the most challenging task ahead is establishing trust. IT professionals are not going to sanction a “black box” approach that doesn’t enable them to see how a machine learning framework is determining what to automate. Because of that issue, Mann said, providing a root cause analysis capability in ITSI is critical.
The next big issue facing organizations, he noted, is improving the quality of the data being used to inform a machine learning framework. One of the benefits of the DevOps movement is that, as developers take responsibility for both building and running applications, more of them are paying attention to how log data is being created. Mann said the notes developers leave within an application on how to resolve issues are becoming more detailed, a process that Splunk refers to as “semantic logging.”
Mann noted the goal is to create a closed-loop system where every IT issue eventually creates a ticket in a DevOps system for developers to address. The bridge between those processes will be the chat capabilities provided by the VictorOps incident management platform. In fact, Mann said Splunk is moving from being a provider of log analytics software to being a provider of a continuous monitoring solution that analyzes data both stored in logs and in near real-time using a Splunk Data Stream Processor, which is currently in beta.
It may take a while for that loop to be completely closed. But it’s clear that many of the tools that IT operations teams rely on today are becoming increasingly DevOps-friendly.
On the heels of its recent acquisition of VictorOps, provider of incident management software, for $120 million, Splunk is gearing up to expand its foothold in DevOps significantly.
Rick Fitz, senior vice president of IT Markets for Splunk, said the provider of widely used operational analytics software in the enterprise sees a significant opportunity to expand its presence across a range of DevOps processes.
Incident management is a natural extension of operational analytics, said Fitz, noting Splunk chose to acquire VictorOps because the investments the company has made in applying machine learning algorithms to monitoring IT events. That approach significantly reduces the number of irrelevant alerts being generated and provides actionable intelligence into potential events that could adversely impact IT operations.
Most IT operations teams suffer from alert fatigue, Fitz noted, and most alerts are ignored because of a lack of context. The combination of Splunk and VictorOps will result in alerts that more precisely identify the root cause of any IT issue, he said, and a better overall “systems of engagement” for IT operations teams in keeping with DevOps principles.
Splunk has been steadily expanding its focus on DevOps. Earlier this year the company announced Splunk Insights for Infrastructure, which IT organizations can host on an Amazon Web Services (AWS) public cloud to monitor IT infrastructure deployed anywhere. The latest versions of Splunk Cloud and Splunk Enterprise also make use of machine learning algorithms on top of a revamped metrics engine that enables IT administrators to monitor everything from CPU speeds and available hard disk space to temperature readings in internet of things (IoT) devices and sensors. Splunk recently also added connectors for Docker and Kubernetes, as well as the Apache Kafka messaging platform for streaming data in real time.
IT operations and cybersecurity teams already rely on Splunk operational analytics software extensively to identify anomalies. By investing in machine learning algorithms and acquiring incident management software, Splunk is moving to turn all the data it analyzes into actionable intelligence, which then could be shared in real time with developers to ensure application availability and optimize application performance.
While adoption of DevOps processes in traditional enterprise IT organizations remains spotty, IT vendors that focus on IT operations such as Splunk have clearly seen the writing on the wall. Fitz noted that investments made in machine learning algorithms, for example, will enable IT operations teams to more respond to changing application requirements with greater agility at a time when the IT environment has become exceedingly complex. That agility is critical for any organization engaged in digital business transformation, Fitz said, because invariably those efforts lead to more applications being deployed.
It’s not clear the degree to which incumbent providers of IT operations software will be able to remain relevant in the age of DevOps. But most of them certainly have the financial resources to at the very least acquire a portfolio of DevOps tools that will enable them to exert a lot more influence than many of them have to date.
This week, Splunk, the leader in machine data intelligence, announced the acquisition of IT alerting solution VictorOps for $120 million. My congratulations to the VictorOps team for building a solid product for alert management and collaboration, demonstrating a wicked sense of humor and creating some cool T-shirts.
While the acquisition makes sense on many levels, it does raise broader questions about the need for standalone IT alerting tools. Let me explain why IT alert management as a category faces strong headwinds and how these tools will need to evolve if they are going to remain relevant in a world driven by digital transformation.
What Do IT Alert Management Tools Actually Do?
When an IT outage or service disruption occurs in an enterprise, the first order of business is to restore operations back to normal. IT outages can cost you a lot (an hour of downtime can cost you upwards of $100,000 per hour), disrupt your customer experiences and derail employee productivity. To quickly troubleshoot an IT incident, you’ll need to notify the right subject matter experts who can collaborate together to pinpoint root cause for an outage.
Every day, enterprise network operations center (NOC) teams receive hundreds of alerts from different IT management tools for monitoring, service desk, event correlation and configuration management. A certain percentage of these alerts demand urgent attention from NOC teams who are on-call and readily available for incident support.
Enter IT alert management tools, whose job it is to manage the notification of messages to personnel based on predefined rules regarding who to notify for a given categorization of event or incident. Tools from PagerDuty, VictorOps, xMatters, OpsGenie and Everbridge alert the right team members using on-call schedules and notify them using a variety of channels including email, text, voicemail and chat. IT alerting tools help you manage the entire incident life cycle, using on-call schedules, alert routing rules and collaborative war rooms.
Embedded Alert Context: The Missing Piece of the Alert Puzzle
The fundamental challenge with scaling enterprise alert management is about establishing the right context for a flood of alerts that you’ve just received. Instead of forwarding every single alert that you receive, can you share actionable alerts that your NOC teams can immediately act upon?
Your IT alerting tool needs the ability to correlate a bunch of alerts into a single event for faster acknowledgment and troubleshooting. Alert consolidation and correlation call for intelligence that can extract signal from the noise and compress alert volumes with the right inferences. Artificial intelligence for IT operations (AIOps) helps you do just that, by applying big data and machine learning techniques to event management data. With AIOps tools, you can handle events and minimize alert noise by delivering timely and actionable insights for incident support. This agility and insight, coupled with intelligent correlation to stay on top of major outages, helps NOC teams by focusing their attention on the incidents that truly matter.
Without the ability to apply machine learning algorithms to alert floods, alert management tools act as “dumb forwarders” of IT alerts, inducing alert fatigue and adding to the overall noise. It’s time for alert management to get smarter and contextual with machine learning insights.
Splunk’s acquisition of VictorOps is a clear sign that alert management tools as a standalone category can’t truly scale without a solid AIOps foundation. With artificial intelligence, IT teams can stop wasting valuable time figuring out incident triage and root cause analysis and ensure faster recovery from crippling outages with the right event analytics.
Addition of Incident Management Leader to Create Collaborative, Analytics-Driven Platform for DevOps
SAN FRANCISCO–(BUSINESS WIRE)–Splunk Inc. (NASDAQ: SPLK), first in delivering “aha” moments from machine data, today announced a definitive agreement to acquire VictorOps, Inc., a leader in DevOps incident management. Under the terms of the agreement, Splunk will acquire VictorOps for a total purchase price of approximately $120 million, subject to adjustment, to be paid in cash and Splunk securities. The acquisition is expected to close during Splunk’s fiscal second quarter, subject to customary closing conditions.
“The combination of machine data analytics and artificial intelligence from Splunk with incident management from VictorOps creates a ‘Platform of Engagement’ that will help modern development teams innovate faster and deliver better customer experiences,” said Doug Merritt, President and CEO, Splunk. “This gives on-call technical staff an analytics-driven platform to monitor issues, resolve incidents and continuously improve. We are thrilled to welcome the VictorOps team to the Splunk family as we extend Splunk’s vision of using data as the backbone of IT.”
“We founded VictorOps to give teams a naturally collaborative way to quickly resolve incidents,” said Todd Vernon, CEO, VictorOps. “By combining VictorOps incident management capabilities and the Splunk platform, organizations will be able to quickly resolve and even help prevent issues that degrade customer engagement. We look forward to joining Splunk and working together to help solve these complex challenges facing every Development and DevOps team.”
AI for Collaborative Incident Management
Customers around the world are demanding innovative digital experiences that place a burden on development teams to innovate faster than ever before; however, challenges such as vague alerts, reactive operations and siloed teams often get in the way of delivering high-quality customer engagements and fully embracing an IT strategy fueled by AIOps.
To combat this, organizations are increasingly turning towards artificial intelligence (AI) and machine learning (ML) solutions to help them focus on critical aspects of the customer experience. By applying ML and AI to monitoring, event management and incident management data, Splunk and VictorOps will enable DevOps teams to speed resolution and learn from past actions to make proactive recommendations.
Thousands of customers use Splunk® Enterprise to proactively monitor, visualize and get answers from their machine data. The combination of Splunk Enterprise and VictorOps will deliver a ‘Platform of Engagement’– combining monitoring, event management, on-call management and ChatOps. Ultimately, this enables modern engineering and operations teams to quickly solve problems in high-velocity deployment environments to maximize customer success.
Nearly all of the purchase price consideration will be paid in cash, funded from Splunk’s balance sheet.
Safe Harbor Statement
This press release contains forward-looking statements that involve risks and uncertainties, including statements regarding the expected benefits of the acquisition of VictorOps, the impact of the acquisition on Splunk’s existing and future products and services, and the capabilities of VictorOps’ products and services, including when combined with Splunk’s. There are a significant number of factors that could cause actual results to differ materially from statements made in this press release, including: difficulties encountered in closing and integrating the merged business, technologies, personnel and operations; costs related to the acquisition; market acceptance of the acquisition and resulting products and services; Splunk’s inability to realize value from its significant investments in its business, including product and service innovations; and general market, political, economic and business conditions.
Additional information on potential factors that could affect Splunk’s financial results is included in the company’s Quarterly Report on Form 10-Q for the quarter ended April 30, 2018, which is on file with the U.S. Securities and Exchange Commission. Splunk does not assume any obligation to update the forward-looking statements provided to reflect events that occur or circumstances that exist after the date on which they were made.
About Splunk Inc.
Splunk Inc. (NASDAQ: SPLK) turns machine data into answers. Organizations use market-leading Splunk solutions with machine learning to solve their toughest IT, Internet of Things and security challenges. Join millions of passionate users and discover your “aha” moment with Splunk today: http://www.splunk.com.
Splunk Insights for Infrastructure Unifies Metrics and Logs to Monitor IT Performance at Low Cost and Free for Small Environments up to Approximately 50 Servers
SAN FRANCISCO – May 1, 2018 – Splunk Inc. (NASDAQ: SPLK), first in delivering “aha” moments from machine data, today announced the general availability of Splunk® Insights for Infrastructure. The new product answers the call for a low-cost way to easily enable systems administrators and DevOps teams to automatically correlate metrics and logs to monitor IT. Splunk Insights for Infrastructure takes minutes to get up and running and is free for small environments up to approximately 50 servers (200GB in total storage). Additional storage capacity can be purchased incrementally, starting at only $3,750 per year.
“Splunk Insights for Infrastructure provides a simple and effective entry point for teams that are just beginning to unlock the power of Splunk Enterprise,” said Todd Kulick, vice president of technology, TiVo. “Splunk Insights for Infrastructure provides a clear and powerful way to view our entire infrastructure or to ‘zoom into’ views of a single machine or small portion of our service, so we can find and fix problems before they affect customers.”
“Splunk is credited with inventing IT monitoring, and Splunk Insights for Infrastructure reinvents the entire market by making it faster, easier and more affordable than ever for systems administrators and site reliability engineers to identify and correct infrastructure problems,” said Rick Fitz, senior vice president and general manager, IT Markets, Splunk. “Splunk Insights for Infrastructure redefines what customers should expect from monitoring and enables them to provide their customers with a positive digital experience while keeping their budgets to a minimum.”
Reduces Complexity in IT Monitoring
In many cases, the underlying infrastructure makes it difficult for IT Operations and DevOps teams to quickly and easily identify and correct problems. By automatically correlating metrics and logs in one product, Splunk Insights for Infrastructure provides immediate visibility into system performance, enabling customers to quickly detect problems and identify trends.
“Splunk Insights for Infrastructure cleverly combines metrics and logging for a more complete view of infrastructure performance,” said Daryl Robbins, senior cloud architect, Entrust Datacard. “We can use this product to see unusual behavior such as a CPU spike and correlate it with logs to troubleshoot problems much more quickly.”
Easy to Download and Buy – Accessible and Inexpensive Route to Splunk Enterprise
As part of the Splunk Insights product series, which is designed to address use cases with a customized experience that makes it easy for customers to start quickly and affordably, Splunk Insights for Infrastructure bases pricing on storage and includes a free tier (up to 200GB of storage) sufficient for many small teams. As needs grow, all Splunk Insights provide an upgrade path to Splunk Enterprise to leverage machine data and artificial intelligence for multiple use cases.
New customers have the flexibility to download Splunk Insights for Infrastructure directly from Splunk or through authorized Splunk Partner+ partners.
“Splunk Insights for Infrastructure offers partners an excellent opportunity to engage with prospects in a positive first experience,” said Matt Rochford, vice president, technology & alliances, Arrow ECS, North America. “It also permits the customer to expand their use cases as their data driven strategy matures.”
“Splunk Insights for Infrastructure gives us a compelling, easy-to-implement offering that allows our prospects to get up and running with infrastructure monitoring quickly while setting the stage for us to solve additional digital transformation problems,” said Judd Robins, executive vice president, sales, TekStream. “This is a business approach that creates a win-win-win for our prospects, our business, and Splunk by reducing the complexity of deployment and bringing value in a very short period of time.”
Splunk Insights for Infrastructure will also be made available as an Amazon Machine Image (AMI) on the AWS Marketplace soon.
About Splunk Inc.
Splunk Inc. (NASDAQ: SPLK) turns machine data into answers. Organizations use market-leading Splunk solutions with machine learning to solve their toughest IT, Internet of Things and security challenges. Join millions of passionate users and discover your “aha” moment with Splunk today: http://www.splunk.com.
This article’s purpose is to compare the “big two” in the log analytics world—Splunk and the ELK Stack. But before we go into details, a short introduction to the competitors is required.
Splunk is the “Google for log files” heavyset enterprise tool that was the first log analysis software and has been the market leader ever since. The open-source ELK Stack of Elasticsearch, Logstash and Kibana is an up-and-coming rival that is a consolidated data analytics platform. The two compete in terms of features, usability and cost.
Overview
Splunk and the ELK Stack use two different approaches to solve the same problem. People typically choose one or the other based on how their organizations are structured and how much time they want to devote to log analytics. Splunk takes a pile of data and allows people to search through the information to extract what they need. ELK requires more work and planning in the beginning, but the value extraction is easier at the end.
The three key components of Splunk are its forwarder, which pushes data to remote indexers; indexer, which has roles for storing and indexing data and responding to search requests; and search head, which is the front end of the web interface where these three components can be combined or distributed over servers. Splunk also supports the integration of its functionalities in applications via SDKs. Common use cases include operational monitoring, security and user behavior analytics. Splunk is a paid service wherein billing is generated by indexing volume.
The ELK Stack is a set of three open-source products—Elasticsearch, Logstash and Kibana—all developed and maintained by Elastic. Elasticsearch is NoSQL database that uses the Lucene search engine. Logstash is a data processing and transportation pipeline used to populate Elasticsearch with the data (though also it supports other destinations including Graphite, Kafka, Nagios and RabbitMQ). Kibana is a dashboard that works on top of Elasticsearch and facilitates data analysis using visualizations and dashboards.
Both Splunk and the ELK Stack can be used to monitor and analyze infrastructure in IT operations as well as for application monitoring, security and business intelligence.
ELK vs. Splunk
Loading Data
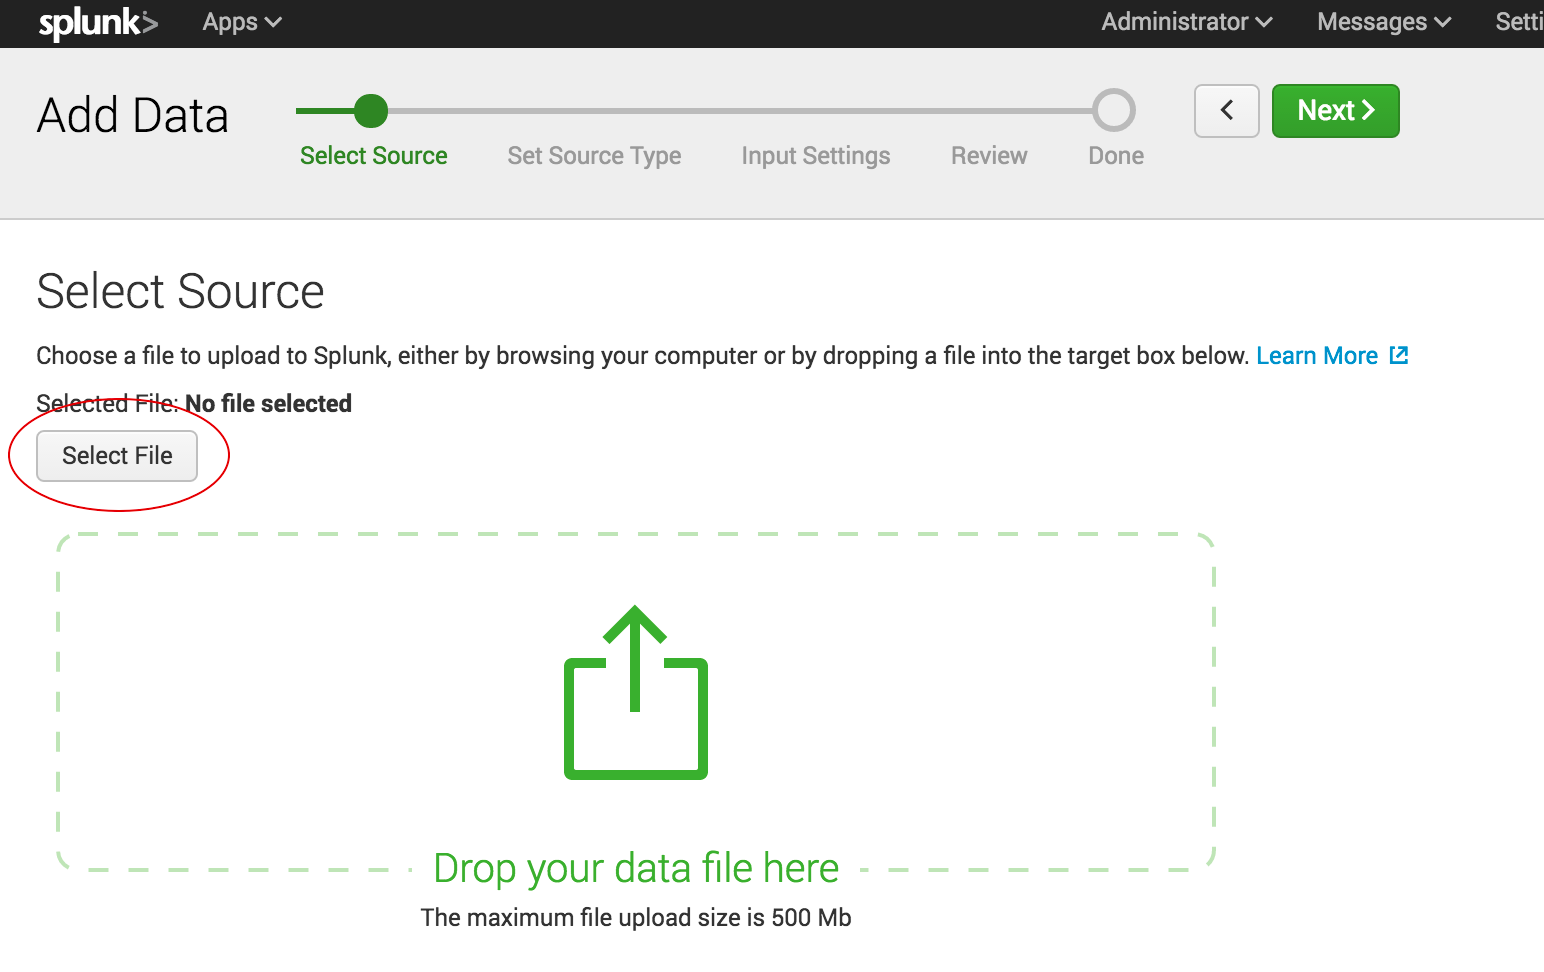
Shipping data to Splunk is fairly easy. After installation, the forwarders come pre-configured for a wide selection of data sources such as files and directories, network events, windows sources and application logs, and they are used to import data into Splunk as shown:
In the ELK Stack, Logstash is used to ship data from the source to the destination. However, Logstash needs to be configured so that each field is identified before the data is shipped to Elasticsearch. This kind of configuration can be tricky for those who do not work with scripting languages (such as Bash, Python or Ruby), but there is good support online that can be found quite easily.
Visualizations
The Splunk web UI includes flexible controls that allow you to edit and add new components to your dashboard. Management and user controls can be configured differently for multiple users, with each having a customized dashboard. Splunk also supports visualizations on mobile devices with application and visualization components that are easy to customize using XML.
Kibana is the visualization tool in the ELK Stack, and like Splunk, the platform supports the creation of visualizations such as line charts, area arts and tables and the presentation of them in a dashboard. The search filter is always shown above the different views: If a query is used, it is automatically applied on elements of the dashboard. Splunk also has a similar option, but it involves configuration in XML. Still, Kibana does not support user management, but hosted ELK solutions provide it out of the box.
Search Capabilities
The search function is a key capability of any log management platform. Both the Splunk and ELK Stack’s web UIs support searching using a dedicated search field. The query syntax on Kibana is based on the Lucene query syntax while Splunk uses its own Splunk Search Processing Language (SPL). Those familiar with scripting languages may already be familiar with Lucene while SPL is proprietary and must be learned.
One other difference is that Splunk offers dynamic data exploration to help users to find and extract everything as a searchable field when formatted in a manner that allows searching for non-configured fields. Elasticsearch fields, on the other hand, need to be defined in advance to use aggregation over the log properties.
Here is one example of a query for each platform.
Kibana:
(beat.hostname: ES1 AND metricset.name: process) AND (system.process.username: root OR system.process.username: admin)
Splunk:
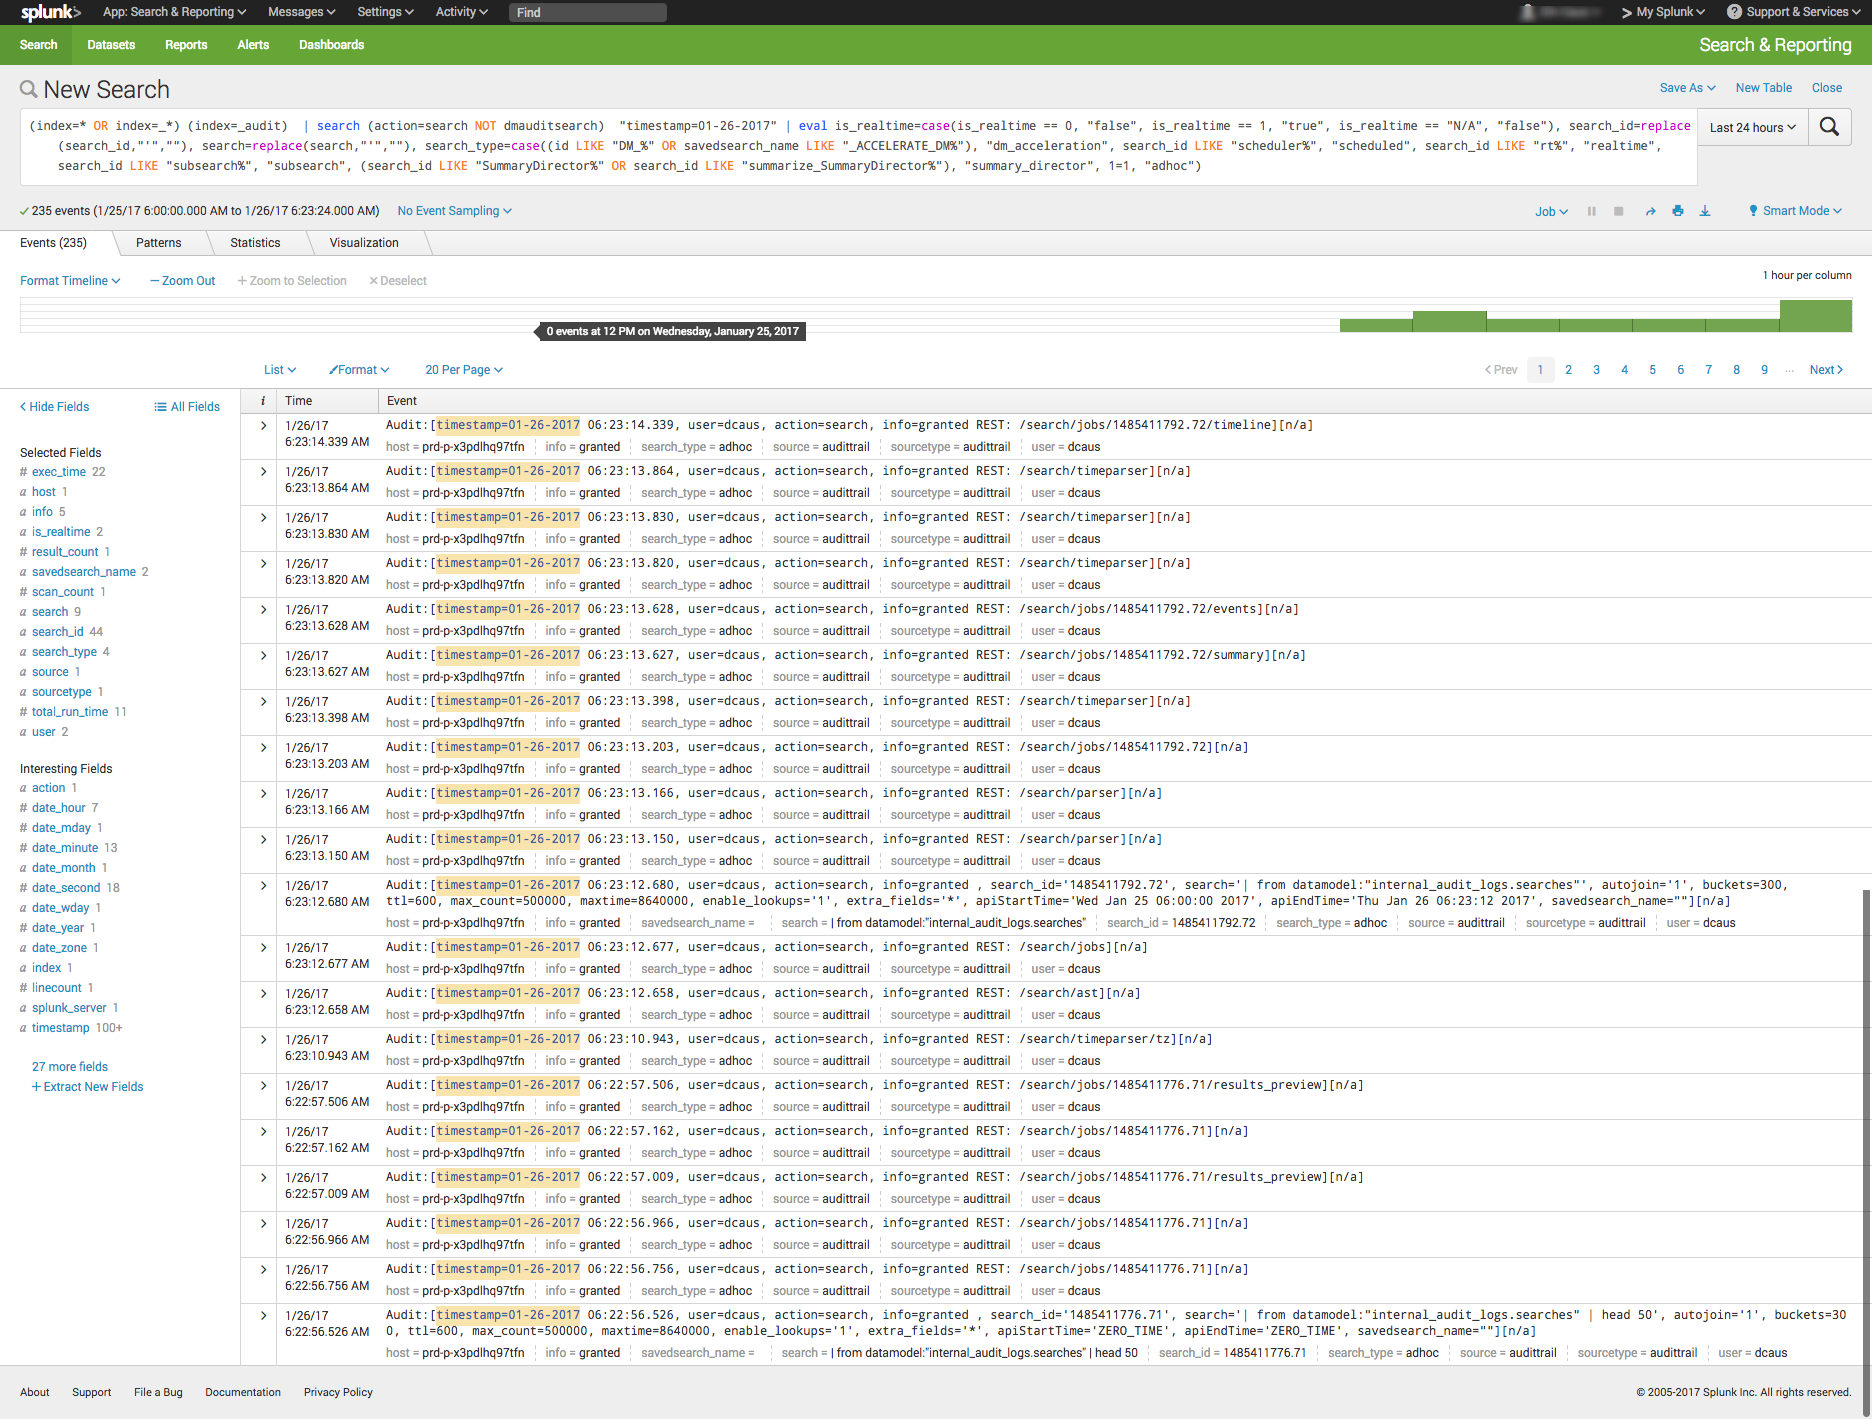
(index=* OR index=_*) (index=_audit) | search ( action=search NOT dmauditsearch ) "06:54"
The difference between SPL syntax and Lucene queries is that SPL supports the search pipeline (as in the example above) in which consecutive commands are chained together using a pipe character that allows the output of one command to be used as the input of the next one. Lucene query syntax is more straightforward and can work to generate the output from the query without additional transforming.
Traction and Community Support
Both Splunk and ELK Stack have large communities of users and supporters. ELK also has its own clear and extensive documentation for each separate tool, making it easy to get started. In addition, Elastic itself offers educational sessions worldwide.
In addition to having good documentation and a forum, Splunk, too, has customer and support platforms that offer various professional services. Splunk’s education program and instructors are available virtually or on site.
The Learning Curve
The ELK Stack’s learning curve is flat for what it’s meant to do. Elastic offers paid courses, but there is a lot of free material online due to the popularity of the open-source platform.
For Splunk, the learning curve is moderate in size, especially when carrying out more specialized analyzes. The company offers a trial period with extensive documentation, but the advanced Splunk educational courses are fairly expensive.
User Management
The ELK Stack provides role-based security as a separate paid tool. Splunk and managed-ELK services offer user management out of the box with user auditing included.
Pricing Levels
As already mentioned, Splunk is proprietary software with a price tag. After one integrates several data sources with the platform, the cost will increase greatly as data is continuously generated.
The open-source ELK Stack is free, but the true picture is not so black and white. The cost of the platform’s hardware and maintenance also adds up. To lower the cost of using ELK, features, plugins and tools must be developed.
Vendor Lock-In
Splunk’s high price tag comes with the benefit of offering an overall, well-rounded product. Users might be locked into a vendor, but that one vendor is all that is needed to do nearly anything. The open-source ELK Stack is seemingly free, but it does not provide many functionalities such as alerting out of the box—and it costs money to develop and maintain them.
One way to look at the Splunk-versus-ELK discussion is to frame it as the old Microsoft-versus-Linux debate. If you like Microsoft, you will probably prefer Splunk. If you like Linux, you will likely want to use the ELK Stack.
Final Thoughts
When one decides between these solutions, the ultimate choice should reflect not only on the platform but also on the customer’s specific needs.
Both Splunk and the ELK Stack are currently popular. But what might the future hold?
Splunk (Blue) vs. Elasticsearch (Red) on Google Trends
According to Google Trends, the ELK Stack has now overtaken Splunk in terms of the proportion of Google searches. But ELK’s traction does not stop there. As mentioned earlier, Splunk self-reports 12,000 total users. Elasticsearch is reportedly downloaded 500,000 times every single month. In IT departments, then, it is far more likely to meet people who are familiar with ELK than with Splunk, meaning that the adoption rate of the ELK Stack could “snowball” and increase even more in the future whenever ELK users join new companies or teams. People tend to use whatever software they already know or is already being used.
It’s clear that many functionalities are being added to the open-source ELK Stack. This, in turn, is shrinking the gap between it and Splunk. hose features currently found only in Splunk are likely to be added to ELK at some point in time.
So, if a more mature product is what you need, go with Splunk. But if you like a product that is more flexible, ELK is the way. Either way, it’ll be interesting to see how these two continue to compete.
Editors’ Note: As with all of our contributed articles, the views expressed in this article are of the author, not devopsy.kinsta.cloud. Due to its vendor-agnostic stance, devopsy.kinsta.cloud does not endorse any particular technology.
There was a time when the operations team and the developers regularly were at each other’s throats. The developers were never satisfied with production code updates and the server administrators chafed at developers piling up the serve requests and circumventing the processes.
However, the battle lines have been somewhat erased since the advent of DevOps. IT teams adopting DevOps can move rapidly from concept to production to enhance the business impact, quality and velocity of the application delivery. Many organizations are shifting to DevOps because of its high efficiency and the number of people taking DevOps training are also increasing due to numerous job opportunities in this field.
DevOps Technologies to Know
A number of technologies have emerged to help in the shift to DevOps, providing services ranging from the configuration management to application portability. Following is a list of seven technologies worth noting.
Splunk
Splunk is used for detecting and fixing issues across the life cycle of an application in real time. It allows the developers to see data from the production environments, eliminating the need to access production machines. Splunk enables DevOps processes including continuous integration and deployment.
The Splunk platform is used for DevOps to:
Provide end-to-end visibility across each and every component of the DevOps tool chain.
Utilize the objective metrics to make sure the code meets the quality SLAs and is operational.
Correlate the business metrics with changes in code to obtain new business insights.
ScriptRock GuardRail
ScriptRock Guardrail is designed to rapidly pinpoint the differences in configurations on desktops and servers, comparing the states between systems and over time. ScriptRock Guardrail shows what has changed, helping simplify diagnostics and decreasing downtime.
Developers who work with agile methodologies are accustomed to a test-first way of working with the unit tests, making sure that everything works as planned. As continuous delivery becomes more prevalent, the DevOps and Ops teams need to take a similar approach. This is where the ScriptRock GuardRail comes into its own, providing you the tools to construct and build infrastructure level unit tests and view the results visually, thus making it very easy to rapidly drill into the real problem and get your services running.
ScriptRock GuardRail focuses on addressing the key prerequisites to any DevOps, and, more precisely, initiative and automation. They are described below.
Visibility: The GuardRail platform delivers visual configurations showing differences between like devices, configuration drift monitoring and automated visualization and scanning of network device and server configurations.
Accountability: Users can curate and filter configurations to generate policies that can be utilized to ratify the configurations on a continuous or ad hoc basis.
Automation: All the policies can be exported to Windows PowerShell DSC, Docker, Ansible, Puppet and Chef.
ScriptRock GuardRail works with any automation tool and can be delivered as single-tenant SaaS, multitenant SaaS or a virtual appliance on-premises.
SaltStack
The SaltStack Enterprise Software helps DevOps organizations by organizing the systematic motion of code into production by maintaining the complicated infrastructures refined for optimal application delivery and business service. While DevOps is not a tool, it requires a tool-centric approach to enable continuous delivery. SaltStack helps to configure as well as quickly deploy the dynamic applications and general-purpose infrastructure they run on. DevOps is gaining wide popularity around the world because of the tools like SaltStack that enhances its efficiency.
SaltStack is a cloud infrastructure tool and delivers the systems management for application configuration, cloud building, server provisioning and data automation. It is an event-driven tool and can automate the tasks within DevOps workflow and makes the operations highly approachable for the developers. SaltStack provides a common language and common way to manage the servers and thus helps to bridge the gap between Devs and Ops.
Puppet
Automation is the foundation for many DevOps practices. It is the key to continuous delivery and faster deployments. Automation imposes consistency across the production, testing and development environments. It makes sure users can rapidly orchestrate the changes throughout the infrastructure: container and cloud deployments, virtual machines and bare-metal servers.
No matter where it runs, Puppet provides a standard way of operating as well as delivering a software. Users define what they want their infrastructure and apps to look like utilizing an easy-to-read common language. From there, they can enforce, test and share the changes they want to make across their data center. Reporting and visibility is available at every step of the way to help prove compliance and make decisions.
The Puppet Enterprise enables users to test changes before deploying them to production. With Puppet Enterprise, the infrastructure is defined as code, which enables users to adopt the best practices of agile development including automated deployment and testing, and deliver the software more reliably. This is because the configurations are consistently promoted, shared and tested across all environments, from Dev laptops through test to production.
Atlas
Atlas was the first commercial product released by HashiCorp, provider of open-source tools that enable the efficient deployment of software-defined applications and data centers. Atlas provides visibility into the infrastructure, including virtual machines, containers and servers, in addition to service discovery and configuration management. Building on the popular open-source projects of HashiCorp such as Terraform, Consul, Serf, Packer and Vagrant, the closed-source proprietary Atlas enables DevOps across different cloud services, which include OpenStack, Azure, Google Compute Engine and AWS, and provides a dashboard for maintaining, deploying and developing applications.
Many engineers are shifting to Atlas today for their organizations’ customer engagement platforms. Atlas brings it in one place and enables the companies to handle end-to-end starting from configuration management to container deployments across various cloud environments. Every open-source tool is fine alone, but the capability to handle and orchestrate them as a whole is extremely powerful.
Chef
Chef is a cloud infrastructure and systems framework that automates the management, deploying and building of the infrastructure via repeatable, short scripts known as “recipes.” But the actual strength of Chef lies in its utilization of the pluggable configuration modules(also known as cookbooks), about 2,000 of which are available through Chef community. Facebook, the high-profile user of Chef, recently open-sourced few of its own Chef cookbooks, which include its Grocery Delivery and Taste Tester testing framework, which watches a source code repository such as Git and keeps the local Chef server in sync.
The complex tasks are automated by Chef that are otherwise resource- and time-intensive. But, more importantly, Chef allows users to focus their efforts on improving and innovating the quality of their services. It also opens the door to more efficiency and collaboration across the organization.
Docker
Through its containerization technology, Docker brings portability to the applications wherein the applications run in self-contained units that can be moved across the platforms. It consists of Docker Hub, a cloud service for workflow automation and application-sharing and Docker Engine, which is a lightweight packaging and runtime tool.
Docker has revolutionized the containerization of applications enabling DevOps to package any kind of application in a lightweight environment. The packaging is done in a way as easy as installing a mobile app. Docker is considered as the most popular DevOps tool. By using docker, the developers can containerize their apps and can run them anywhere. Built on top of Linux containers, docker is a powerful ecosystem where DevOps can use many apps (available on Docker Hub) to the maximum advantage.
About the Author / Savaram Ravindra
Ravindra was born and raised in Hyderabad, India, popularly known as the ‘City of Pearls’. He is presently working as a Content Writer at Appmajix Technologies. His previous professional experience includes Programmer Analyst at Cognizant Technology Solutions. He holds a Masters degree in Nanotechnology from VIT University. He enjoys spending time with his friends. He can be contacted at savaramravindra4@gmail.com. Connect with him also on Twitter and LinkedIn.
Splunk Vice President of IT Markets and Chief Technology Advocate Andi Mann sees DevOps moving from an artisanal approach to an IT factory.
This represents a reversal: Historically, developers operated in a factory-like environment, passing chunks of work down the line, but that caused problems because “different managers owned different sections of the production line.”
Agile and DevOps were a response to that issue, he said, resulting in “the artisan developer … the full-stack developer.”‘
The trend is now flowing in the opposite direction, with Splunk customers wanting to see “the whole flow.” Furthermore, enterprise DevOps is too big for an artisanal approach.
“I worry about that [reversal],” he said, but technology can help artisanal quality within an IT factory. Collaboration tools such as permanent video links between different locations enable specialists to work together and understand each others’ work.
“That’s a different kind of factory,” said Mann, in which development, security, QA, operations and other staff do not need physical proximity to work closely together. This is particularly important for large enterprises, he observed, as you cannot pack 1,500 developers into a small space.
One example he cites to show this approach can work is a telco with its developers spread across multiple locations in Sydney and Singapore using DevOps practices to achieve continuous delivery. Another is one of the largest UK retailers getting weekly releases from developers in London and Mumbai, with QA work done at another location in India.
“Executives I talk to are very heavily committed to improving cycle time,” said Mann. But they are also concerned with quality (e.g., problems should be detected and fixed before they reach the user, and the percentage of changes sent for rework should be minimized) and business impact. Executives want to link DevOps to their own KPIs: “Are they moving the needle on my business requirements” such as shareholder value and reputation?
“You get the changes you drive by your measures,” he said, so it is up to managers to make sure their measures make sense in the broader context. It may be time for a balanced scorecard to be applied to DevOps, with metrics in all three areas, he suggested.
These metrics could include code coverage, error rates, customer complaints or trouble tickets raised, plus business impact measures such as click-through rates, cart abandonment, subscriptions cancelled, open rates (for mobile apps) and customer sentiment.
Mann noted executive demand for the adoption of DevOps, even where “they don’t even know what they’re talking about.” He feels it is really about a desire for visibility into the development pipeline, and “that’s really challenging.”
Part of the problem seems to come from the tension between traditional IT (especially “ITIL-owned shops”) and new-generation executives with titles such as head of digital.
Slavish adherence to ITIL practices won’t allow the required speed, may not achieve the expected level of compliance and business goals probably won’t be met, he suggested.
“ITIL came out of a fear of failure,” but failure is no longer catastrophic. “If you’re not failing, you’re not trying, you’re not innovating.” What’s important is to fail fast, fail small, and fail cheap—and DevOps allows IT to fail in low-impact ways. Even when an organization is making significant changes to software, the effects of failure can be contained through measures such as canary releases (where the new versions are initially made available to a small subset of users).
Furthermore, customers are getting used to the idea that technology isn’t and doesn’t need to be perfect, largely because of their experiences with speech recognition services such as Siri, he said.
EnerNOC (Energy Network Operations Center) is an energy intelligence software provider with more than 1,300 employees in its Boston headquarters and international locations. The public firm helps global customers to efficiently consume energy. “Our mission is to change how the world uses energy, helping customers to improve profitability and visibility for better decision-making and sustainability by focusing on how they buy energy and when and how they use it,” says James Nichols, principal engineer and cloud architect at EnerNOC.
A regular user of Splunk (the company uses other DevOps tools and platforms as well, including AWS and Oracle), EnerNOC has fully automated monitoring in its perpetual drive to move past continuous delivery and on to continuous deployment.
Embedded in EnerNOC’s story of why it uses continuous development and continuous deployment models is a chapter on its move to fully automated monitoring.
EnerNOC DevOps Models
EnerNOC’s DevOps model is in constant transition toward full automation. Currently, it has fully automated deployment, fully automated monitoring and semi-automated quality assurance (QA), which pull the company’s continuous development approaches.
A change to “builds on commit” of smaller applications within the legacy software monolith at EnerNOC came hand in hand with further automation, targeting what the company calls “trustworthy continuous deployment,” Nichols says. That was the crux of EnerNOC extending itself into deployment automation.
Wherever the model is not fully automated and continuous in deployment, it remains continuous delivery. “Most of the variance between the approaches is due to aspects of the delivery pipeline that still have manual processes; these parts are usually comprised of the remaining manual testing procedures,” says Nichols.
Change Control Necessitates Two Models
EnerNOC develops and maintains mission-critical software that must pass through a change management approval process. This process includes communications within and across the company and customers, as well as user acceptance testing. This is where the manual testing comes in. Only at the end of this approval pipeline can EnerNOC pass the software baton into the hands of production.
Due to EnerNOC’s tightly yoked systems and the manual testing, change control remains, along with a mix of continuous development and semi-automation with fully automated continuous deployment. “DevOps is a cultural movement as well as a technical one, and so the existing model could evolve with the organization’s quality and maturity evolutions,” says Nichols. If the manual testing and the relationships between systems give way to more fully automated testing and more amenable relationships, QA could more closely embrace full automation.
Monitoring Challenges/Achievements
EnerNOC’s application diversity includes hybrid software with a foothold in the Amazon cloud, in EnerNOC’s data centers and on-premises. “We use three tiers on top of Oracle in the data center. In AWS, we use a combination of big data, cloud-friendly and serverless technologies,” says Nichols. Business transaction data traverses many machines that belong to service groups’ stakeholders. “The distributed, decentralized architecture makes troubleshooting, performance management, security operations and production operations challenging,” notes Nichols. Better monitoring was the answer.
EnerNOC wanted to offer nontechnical users easy access to systems-level monitoring data with transparency into the many systems through a single pane-of-glass dashboard with readily available system notices and troubleshooting abilities. “We would use Splunk to do this and then feedback everything we learned from using Splunk into driving our DevOps and engineering processes into the future,” he says.
The EnerNOC DevOps performance team built the dashboard that accompanied the Splunk service, ensuring it would register the performance metrics that are of value to the organization. The performance, product management and development teams maintain an awareness of the metrics and receive the related alerts. “The development team incorporates the ongoing metrics early in the development life cycle to improve application performance,” says Nichols.
EnerNOC first applied Splunk to web logs for operational capacity planning, then used Splunk to give the Ops team transparency into the function of its new real-time data product that was working in production. As new products came on board, the organization added them to Splunk to provide Ops teams with dashboards, at the urgent request of Ops team members.
Current Status: All Systems Good
EnerNOC applies Splunk to test and production systems for views into consistency and acceleration. “Splunk is our primary alerting infrastructure for low-level system metrics like CPU utilization as well as for complex business transactions that span multiple systems,” says Nichols. Splunk has eyes on application health, cluster state across machines, expected systems tasks and suspect or known-bad system behavior, as well as the presence or lack of any significant event.





 Ravindra was born and raised in Hyderabad, India, popularly known as the ‘City of Pearls’. He is presently working as a Content Writer at Appmajix Technologies. His previous professional experience includes Programmer Analyst at Cognizant Technology Solutions. He holds a Masters degree in Nanotechnology from VIT University. He enjoys spending time with his friends. He can be contacted at
